Technology (IJRASET)
©IJRASET: All Rights are Reserved
435
Case study based vendor selection by TOPSIS and
Pugh Matrix approach
Chaitanya Gawandalkar1, Arun B. Rane2
Department of Production Engineering, Fr. Conceicao Rodrigues College of Engineering
Abstract— Manufacturing industries to succeed, supply chain has a key role to play. Similarly selecting right supplier plays a vital role in product procurement. To have smooth supply chain mechanism every process which has direct or indirect effect on product has to be streamlined right from selecting a supplier to deliver finish goods to customer.
Selection of supplier has many important aspects to consider so that right quality product is delivered at right place at right time at the right price. Technique for Order of Preference by Similarity to Ideal Solution (TOPSIS) plays a vital role in evaluating a vendor for a particular project. For most of the shipments, the payment terms are 45 days from shipping hence along with the cost, quality and delivery plays an important role in any project.
The basic purpose for the research paper is to select the right supplier for the right kind of work to be done with the required constraints. There are various methods, which can be adopted, but the paper describes about Topsis and Pugh matrix method. The validation of Topsis is done by using Pugh Matrix method, on the same grounds of grading pattern. The Pugh Matrix is a type of Matrix Diagram that allows for the comparison of a number of design candidates leading ultimately to which best meets a set of criteria. It also permits a degree of qualitative optimization of the alternative concepts through the generation of hybrid candidates.
Vendor evaluation is done using different attributes including, Quality, Delivery, Cost and standardization of the product. And we conclude that quality and delivery also plays an important role for vendor selection. The paper has a limitation of inclusion of just two methods for getting the optimum results.
Keywords— Supply chain management, vendor selection, TOPSIS, Pugh Matrix, vendor evaluation criteria, multi criteria decision making, multi attribute decision making.
I. INTRODUCTION
In today’s competitive industrial environment everyone is looking to be cost competitive. Today companies have to take decisions in an environment in which it requires to deal with different attributes for decision making. Manufacturing industries are moving from traditional to responsive and more dynamic strategies. Product and service attributes like quality, reliability and organizational abilities to meet market pressures like delivery and service have come into focus recently along with the cost consideration.
The old traditional model of unfocused, short term views and non-holistic vision is replaced by the enlightened approach of focused, holistic and strategic vision. Decision makers frequently faces the challenges of assessing a wide range of alternative options and selecting one based on conflicting criteria. There is a need for simple, systematic and logical methods or mathematical tools to guide decision makers in considering a number of selection criteria and their interrelations. Thus efforts need to be extended to identify those criteria that influence an alternative selection for a given problem using simple and logical methods. This paper presents such simple, systematic and logical methods.
Overall basis we have many vendor selection methods which have their own advantages and dis advantages. Some of the methods are TOPSIS (Technique for order of preference by similarity to ideal solution), AHP (Analytical hierarchical process), ANP (Analytic Network process), Pugh matrix method, Fuzzy logics, Simulation, Regression and many more. This paper has its focus on TOPSIS and Pugh matrix method for vendor selection.All other methods are also used for vendor selectin, but the method of Topsis and Pugh matrix are some of the easiest methods which can be implemented for vendor selection. We can have a debate for the methods of Topsis and AHP, where it can be found that, AHP can be marginally on a higher side with regards to the accuracy but the process is also lengthy. With an increase in the number of attributes the solution becomes lengthy. The paper also shows a case study for getting the practical vision for the vendor selection for a particular product. The paper has a major focus for tackling the problems of vendor selection analytical based with proper reasons for the selection.
Technology (IJRASET)
©IJRASET: All Rights are Reserved
436
attributes. Pugh matrix method fluctuates along the baseline in terms of positives or negatives. It can be further categorized as 3 point method, 5 point method and so on. The basic difference between these methods is the number of points around the baseline. For 3 point method, one is the base line point, one above the baseline and one below the baseline. In the similar manner for other methods the points are selected along the baseline.
Sometimes the vendor selection is done on random basis without any kind of analysis, by just focusing on the selection parameters. But in such cases no analysis can be done with proper reasons. These methods of vendor selection give the exact reasons for vendor selection in terms of numerical values. Another advantage of this approach is to identify the positives and negatives of an individual and hence adopt corrective means to overcome the negatives. These methods can also be used by an individual for any project just to examine the positives and the negatives of the project. This gives a freeway for the individual to improvise the negatives by implementing tactics or methods to convert the negatives to positives.
II. LITERATUREREVIEW
In 2014 Lee C-W introduced a paper on a decision making model of global supply chain risk management. Here the various risks in a business were studied to develop a model so as to overcome the various risks. It took into criteria supply chain risk and supply chain variability. The driving factors for the same were studied to develop a model. The driving factors can be utilized for future studies with regards to the methods explained in this paper.
Again in 2014, Carvalho, H., Azevedo S.G. and Cruz-Machado, V. came up with a model for the earthquakes in Japan and the destruction caused due to the same. 77 different companies were studied for the development of the model of supply chain. The method of TOPSIS and Pugh matrix can be of better help for the different companies for such internal and external affairs model development.
Abylaev, M., Pal, R. and Torstensson, gave a contributionto the field of Supply chain management for developing a resilience model for textile industries. The various aspects in the textile industry are been studied for the model development. Model development is an important factor in the field of supply chain management. Before the actual implementation of a plan, the model is been developed to get an overview of the actual scenario.
Wieteska, G., developed a model for developing a good business relationship between the companies and the suppliers. The development of relations plays an important role for the growth of both the company and the supplier. The various problems in the model development are analyzed and grouped as per the severe ones stating the priorities for the issues.The method of TOPSIS and Pugh Matrix can be of good help for setting the priorities and eliminating the issues. If any company has to select a supplier for any of the outsource activity, Topsis can be utilized so as to get the optimum supplier in terms of any of the evaluating factors. If the evaluation is to be done irr respective of the grading values Pugh matrix can also serve the problem with a much more simple approach.
Li Hao and Xie Qing – Sheng in 2006 developed a paper for the use of TOPSIS in the manufacturing unit. The case study is developed so as to develop a new optimum model for selection of the bids from various suppliers for the manufacturing work to be carried out.The comparison for the bids can be done along with the analysis in Topsis. We can very well judge the positives and negatives for various bidders with regards to the different attributes.
Ji – Feng D introduced the research paper on the fuzzy topsis method so as to rank the various alternatives in any kind of application for getting the best alternatives and developing the worst alternatives into the best ones. Such analysis can help to develop the alternatives at a better level and thus develop the performance of the application. For identifying the best and the worst options these methods of Topsis and Pugh matrix can be utilized. Once obtained the worst ones, steps can be taken to implement ideas to make it better.
Fengrong Z. and Magerhlom A., described the major factors for the third party reverse logistics using the concept of TOPSIS. The basic idea for reverse logistics is for reuse of product and materials. It not only depends on the market but also depends on the demand and the supply of the organization. The attributes accounting includes higher technological strength, circulation reutilization ability, correct transport ability and the ability to have social responsibilities.
III.BACKGROUND
Technology (IJRASET)
©IJRASET: All Rights are Reserved
437
compares a set of alternatives by identifying weights for each criterion, calculating scores for each criterion and calculating the geometric distance between each alternative and the ideal alternative, which is the best score in each criterion. An assumption of TOPSIS is that the criteria are monotonically increasing or decreasing.
Fundamentally a Pugh Matrix can be used whenever there is the need to decide amongst a number of alternatives. Although specifically developed by Stuart Pugh1 to help in selecting between a numbers of design alternatives, the tools has in recent years be used a general purpose decision making aid because of its ease of use.
Multiple Criteria Decision Making (MCDM) refers to making decisions in the presence of multiple usually conflicting criteria. The problem of MCDM can be broadly classified into two categories: - Multiple Attribute Decision Making (MADM) and Multiple Objective Decision Making (MODM), depending on whether the problem is a selection problem or a design problem.
As our problem is a selection problem, here MADM is discussed in detail. MADM is an approach employed to solve problems involving selection from a finite number of alternatives. MADM method requires both inter and intra attribute comparisons, and involve appropriate explicit tradeoffs.
Each decision table (also called decision matrix) in MADM method has four main parts, namely: (a) alternatives, (b) attributes, (c) weight or relative importance of each attributes and (d) measure of performance of alternatives with respect to attributes. The
decision table is shown in Table1. The decision table shows alternatives, Ai (for i =
1,2…,N), attributes, Bi (for j = 1,2…,M), weights of attributes, Wj (for j=1,2…,M) and the measures of performance of
alternatives, mij (for i=1,2…,N; for j=1,2…,M). Given the decision table information and a decision making method, the task of the
decision maker is to find the best alternative and/or to rank the entire set of alternatives. All the elements in the decision table should be normalized to the same units, so that all the possible attributes in the decision problem can be considered. The basic format for the MADM is shown in the below table.
If we review the current status of the vendor selection methods, TOPSIS and AHP is used very widely on a large scale due to their advantages such as easy in understanding and the number of steps remain the same regardless the number of attributes. The Pugh Matrix is not very know or is not intensively used because here the output is not in terms of the exact values but it is in terms of the point method selected. But regardless of the output format, this method can have an important phenomenon of getting the weaker attribute for a particular supplier. Once obtained the weaker attributes, methods can be adopted to improvise the weaker ones and try to convert them into better options.
The method of Topsis holds an upper hand as compared to AHP due to its easiness and understandability. Both are multi criteria decision making methods but in AHP, with an increase in the number of attributes the evaluation becomes little lengthy. Whereas in case of Topsis, irrespective of the number of attributes the steps remain the same. But on the similar ground Topsis holds some drawbacks also. Topsis cannot correlate different attributes to each other and also cannot keep a consistence in the judgement up to some level.
If no importance is to be given to the exact values, we should usually prefer the Pugh matrix method. It shows the positivizes and negatives of various suppliers with regards to different attributes. It is a simple mathematical method which can also be framed giving weights to different attributes as per the need. But the biggest weakness of Pugh matrix is for getting the exact values of the suppliers with respect to the attributes. If we need the valuation of the method, Pugh matrix method fails. These values can be further utilized for the analysis of the final results.
Table 1. Decision Matrix in MADM Attributes
Alternatives B1 B2 B3 - - BM
(W1) (W2) (W3) (-) (-) (WM)
A1 m11 m12 m13 m1M
A2 m21 m22 m23 m2M
A3 m31 m32 m33 m3M
- -
AN mN1 mN2 mN3 mNM
IV.OBJECTIVES
Technology (IJRASET)
©IJRASET: All Rights are Reserved
438
attributes). The attributes may vary as per the need of the product or the project. The attributes can be weighted according to their individual importance. The factor with high importance is given higher weight and similarly carrier on for the rest of the attributes. The problem defines itself as the best vendor selection using the evaluating methods. The selection is been done using the methods of TOPSIS and Pugh Matrix method.
Topsis gives a systematic numerical based output whereas Pugh matrix method only helps to get the best and the worst vendors. If proper analysis is to be done Topsis is always preferred. Pugh matrix method also helps to get the best vendor but with reference to the points taken while analyzing the suppliers.
Other than selection criteria, these methods can also help us out to get the best and the worst attributes. Also further studies can be adopted to convert the worst attributes into the best ones.
These methods are not only used to judge others but can also be utilized by an individual to test his own modes. The particular model can be analyzed for its positives and the negatives and further steps can be implemented or developed to convert the negatives into the positivizes. Thus these methods are also used as self-evaluations.
V. METHODOLOGY
Topsis and Pugh matrix method has the common outcome “best vendor selection”. The methods are used to get the optimum supplier based on the different attributes. The only difference between the two methods is getting the type of results. Topsis helps to get the numerical results whereas Pugh matrix helps to get the results in terms of grades (positives and negatives). The supplier grading is fluctuated along the base line (usually set as zero ‘0’). Finally depending on the positives and negatives the best supplier is selected. The section exclusively explains for the steps/method followed for the various methods.
A. Basic Procedure for TOPSIS
The basic procedure adopted for TOPSIS is shown in the below given flowchart (Fig. 1). It includes the initial data to be driven from the vendor based on the various attributes including Cost, Quality, Standardized product, Delivery, Lead time and many more as per the need.
`
Fig. 1. Steps for TOPSIS
B. Basic procedure for Pugh matrix method
The basic concept of a Pugh Matrix is both simple and elegant. Figure 1 shows a completed Pugh Matrix that has been used to evaluate and select from a number of design alternatives.
Table 2. Basic format for Pugh Matrix method
Criteria Baseline Weights Vendor 1 Vendor 2 Vendor n-1 Vendor n
Criteria 1 S A + + S -
Criteria 2 S B S - - +
Criteria 3 S C - + + +
Criteria m-1 S D - S S -
Criteria m S E + S + S
Total +
Calculate a decision matrix
Rank the alternatives in descending order based on the closeness index Calculate weighted decision matrix
Calculate ideal best and negative ideal solution
Calculate relative closeness index
Technology (IJRASET)
©IJRASET: All Rights are Reserved
439
Total - Total score
Source : Self content
Here criteria are the qualifying factors for the different vendors. S determines the base value.
Weights determine the importance of each criteria for each vendor. + determines the positivity of a vendor for the particular attribute. - determines the negativity of a vendor for the particular attribute. Final evaluation is done by the Total score.
1) Types of Pugh Matrix methods
a) 3 point method
b) 5 point method
c) 7 point method
In each of the specified methods the numbers of points are varied above and below the baseline with similar spaces. Say for 3 point method, the points are -1, 0, +1
For 5 point method, the points are -2, -1, 0, +1, +2 For 7 point method, the points are -3, -2, -1, 0, +1, +2, +3
By using different methods, it can be able to obtain a much more close and competitive solution. But, in average based study vendor evaluation system, 5 point method serves a better deal.
The data on procedure for Pugh Matrix method is with reference to the article “The system Engineering Toolbox” by Dr. Stuart Burge.
C. Steps to be followed for TOPSIS
Step 1: Calculate a decision matrix
The TOPSIS (Technique for Order Preference by Similarity to the Ideal Solution) method, at the first stage ,consist of the composition of the decision matrix A with the values of attributes and the construction of the normalized Decision matrix R based upon matrix A. The elements of matrix R are computed as
Rij = ∑
Where xij is the value of the jth criterion for the ith alternative, and is, an element of Decision Matrix.
Step 2: Calculate weighted decision matrix
The weighted normalized decision matrix is obtained by using the normalized decision matrix R and weights assigned to criteria.
Step 3: Calculate ideal best and negative ideal solution
At the second stage, the ideal (fictitious best) solution S+ and the negative-ideal (fictitious worst) solution S- , are determined,
respectively, as follows
S+ =√∑ ( − )2
S- =√∑ ( − )2
Here i,j € {1,2,3,…..)
Vj = grade value for a particular attribute.
Vij = grade value for a particular vendor w.r.t. particular attribute.
Step 4: Calculate relative closeness index
The relative closeness of each alternative to the ideal solution is computed as ratio
Technology (IJRASET)
©IJRASET: All Rights are Reserved
440
Step 5: Rank the alternatives
Finally, the alternative with the highest value of Ci is selected as the preferable (best) one.
Reference for TOPSIS formulas, Pema B. and Ruben P.,(2012) Application of ahp and topsis method for supplier selection problem, Vol.2, Issue 10,pp. 43-50.
D. Steps to be followed for Pugh Matrix
The process for constructing a Pugh Matrix comprises five steps. This assumes that alternative candidate design options (or decision options) have been determined.
Step 1: Identify and clearly define the criteria for selection. Typically when using a Pugh Matrix to select between a number of candidate design options the design requirements can be used either in part or in whole. Ideally the design requirements should reflect both the user-customer as well as other key stakeholders including internal stakeholders. The robustness and validity of the outcome is fundamentally dependent on an appropriate set of criteria/requirements. Rushing this step usually results in a non-robust outcome that is challenged and overturned.
Step 2: Use one candidate design option as the baseline and core all criteria/requirements as „S‟ (some people prefer to use an O)
for this baseline. If appropriate, a good choice is to, use the previous design for the baseline because it exists and therefore its performance should be reasonably well known.
Step 3: Compare each candidate design option against the baseline design, criteria by criteria (or requirement by requirement) and decide a “pair-wise score with:
S = same + = better - = worse
It is also possible to add extra levels of discrimination by using: ++ = much better
-- = much worse
Some people use a 1 to 5 scale where the baseline/same is a 3 with 1 and 2 being much worse and worse respectively, and 4 and 5 being better and much better respectively
Step 4: For each candidate design option the total score can be calculated by summing the number of +‟s and –„s. The highest
ranked score is the “winner” but use common sense - DON‟T just select “highest” ranked concept.
Step 5: Having scored each candidate design option consider hybrids by combining where possible the best from each alternative. This is form of qualitative optimization.
Step 6: Make the decision and record reasons behind decisions. Quite often with a Pugh Matrix there is no clear “winner” but there is often a clear “loser” in such cases perform a sanity check (does the decision make sense) and remove the losing option. At this point the criteria/requirements can be weighted to give better differentiation. Typically the weighting is on a 1 to 5 scale with 1 the lowest and 5 the highest weighting. If there is still no clear winner, the matrix is basically saying that there is not enough information to discriminate between the options. In such cases it will be necessary to:
Refine the criteria/requirements Use an alternative selection approach
Perform more work to gain the information to be able to select between the options
VI.CASESTUDY
The working of TOPSIS and Pugh Matrix is been shown with the help of a case study on Rocker arm. The initial work is been done by the method of TOPSIS and next it is been verified with the help of Pugh matrix method.
A. Introduction for Rocker arm
Technology (IJRASET)
©IJRASET: All Rights are Reserved
441
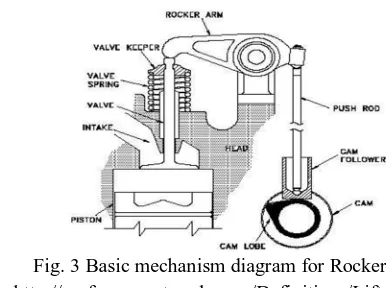
the other end acts on the valve stem. When the camshaft lobe raises the outside of the arm, the inside presses down on the valve stem, opening the valve. When the outside of the arm is permitted to return due to the camshafts rotation, the inside rises, allowing the valve spring to close the valve.
The drive cam is driven by the camshaft. This pushes the rocker arm up and down about the trunnion pin or rocker shaft. Friction may be reduced at the point of contact with the valve stem by a roller cam follower. A similar arrangement transfers the motion via another roller cam follower to a second rocker arm. This rotates about the rocker shaft, and transfers the motion via a tappet to the poppet valve. In this case this opens the intake valve to the cylinder head.
[image:8.612.148.427.168.340.2]
Fig. 2 Rocker arm on Engine Head
Source : http://www.nmradigital.com/2012/06/18/td-machine-products-cleveland-rocker-arm-system/
Fig. 3 Basic mechanism diagram for Rocker arm Source : http://performancetrends.com/Definitions/Lifters.htm
B. TOPSIS Solution
For the selection of the optimum vendor selection by the method of TOPSIS initially the deciding factors (attributes) are finalized. These attributes are the deciding features for the award of the project to a particular vendor.
The attributes include,
1) Standardized Product – if the vendor has his standard product as the rocker arm or any kind of similar parts, the grading is done
accordingly.
2) Quality – Higher the past product quality higher is the grading. The quality certifications of the vendor are also analyzed for the
quality grades. Similar to cost quality also plays an important role for the development of the components.
3) Delivery - This factor is usually analyzed by the past experiences with the vendor for the past projects. If the vendor is a new
vendor then it is usually analyzed by his past projects to different companies.
4) Cost – This is one of the important factors for the judgment of the vendor for awarding the project.
[image:8.612.210.403.368.512.2]Technology (IJRASET)
©IJRASET: All Rights are Reserved
442
Suppliers Standardized Product Quality Delivery Cost
Weights 0.1 0.4 0.3 0.2
X 7 9 9 8
Y 8 7 8 7
Z 9 6 8 9
Here three vendors are analyzed (X, Y, Z) by the method of TOPSIS. The attributes includes Standardized product, Quality, Delivery, Cost.
The attributes are given weights on their importance over the other attribute. Here Quality has been awarded a weight of 0.4, because a rejection in the project on the basis of Quality will result in affecting both the Delivery and the Cost.
Delivery holds an upper hand as compared to Cost depending on the express need of the product. Further cost is weighted as 0.2 and Standardized product as 0.1.
These attributes and their weights can be awarded as per the need of the project and the business awarding unit.
Step 1 a- calculating ∑x2ij2 and sqrt ∑x2ij2
Standardized Product Quality Delivery Cost
Weights 0.1 0.4 0.3 0.2
X 49 81 81 64
Y 64 49 64 49
Z 81 36 64 81
∑x2ij2 194 166 209 194
sqrt ∑x2ij2 13.92838828 12.8841 14.45683 13.92839
The values for each vendor with respect to each attribute are squared in the respective cells. Further a summation value is obtained for each attribute and next we get the square root of the summation value.
Step 1 b- Divide initial grades by sqrt ∑x2ij2
Standardized Product Quality Delivery Cost
Weights 0.1 0.4 0.3 0.2
X 0.502570711 0.698535 0.622543 0.574367
Y 0.574366527 0.543305 0.553372 0.502571
Z 0.646162343 0.46569 0.553372 0.646162
The grade values provided in the original table is been divided with the square root value obtained in the Step 1 a. Thus we get the decimal values for each vendor with respect to each attribute.
Step 2- multiplying by the weights
Standardized Product Quality Delivery Cost
X 0.050257071 0.279414 0.186763 0.114873
Y 0.057436653 0.217322 0.166011 0.100514
Technology (IJRASET)
©IJRASET: All Rights are Reserved
443
The values obtained in Step 1 b. is been multiplied with the respective weights for each attribute. Thus we get the optimum values for each attribute. Say since standardized product, Quality and Delivery is positive attributes the higher values are preferred. Similarly cost is a negative attribute hence the lower value is preferred.
Step 3- Determining Ideal Solution and Negative Solution
Ideal Solution, A* = 0.064616234 0.279414 0.186763 0.100514
Negative Solution, A' = 0.050257071 0.186276 0.166011 0.129232
Step 3 determines the ideal and the negative solution value for each attribute. The positive attributes are shown with higher value as the ideal solution and lower value as the negative value. Similarly, for negative attribute the lower value is accounted as the ideal solution and higher value as the negative solution.
Step 4 a- Determine separation from Ideal solution Standardized
Product Quality Delivery Cost Summation value
S*=sqrt(summation value)
X 0.000206186 0 0 0.000206 0.000412371 0.020306923
Y 5.15464E-05 0.003855 0.000431 0 0.00433759 0.065860383
Z 0 0.008675 0.000431 0.000825 0.009930063 0.099649702
Each cell value is been subtracted from the optimum ideal valve from the above table (step 3). Further the summation value is been obtained for each vendor and finally we obtain the square root of the summation value for each vendor.
Step 4 b- Determine separation from negative solution
Standardized
Product Quality Delivery Cost Summation value
S'=sqrt(summation value)
X 0 0.008675 0.000431 0.000206 0.009311506 0.096496147
Y 5.15464E-05 0.000964 0 0.000825 0.001840144 0.042896901
Z 0.000206186 0 0 0 0.000206186 0.014359163
Each cell value is been subtracted from the optimum negative valve from the above table (step 3). Further the summation value is been obtained for each vendor and finally we obtain the square root of the summation value for each vendor.
Step 5- Relative Closeness C*={S'/(S*+S')}
X 0.826143925 BEST OPTION
Y 0.39442784
Z 0.125947778
As per the above solution, we have concluded that as per the method of TOPSIS vendor ‘X’ is the optimum vendor.
C. Pugh Matrix Solution
The Pugh matrix method initiates on the similar grounds of that of TOPSIS method. The attributes are finalized for the various vendors.
Considering the 5-point method in case of Pugh matrix method we get the following solution.
Technology (IJRASET)
©IJRASET: All Rights are Reserved
444
PUGH MATRIX METHOD-5 point method
Vendors
Baseline Weights X Y Z
Criteria
Std. Prod. 0 1 -1 1 2
Quality 0 4 2 1 -1
Delivery 0 3 2 1 1
Cost 0 2 1 -1 2
Further the values in respective cells are multiplied with the respective weight for each attribute.
The positives and the negatives are summed separately showing the positives and the negatives for each vendor. Further meshing up the positives and the negatives we get a vendor to be called a best vendor. Here the grading pattern for each vendor with respect to each attribute can be different depending the vision of the examiner.
Vendors
Baseline Weights X Y Z
Criteria
Std. Prod. 0 1 -1 1 2
Quality 0 4 8 4 -4
Delivery 0 3 6 3 3
Cost 0 2 2 -2 4
Positives 16 8 9
Negatives -1 -2 -4
Total 15 6 5
BEST VENDOR
Thus from the above solution we can conclude that the optimum vendor obtained is ‘X’.
VII. CONCLUSION
The method of TOPSIS is adopted on a large scale for appropriate selection of the vendor for a particular project. The attributes of Quality, Cost, Delivery and Standardization of product plays a vital role for the final evaluation of the vendor / supplier.
TOPSIS is used to get an appropriate vendor and the Pugh Matrix method is been utilized to validate the TOPSIS solution. Both the methods work on the same grounds with respect to the inputs and the final outputs. The inputs are predefined in terms of the grading done to each vendor with respect to each attribute.
On a large scale basis TOPSIS is used for evaluation purpose due to the exact or appropriate results as compared to Pugh matrix method. Pugh matrix method gives the results in form of other positive and negative factor, whereas TOPSIS gives the exact result for the application. The results developed for the above application is the optimum vendor ‘X’ with respect to the attributes taken into account.
Usually these methods are adopted while awarding a critical project to the vendor.
VIII.ACKNOWLEDGMENT
Technology (IJRASET)
©IJRASET: All Rights are Reserved
445
I feel privileged to acknowledge with deep sense of gratitude to my co-publisher Prof. Arun B.Rane for his valuable suggestion
and guidance throughout my course of studies and help render to me for the completion of the paper.
Last but not the least I would like to thank my family and friends for being pillar of support throughout for which I am very grateful.
REFERENCES
[1] Abylaev, M., Pal, R. and Torstensson, H. (2014) ‘Resilience challenges for textile enterprises in a transitional economy and regional trade perspective – a study
of Kyrgyz conditions’, Int. J. Supply Chain and Operations Resilience, Vol. 1, No. 1, pp.54–75.
[2] Bhutia P. and Phipon R. (2012) ‘ Application of AHP and TOPSIS method for supplier selection problem’ , IOSR J. of Engineering, Vol. 10 , pp. 43-50
[3] Birkie, S.E., Trucco, P. and Kaulio, M. (2014) ‘Disentangling core functions of operational resilience: a critical review of extant literature’, Int. J. Supply Chain
and Operations Resilience, Vol. 1, No. 1, pp.76–103
[4] Boer L. and eta (2001) ‘ A review of methods supporting supplier selection’ , European Journal of Purchasing and Supply management’ , Vol. 7, pp. 75 – 89.
[5] Carvalho, H.,Azevedo S.G. and Cruz-Machado, V. (2014) ‘Supply chain management resilience: a theory building approach’, Int. J. Supply Chain and
Operations Resilience, Vol. 1, No. 1, pp.3–27.
[6] Fengrong Z. ‘Main factor TOPSIS analysis in decision making on the efficiency of third party reverse logistics enterprise’, Vol 1, pp. 492 – 496
[7] Frey D, eta (2008) ‘The pugh controlled convergence method : model based evaluation and implications for design theory’, Springer – Verlag London
[8] Javad D., (2009), ‘ Best project selection methods by group TOPSIS method’ , Int. association of Computer science and Information technology, Spring Conference.
[9] Ji – Feng D, (2011) ‘ An integrated fuzzy topsis method for ranking alternatives and its applications’, J. of Marine science and technology, Vol 19, No. 4, pp.
341 – 352
[10] Kamal M. (2001) ‘ Application of the AHP in project management’ , Int. J. of project management, Vol. 19, pp. 19-27
[11] Lee, C-W. (2014) ‘Establishing a decision-making model of global supply chain risk management from the perspective of risk and vulnerability’, Int. J. Supply
Chain and Operations Resilience, Vol. 1, No. 1, pp.28–53.
[12] LI Hao and XIE Qing – sheng (2006) ‘Application of TOPSIS in the Bidding evaluation of manufacturing enterprises’, 5th Int. Conference on e engineering &
Digital Enterprise Technology.
[13] Liu L. & eta (2011) ‘A conceptual framework for vendor selection based on supply chain risk management from a literature review’, Journal of system and management sciences,Vol. 1 pp. 1
[14] Ng W. (2008) ‘An efficient and simple model for multi criteria supplier selection problem’, European Journal of Operational Research, pp. 1059 – 1067.
[15] Pal O. & eta (2013) ‘ Supplier Selection criteria and methods in Supply chain: A review , Int. J. of Social, Education, Economics and Management Engineering,
Vol. 7, pp. 1395-1401
[16] Peng J. (2012), ‘ Selection of Logistics Outsourcing service suppliers based on AHP’ , Int. Conference on Future electric power and energy systems, pp. 595 –
601.
[17] Sahin R. and Yigider M. ‘A mlti criteria neutroscopic group decision making method based TOPSIS for supplier selection’.
[18] Setek M. and eta (2012) ‘Supplier Selection and order allocation models in Supply chain management: A review’, World Applied Sciences Journal, Vol. 1, pp.
55-72.
[19] Shil N. ‘A case on vendor selection methodology : An integrated approach’.
[20] ]Wieteska, G. (2014) ‘Supplier risk in building B2B relationships – portfolio models approach’, Int. J. Supply Chain and Operations Resilience, Vol. 1, No. 1,