Effect of Machining Parameters on Surface
Roughness of End Milling
Er. N. Balasubramanyam1
M.Tech., Er. P. Gnana Prakash2 M.Tech, Dr.V.Palvannan3M.E., Ph.D, Er.M.Yugandhar4 M.Tech Abstract: This research work deals with the investigation on the effect of process parameters on surface roughness in end milling process. Surface roughness plays an important role in deciding the quality of machining. Mathematical model has been developed to predict the surface roughness in terms of machining parameters such as helix angle of cutting tool, spindle speed, feed rate, and depth of cut. Central composite rotatable second order response surface methodology was employed to create a mathematical model and the adequacy of the model was verified using analysis of variance. The experiments were conducted on stainless steel SS 202 by carbide end mill cutter and the surface roughness was measured using Mituotyo surface test SJ201. The direct and interaction effect of the machining parameter with surface roughness were analyzed, which helped to select the level process parameter in order to ensure quality of end milling.
Keywords: Milling Machine, roughness tester.
I. INTRODUCTION
Quality and productivity play significant role in today’s manufacturing market. From customers viewpoint quality is very important because the extent of quality of the procured item (or product) influences the degree of satisfaction of the consumers during usage of the procured goods. Therefore, every manufacturing or production unit should concern about the quality of the product. Surface roughness plays an important role in product quality and manufacturing process planning. The aim of this study is to identify suitable parameters for the prediction of surface roughness. The various factors that affect Surface roughness are vibrations, material of the work piece, type of machining, rigidity of the system (consisting of machine tool, holding devices, material of tool and work piece), cutting conditions, and type of coolant used. Surface roughness is the important parameter which decides the quality of end milling operation. An effective model to predict the surface roughness becomes essential to ensure the quality and increased productivity in end milling process. A mathematical model has to be developed to predict surface roughness in terms of machining parameters such as helix angle, spindle speed, feed rate and depth of cut. The direct and interaction effect of the machining parameters on surface roughness during milling has to be analyzed.
II. HARDWARE REQUIREMENTS
The hardware required for this experiment is as follows,
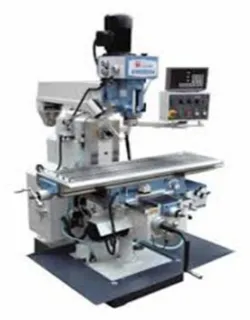
[image:2.612.242.367.534.694.2]A. SIE Vertical Machining Center
Specification sheet: SIE vertical tool room mill Model tm-1 s/n 38380 new 10/2005 Table dimensions 10.5" x 47.45" Table load capacity 1000 lbs X-travel 30"
Y-travel 12" Z-travel 16" Spindle taper #40 Spindle rpm 0 - 4000 Horsepower 7.5 hp
Rapid traverse (x, y, z) 200 ipm
Approx. dimensions 85"w x 64" d, x 106" h Approx weight 3300 lbs
Equipped with: SIE cnc control
Rigid tapping (to be verified) Spray mist coolant
Quick code programming system
B. Milling
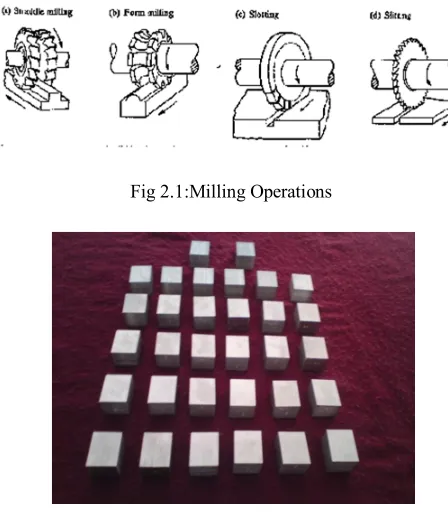
[image:3.612.190.414.400.657.2]Milling is the process of cutting away material by feeding a workpiece past a rotating multiple tooth cutter. The cutting action of the many teeth around the milling cutter provides a fast method of machining. The machined surface may be flat, angular, or curved. The surface may also be milled to any combination of shapes. The machine for holding the workpiece, rotating the cutter, and feeding it isknown as the Milling machine.
Fig 2.1:Milling Operations
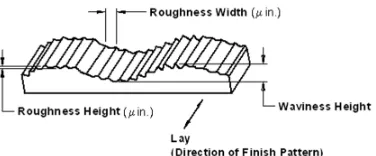
Fig 2.2: Work piece SS 200(32 specimens)
C. Surface Roughness
surface valleys and peaks expressed in micro inches or micro meters. ISO standards use the term CLA (Center Line Average). Both are interpreted identical.
[image:4.612.213.401.176.254.2]The ability of a manufacturing operation to produce a specific surface roughness depends on many factors. For example, in end mill cutting, the final surface depends on the rotational speed of the end mill cutter, the velocity of the traverse, the rate of feed, the amount and type of lubrication at the point of cutting, and the mechanical properties of the piece being machined. A small change in any of the above factors can have a significant effect on the surface produced.
Fig 2.3.Surface roughness Norman culture
Fig 2.4 Surface roughness measurement
Surface roughness of a machined product could affect several of the product’s functional attributes, such as contact causing surface friction, wearing, light reflection, heat transmission, ability of distributing and holding a lubricant, coating, and resisting fatigue.
III. FACTORS INFLUENCING SURFACE ROUGHNESS IN END MILLING
Generally, it is found that the factors influencing surface roughness in turning are:
A. Depth of cut
Increasing the depth of cut increases the cutting resistance and the amplitude of vibrations. As a result, cutting temperature also rises. Therefore, it is expected that surface quality will deteriorate.
B. Feed
Experiments show that as feed rate increases surface roughness also increases due to the increase in cutting force and vibration.
C. Cutting speed
It is found that an increase of cutting speed generally improves surface quality.
D. Engagement of the cutting tool
This factor acts in the same way as the depth of cut.
E. Cutting tool wears
[image:4.612.195.421.306.428.2]F. Use of cutting fluid
The cutting fluid is generally advantageous in regard to surface roughness because it affects the cutting process in three different ways. Firstly, it absorbs the heat that is generated during cutting by cooling mainly the tool point and the work surface. In addition to this, the cutting fluid is able to reduce the friction between the rake face and the chip as well as between the flank and the machined surface. Lastly, the washing action of the cutting fluid is considerable, as it consists in removing chip fragments and wear particles. Therefore, the quality of a surface machined with the presence of cutting fluid is expected to be better than that obtained from dry cutting. Finally, the set of parameters including the above mentioned parameters that are thought to influence surface roughness, have been investigated from the various researchers.
G. Stainless Steel 200 (SS200)
[image:5.612.220.396.303.437.2]Stainless Steel 200 Grade is in a hot rolled Coil form. After processing the Stainless Steel hot rolled coil it gets converted into cold rolled coil which is used in different forms according to the thickeness, Width and the size. The cold rolled is processed into different product such as Stainless Steel Sheet and Plate, Stainless Steel Coil, Stainless Steel Tubes and Pipes etc. The use of Stainless steel coil and strips are increasing used in the process industries, Automobiles, Food & Dairy Industries, Sugar Industries, Watch Industries, Pipes & Tubes Industries, Utensils, Furniture, Architectural Utilities, Thermowares, Chemical process Industries, Electronic Industries, Surgical industries, etc. There is a greater awareness on the use of stainless steel in the building and construction sector. According to latest studies use of stainless steel are also increasing in the industries like food processing industries, Rail industries and Telecommunication industries.
Figure -3: Carbide end-mill cutter
Table-3.1 Milling machine cutting for high speed steel milling cutters
H. Chemical Composition of SS200
[image:5.612.190.425.493.606.2]Fe - 70.01%
Size of the work piece
L*B*T=100*75*40
I. Mituotyo Surface Test SJ200
[image:6.612.173.393.127.228.2]
Fig 3.1 Portable Surface Roughness Tester
J. Mitutoyo SJ-201P Features
1) Large characters are displayed on the large easy-to-view LCD.
2) Portable for easy measurement anywhere necessary.
3) The detector/drive unit can be detached from the display unit for effortless measurement
4) Wide 350µm (-200µm to +150µm) measurement range.
5) Roughness parameters compatible with ISO, DIN, ANSI, and JIS.
6) 19 analysis parameters are provided, including the basic Ra, Rq, Rz, and Ry parameters.
7) Customize function allows hiding of unnecessary parameters.
8) GO/NG judgment on a desired parameter.
9) Auto-calibration for simple gain-adjustment.
10) 10 Measurement data is retained in memory even after the power is turned off.
11) Data output is available for SPC operation.
12) RS-232C interface enables data transfer to computer or other devices using an external device.
13) A dedicated carrying case is included for safe transport
K. Software Requirements
(I)Quality America QC – IV statistical software: Developing mathematical model for the response surface roughness measured by the experiments for various machining parameters levels by using Quality America QC – IV statistical software.
(II) Microsoft office Excel :The direct and interaction effect of variables are analyzed and plotted by Excel.Direct effect means only change in speed ,feed, cutting angle.Interction effect means change both Speed and feed or speed and cutting angle.
IV. DEVELOPMENT OF MATHEMATICAL MODEL
Some of the softwares used in the determination of regression coefficients are as follows:
Quality America (DOE-PC IV) Minitab
MS Excel Design Expert
Among these softwares, using the Quality America Six Sigma Software (DOE- PC IV) been found to be easier to calculate the regression coefficients. Hence, This software is used for experimental study purpose.
A. Steps In Finding Regression Coefficients
The steps used in finding the regression coefficients are explained as follows:
A new file of DOE-PC IV software is opened.
STEP 2:
“Edit” option is chosen from the standard tool bar and now the “Add parameter “option is chosen from the drop down menu.
STEP 3:
Then the name of the input parameter is given in the “Parameter label” and level input parameter is taken as five .
Type parameter label as helix angle and set number of level is
STEP 4
Now click Factor Units option in parameter information menu and set the user defined unit Select userd defind and type the helix angle unit as degree and set upper constraint value as 50 and lower constraint value is 30, decimal places 0,and then ok
STEP 5
Similarly, steps 4 and5 are followed to enter all the input parameters like spindle speed ,feed rate ,and depth of cut along with their respect units and limit values.
decimal places
STEP 6:
Finally, the values of the regression coefficients are obtained from which the mathematical model is developed. Also, the value of F-ratio and R-ratio are obtained to check the adequacy
STEP 7:
By use in Microsoft office Excel get graphs
V. PROBLEM DEFINITION
Surface roughness is an indicator of quality. It is obtained from processed pieces by means of fend milling and accurate control of the dynamic variables, such as rotation speed, feed rate and cut depth. Surface roughness is affected as well by other variables, like the mechanical properties of the material, the geometry of the milling cutter, the number of inserts, the run out errors in the inserts and the vibration produced during the process. The quality of the machined surface has a very important role in the production of complex shapes like precision molds and the production of an engraving matrix..
A. Overview Of The Research Work
Select cutting tool and work piece materials for cutting the experiments. Example: Cutting tool – Carbide end mill cutter,
Work piece material – SS200.
2) Central composite rotatable second order response surface methodology (Experimental Design) was employed for conducting experiments
3) Developing mathematical model for the response surface roughness measured by the experiments for various machining parameters levels by using Quality America QC – IV statistical software.
4) Checking the adequacy of the model developed by applying analysis of variance (ANOVA) technique.
5) The direct and interaction effect of variables are analyzed and plotted by Excel.
6) Documentation and report preparation.
VI. DESIGN OF EXPERIMENTS
Design of experiments is a statistical technique used to study multiple variables simultaneously. Sir. R. A. Fisher of England introduced DOE in early 1920’s. His primary goal was to find the optimum water, rain, sunshine, fertilizer, and soil condition needed to produce the best crop. Using the DOE technique, Fisher was able to lay out all combination of the factors included in experiment study. The conditions were created using a matrix, which allowed each factor an equal number of test conditions. Methods for analyzing the results of such experiments were also introduced. When the number of combinations possible became too large, schemes were devised to carry out a fraction of the total possibilities such that all factors would be evenly present.DOE is highly effective wherever and whenever it is suspected that the performance of a part or process is controlled by more than one factor.
Fig-6 Experimental setup
A. Response Surface Methodology
In statistics, response surface methodology (RSM) explores the relationships between several explanatory variables and one or more response variables. The method was introduced by G. E. P. Box and K. B. Wilson in 1951. The main idea of RSM is to use a sequence of designed experiments to obtain an optimal response. Box and Wilson suggest using a second-degree polynomial model to do this. They acknowledge that this model is only an approximation, but use it because such a model is easy to estimate and apply, even when little is known about the process. The advantages of design of experiments are as follows:
1) Number of trials is reduced.
2) Optimum values of parameters can be determined
3) Assessment of experimental error can be made.
4) Qualitative estimation of parameters can be made.
5) Inference regarding the effect of parameters on the characteristics of the process can be made.
Response surface methodology is the most informative method of analysis of the result of a factorial experiment. In the present work, helix angle of cutting tool, spindle speed, feed rate, depth of cut have been considered as the process parameters and the surface roughness are taken as a response variable (table 6.1). The response surface roughness ‘S’ can be expressed as a function of process parameters helix angle (α), spindle speed (N), feed rate (Z), depth of cut (Y).
Surface roughness, S = ф (αiu, Niu, Ziu, Yiu) + eu
plus 6 center points and 10 star points. These correspond to first 16 rows, the last 6 rows and rows from 17 to 26 respectively in the design plan shown. For ½ replicate the extra point included to form a central composite design, α becomes 2(k-1)/4 = 2. The upper limit of the parameter is coded as 2, lower limit as -2 and the coded values for intermediate values were calculated from the following relationship :
Where,
Xi – The required coded value of a variable X, X – Is any value of the variable from X min to X max Xmin – Is the lower limit of the variable.
[image:10.612.221.392.243.373.2]Xmax – Is the upper limit of the variable. The intermediate values coded as -1, 0 and1.
Fig 6.1 Measurement of Surface Roughness - Mitutyo surf test SJ-200
B. Input Parameters
The following input parameters were chosen for the analysis
1) Helix angle (α)
2) Spindle speed (N)
3) Depth of cut (Y)
4) Feed rate (Z)
C. Output Responses
The following were the output responses chosen for the analysis
1) Surface roughness(S)
D. Limits Of Parameters
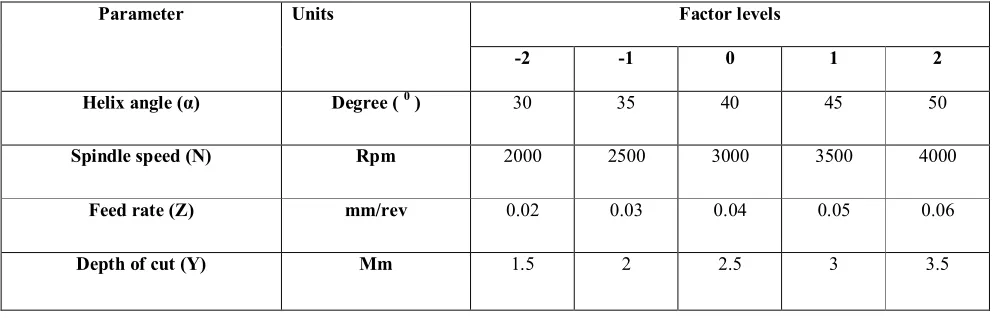
[image:10.612.58.557.575.734.2]The design matrix selected for the experiment is four factor five level central composite rotatable design.
Table 6.4 Parameters and levels in milling
Parameter Units Factor levels
-2 -1 0 1 2
Helix angle (α) Degree ( 0 ) 30 35 40 45 50
Spindle speed (N) Rpm 2000 2500 3000 3500 4000
Feed rate (Z) mm/rev 0.02 0.03 0.04 0.05 0.06
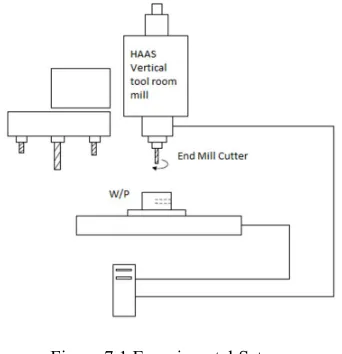
VII. EXPERIMENTAL SETUP
[image:11.612.223.394.159.336.2]The experiments were conducted on a HASS vertical machining center: model tool room mill with carbide end mill cutter under dry condition. The work piece material was SS201 commonly available machinable metal which finds application in automobile and valve industries. The dimension of the work piece specimen was 32mmX32mm in cross section and 40 mm in length. The surface roughness was measured by using Mituotyo surface test SJ201on the flank surface of the end mill cutter specimen and the observations are tabulated to obtain the mathematical model
Figure 7.1 Experimental Setup
A. Development of Mathematical Model
The general form of a quadratic polynomial which gives the relation between response surface ‘y’ and the processvariable ‘x’ under investigation is given by
y = b0 + ∑ ixi + ∑ iixi 2
+ ∑ ijxixj
Where
b0 = constant,
bi = linear term coefficient,
bii = quadratic term coefficient and
bij = interaction termcoefficient.
The values of the coefficients of the polynomials were calculated by multiple regression method. A statisticalsoftware QA Six Sigma DOEPC IV was used to calculate the values of these coefficients. The second ordermathematical model was developed by neglecting the insignificant coefficients of the the surface roughness(S)
Surfaceroughness(S)=(0.353(0.089*α)+(0.09*N)+(0.035*Z)+(0.141*Y)+(0.052*α*α)+(0.042*N*N)+(0.039*Z*Z)+(0.06*Y*Y )-(0.027*α*Y)-(0.029*α*Y)-(0.037*Z*Y))
Where
α = Helix angle in (0)
N = cutting speed in RPM Z = Feed rate in mm/rev
Y = depth of cut in mm
B. Analysis of variance for testing adequacy of the models
The conditions for mathematical model to be adequate
1) F ratio<Standard Tabulated Value
2) R ratio>Standard Tabulated Value
R Ratio= Factors/Pure Error
[image:12.612.60.554.114.232.2]The observed values from the ANNOVA calculations are….
Table 7.1 Adequacy of the model
Response Factors
df
Lack of Fit -df
Pure Erro
r F-ratio
standard R- ratio
Whether Model is adequate
Model Standard Model Standard
Adequate Surface
roughness 11 13 6 1.58 4.03 98.733 3.98
The adequacy of the model was tested using the analysis of variance (ANOVA) technique (table 8.1). The calculated F-ratio of the model does not exceed the standard value and the calculated R-ratio of the model is above the standard value for a desired 95% level of confidence. It is evident from the table 3 that the error between the experimental value and predicted value is less than 5%.
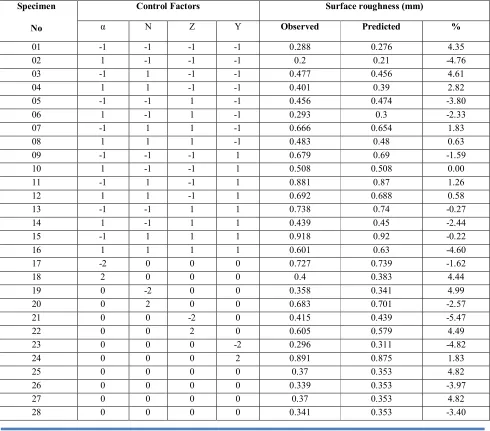
Table-7.2 Experimental design - Central composite design matrix
Specimen
No
Control Factors Surface roughness (mm)
α N Z Y Observed Predicted %
01 -1 -1 -1 -1 0.288 0.276 4.35
02 1 -1 -1 -1 0.2 0.21 -4.76
03 -1 1 -1 -1 0.477 0.456 4.61
04 1 1 -1 -1 0.401 0.39 2.82
05 -1 -1 1 -1 0.456 0.474 -3.80
06 1 -1 1 -1 0.293 0.3 -2.33
07 -1 1 1 -1 0.666 0.654 1.83
08 1 1 1 -1 0.483 0.48 0.63
09 -1 -1 -1 1 0.679 0.69 -1.59
10 1 -1 -1 1 0.508 0.508 0.00
11 -1 1 -1 1 0.881 0.87 1.26
12 1 1 -1 1 0.692 0.688 0.58
13 -1 -1 1 1 0.738 0.74 -0.27
14 1 -1 1 1 0.439 0.45 -2.44
15 -1 1 1 1 0.918 0.92 -0.22
16 1 1 1 1 0.601 0.63 -4.60
17 -2 0 0 0 0.727 0.739 -1.62
18 2 0 0 0 0.4 0.383 4.44
19 0 -2 0 0 0.358 0.341 4.99
20 0 2 0 0 0.683 0.701 -2.57
21 0 0 -2 0 0.415 0.439 -5.47
22 0 0 2 0 0.605 0.579 4.49
23 0 0 0 -2 0.296 0.311 -4.82
24 0 0 0 2 0.891 0.875 1.83
25 0 0 0 0 0.37 0.353 4.82
26 0 0 0 0 0.339 0.353 -3.97
27 0 0 0 0 0.37 0.353 4.82
[image:12.612.63.553.313.744.2]29 0 0 0 0 0.37 0.353 4.82
30 0 0 0 0 0.341 0.353 -3.40
31 0 0 0 0 0.338 0.353 -4.25
32 0 0 0 0 0.360 0.343 -3.50
VIII. RESULTS AND DISCUSSION
A mathematical model was developed to predict the surface roughness by relating it with process parameters such as helix angle, spindle speed, feed rate, depth of cut. The direct and the interaction effects ofthese process parameters on surface roughness were calculated plotted are shown in figs.and the cause and effect were analyzed. The trends of the potted direct and the interaction effect of these process parameters help to determine which parameter and parameter interactions are statistically significant in improveing the surface finish . For surface finish ss ,most of the parameters are found to be apparently significant because the levels of significance of each parameter and interaction parameter factors are almost the same.
A. Direct effect of variables
[image:13.612.201.410.354.444.2]In this work, the effects of helix angle, spindle speed, feed rate, depth of cut were experimentally investigated. From figs. 8.1-8.4 it is clear that the helix angle, spindle speed, axial depth of cut and radial depth of cut have a significant effect on surface finish. Irregulaties produced on the surface of the specimen by the cutting tool are termed as surface roughness. The main factors that determine the surface roughness are built up edge, rate of feed and vibrational deflection between tool and the work. The build up edge sheds the fragments of the chip on the surface and is responsible for the fuzzy appearance. Anything that can be done to prevent of stabilize a built up edge generally improve surface quality
Fig 8.1.Direct effect of helix angle
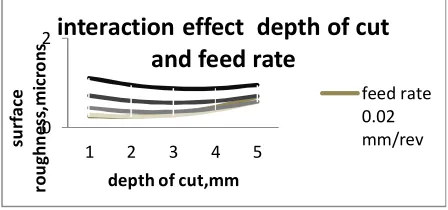
B. Interaction effect of depth of cut and feed rate
Fig 8.2shows the interaction effect of depth of cut feed rate on surface roughness. The observed surface roughness is better only at low feed and high depth of cut. From the graph it is found that the feed is more significant factor than other parameters; whilst depth of cutis the least significant parameter. Further more, the surface roughness reduces with the increase of cutting speed and depth of cut and it increases as the feed increases.
Fig8.2 interaction effect of helix angle and feed rate
0 1
2000 2500 3000 4000 5000
su rf a ce ro u gh n es s, m ic r o n s spindle speed(rpm)
Direct effect of …
0.3 0.5 0.7 0.9 1.1
30 35 40 45 50
su rf a ce ro u gh n e ss ,m ic ro n s Helix angle,degree
interaction effect of helix
angle and feed rate
Fig 8.3 interaction effect of helix angle and depth of cut
Fig 8.4 interaction effect of depth of cut and feed rate
IX. CONCLUSION
The investigation presented a central composite rotatable second order methodology to develop a mathematical model to predict surface roughness in terms of helix angle of cutting tool, spindle speed, feed rate, depth of cut.were arrived from the results of this research work The increase in helix angle of the end mill cutter resulted in better surface finish and there is no much change in surface roughness for helix angle 45 and 50.The decrease in spindle speed resulted reduced surface roughness and it is very effective at the middle level i.e., at a spindle speed 2500 rpm and 3000 rpm.The decrease in feed rate resulted reduced surface roughness and very effective at the middle level i.e, at a feed rate of of 0.03mm/rev and 0.04mm/rev.The surface roughness is found to be nearly constant for the depth of cut that ranges from 1mm – 2.5mm. Beyond that the roughness value is found to increase at a steady rate and may result in poor surface finish. The surface roughness is minimum when the helix angle and feed rate are respectively at their middle value and maximum when helix angle and feed rate at their lower limits .The increase in helix angle resulted in increased surface roughness for all the levels of depth of cutThe surface roughness is better only at low feed and high depth of cut.
REFERENCES
[1]P. Thangavel and V.Selladurai(2009), An experimental investigation on the effect of turning parameters on surface roughness, Int. J. Manufacturing Research, Vol. 3, No. 3,P.No285-299
[2]JingYingZhang, StevenY.Liang, JunYao ,JiaMingChen,(2006) Evolutionary optimization of machining processes JIntellManuf17:203–
215DOI10.1007/s10845-005-6637-z
[3] N.Dhar, M.Kamruzzaman(2006),Cutting temperature,toolwear,surface roughness and dimensional deviation in turningAISI4037steel under cryogenic...,International Journal of Machine,Tools&Manufacturedoi:10.1016/j.ijmachtools.2006.09.018
[4] VedatSavas & CetinOzay(2007), The optimization of the surface roughness in the process Of tangential turn-milling using genetic algorithm, IntJ Adv Manuf Technol 37:335–340DOI10.1007/s00170-007-0984-1
[5]Ching-KaoChang· H.S.Lu(2006), Study on the prediction model of surface roughness for side milling operations DOI10.1007/s00170-005-2604-2, IntJ Adv Manuf Technol 29:867–878
[6].Dr.Saad Kareem Shather, Abbas Fadhel Ibrheem(2007), Prediction of Surface Roughness in End-Milling with Multiple Regression Model, Eng.&Tech.Vol.26,No.3,2008
[7] Umesh Khandey(2007), optimization of surface roughness, material, Removal rate and cutting tool flank wear in Turning using extended taguchi approach,
0 2
30 35 40 45 50
su rf a ce ro u gh n e ss ,m ic ro n helix angle,degree
i
nteraction effect of helix
angle,depth of cut
depth of cut3.5 mm depth of cut3mm 0 2
1 2 3 4 5
su rf a ce ro u gh n es s, m ic ro n s
depth of cut,mm
interaction effect depth of cut
and feed rate
[image:14.612.194.418.242.347.2]AUTHORS PROFILE
1. Er.N. Balasubramanyam1 M.Tech.
Assistant Professor,
Dept of Mechanical Engineering,
Sreenivasa Institute of Technology and Management Studies (Autonomous), Chittoor-517127, A.P, India.
2. Er.P.Gnana Prakash2 M.Tech.
Assistant Professor
Dept of Mechanical Engineering,
Sreenivasa Institute of Technology and Management Studies (Autonomous), Chittoor-517127, A.P, India.
3. Dr.V. Palvannan3M.E., Ph .D
Professor
Dept of Mechanical Engineering,
Sreenivasa Institute of Technology and Management Studies (Autonomous), Chittoor-517127, A.P, India.
4. Er.M.Yugandhar4 M.Tech,
Assistant Professor
Dept of Mechanical Engineering,