International Journal of Emerging Technology and Advanced Engineering
Website: www.ijetae.com (ISSN 2250-2459,ISO 9001:2008 Certified Journal, Volume 4, Issue 1, January 2014)
66
Evaluation of Urban Sprawl and Land use Land cover Change
using Remote Sensing and GIS Techniques: A Case Study of
Jaipur City, India
Sunil Sankhala
1, B. K. Singh
21Research Scholar, Dept. of Remote Sensing, Birla Institute of Technology, Mesra, Ranchi, 835215, India 2
Sr. Scientific officer, Dept. of Remote Sensing , Birla Institute of Technology, Extension Centre , 27, Malviya Industrial Area, Jaipur, 302017 , India.
Abstract—Urban sprawl is a worldwide phenomenon but the rate of urbanization is very fast in developing country like India. It is mainly driven by unorganized growth, increased
immigration, rapidly increasing population. The
implementation of capitalistic economy has resulted in the internal reformation of agricultural land use from crop production to industries and commercial avenues. Urban expansion and pattern could be depicted by spatial and temporal remote sensing satellite data. In the present study, an attempt has been made to investigate the effect of Urban Sprawl on Land use / Land cover change of the year 1995, 2000, 2006 and 2010 for Jaipur city, one of the planned cities in India. The task comprises of steps: delineation of urban area for consecutive years, comparison between urban areas, identification of the urban sprawl pattern, recognition of magnitude and direction of changing sprawl and its effect on land use / land cover. The pattern of urban sprawl is identified using Remote Sensing technique. The investigation resembles noteworthy change in the spatio-temporal urban sprawl pattern, direction, magnitude and effects on Land use/ Land cover.
Keywords— GIS, LU/LC change, Remote Sensing, Urban Sprawl
I. INTRODUCTION
In India, with an unparalleled population growth and migration, an increased urban population and urbanization is involuntary. More and more towns and cities are affluent with a change in the land use along the highways and in the instantaneous vicinity of the city. Sprawl generally deduces to some type of expansion with brunt such as loss of agricultural land, open space, and ecologically insightful habitats. Also, sometimes sprawl is liken with growth of town or city.
As population increases in an area or a city, the boundary of the city expands to accommodate the growth; this expansion is deemed as sprawl. The study on urban sprawl (The Regionalist, 1997; Sierra Club, 1998) is attempted in the developed countries (Batty et al., 1999; Torrens and Alberti, 2000; Barnes et al., 2001, Hurd et al., 2001; Epstein et al., 2002) and recently in developing countries such as China (Yeh and Li, 2001; Cheng and Masser, 2003) and India (Jothimani, 1997; Lata et al., 2001; Sudhira et al., 2003).
Primary causes of urbanization are population eruption, migration from other places, industries, economy and proximity to resources and basic amenities. The built-up is generally considered as the parameter for quantifying urban sprawl (Torrens and Alberti, 2000; Barnes et al., 2001; Epstein et al., 2002). The exceptional growth of many urban agglomerations in many developing countries is the result of a threefold structural change process: the transition away from agricultural employment, high overall population growth, and increasing urbanization rates (Grumbler, 1994).
The present study is to produce a land use/ land cover map of Jaipur City at different year in order to find the changes that have taken palace particularly in the built -up land and subsequently to analyze the urban sprawl of the different time period.
II. STUDY AREA
International Journal of Emerging Technology and Advanced Engineering
Website: www.ijetae.com (ISSN 2250-2459,ISO 9001:2008 Certified Journal, Volume 3, Issue 12, December 2013)
67 The city is a part of Jaipur district situated in north eastern part of Rajasthan which is surrounded by the districts of Alwar in the north, Sikar in the north - west and Bharatpur and Dausa in the east. Ajmer, Sikar, Alwar, kotputli, Bandikui and Tonk cities around Jaipur have a role to play in the development process of Jaipur in the regional setting. Immediate influence zone of Jaipur city extends to cities and towns of Dausa, Lalsot, Niwai, Phagi, Dudu, Phulera, Renwal, Reengus and Shahpura. The study area is shown in (Figure 1.).
Data Sources and Software used:
The multispectral IRS – LISS III satellite imagery procured from National Remote Sensing Centre (NRSC), Hyderabad, India, have been used for the analysis. Geo-registered LISS III data obtained from NRSA (bands 2, 3 and 4 corresponding to G, R, and MIR) were geo-corrected using resampling techniques. This is done with the help of known points on the Survey of India toposheets or / and ground control points (GCPs) using GPS. The basic Remote Sensing Techniques followed are the Image pre-processing, processing and Interpretation and analysis using the software’s like ERDAS IMAGINE 9.2 Version, Arc GIS 9.2 Version, and Arc view 3.2 Version and so on. Various thematic layers were also generated in GIS environment using satellite data.
Finally all the data are integrated in the GIS software to generate the different series of maps and charts to understand the different parameters of urbanization of the Jaipur city and different other physical and cultural phenomenon. Following data sources have been used in present study:
Satellite Data:
I. IRS LISS II (1995); II. IRS LISS III (2000, 2006); III. LANDSAT TM (2010);
SoI toposheet No.
54A/4, 54B/1, 45N/5, 45M/12, 45M/16, 45N/13, 45N/9, 45N/10, 45N/14 of Jaipur district and adjoining (Survey of India).
III. METHODS
The present work involved in utilization of Remote Sensing data of the Jaipur city area for deriving spatio-temporal information on the urban land use. This allowed
generation of information on important physical
environmental parameters of urbanization including city infrastructural details. The study of urban sprawl in a region followed by the analysis of urban land use change and its impact on environment requires an integration of a number of processes which are discussed below.
IRS LISS-II (1995), LISS-III (2000, 2006) and LANDSAT TM (2010) satellite images have been used for generation of land use/ land cover map. The satellite data was enhanced before classification using histogram equalization in ERDAS Imagine 9.2 for the better quality of the image and to achieve better classification accuracy. Further both satellite data were rectified to a common Universal Traverse Mercator (UTM) projection/coordinate system on 1:50,000 scale. The data was resampled to a
common spatial resolution of 23.5 m. Then
International Journal of Emerging Technology and Advanced Engineering
Website: www.ijetae.com (ISSN 2250-2459,ISO 9001:2008 Certified Journal, Volume 3, Issue 12, December 2013)
68 Also, urban area extent map and urban sprawl maps are generated and these data are combined with the outputs of the processed collateral data.
IV. RESULTS AND DISCUSSION
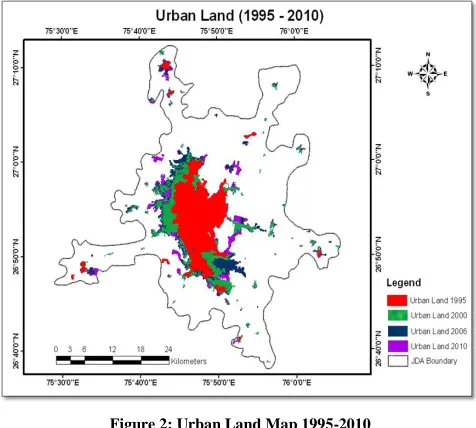
[image:3.612.333.556.219.366.2]The infiltration of population in large number owing to several thrust factors like infrastructural and institutional amenities, educational, health and recreational facilities, peaceful socio-economic condition and availability of better opportunities of livelihood, the city of Jaipur has also undergone changes in structure and spatial extent over the last two decades. In 1995, the total area (Urban) was 143.85 Sq.Km, which became 228.22 Sq.Km in 2000 .In 2006 the urban area has been 264.98 Sq.Km which finally increased to 278.28 Sq.Km in 2010 respectively. Now-a-days one can find a north-west and south-east growing city in comparison to the city area of 1995. With the gradual growth of the city towards the south-east and north-western fringes, the business area, parks and other recreational facilities along with other civil facilities have also ascertained changes.
Figure 2: Urban Land Map 1995-2010
It began to spread outside the main periphery of the urban centre, as for example Satellite town Chomu, Achrol.
[image:3.612.48.286.387.601.2]This outward growth of facilities is further acting as a pull factor for population migration attracts more people and ultimately the city keeps extending. Apart from this physical expansion, the city has also suffered changes in demographic and related economic profile. There has been concentration of more and more wealth in fewer hands and the poorer becomes poorer.
Figure 3: Showing the Extent of Land Use Change
Sprawl Pattern Identification
The sprawl location maps generated from the interpretation of satellite imagery reveals, as like any other prosperous popular city of India, Jaipur is also under the grip of sprawling. A careful analysis of these sprawls provides us with information regarding the growth
dynamics of these new urban agglomerations. In terms of
International Journal of Emerging Technology and Advanced Engineering
Website: www.ijetae.com (ISSN 2250-2459,ISO 9001:2008 Certified Journal, Volume 3, Issue 12, December 2013)
[image:4.612.325.562.133.335.2]69
Figure 4: Map Showing Linear Urban Sprawl Pattern
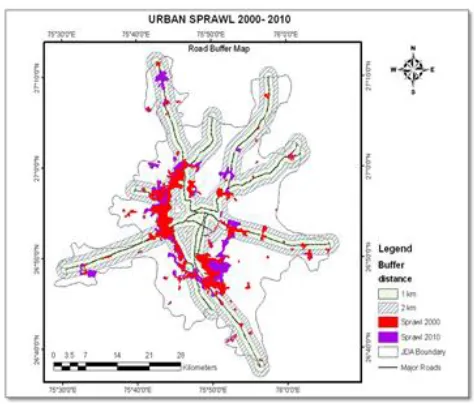
The new settlement agglomerations in Jaipur that have developed between 2000-2010 show that of them grew within a buffer area of two kilometers from the main transport lines(Figure 6). One of the reasons behind such growth may be settlements settling on consideration of good transport network. And it is some extent true. The different road projects undertaken by govt. of India and Rajasthan Govt., in the study area has reduced the problem of transportation from rural to urban to a great extent.
[image:4.612.52.288.142.341.2]Figure 5: Map Showing Leapfrog Urban Sprawl Pattern
Figure 6: Map Showing Urban Sprawl is Increase within Buffer Zone
[image:4.612.51.284.465.663.2]International Journal of Emerging Technology and Advanced Engineering
Website: www.ijetae.com (ISSN 2250-2459,ISO 9001:2008 Certified Journal, Volume 3, Issue 12, December 2013)
[image:5.612.56.562.142.529.2]70
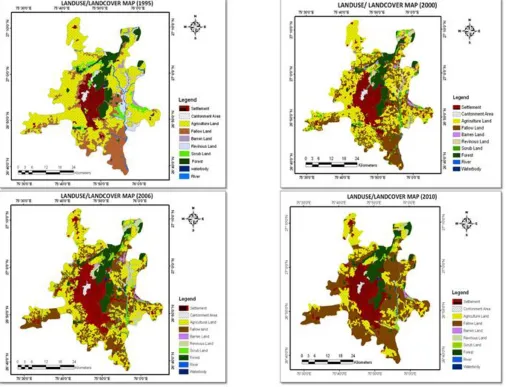
Figure 7: Landuse / Land cover Maps (1995-2010)
Landuse/ Landcover Assessment
The study of the land use land cover would enable us to understand the city as envisaged in the past and the direction of its future growth and development. This section explores the changing pattern of land use land cover over time. A change in land use land cover is inevitable over time. It reflects the needs and demands of the residents of the city. The land use land cover in 1995 has been compared with the existing land use land cover in 2000, 2006, and 2010 in the subsequent paragraph. There is a very sharp change in the proportion of some of the land uses from 1995 to 2010(Figure 7).
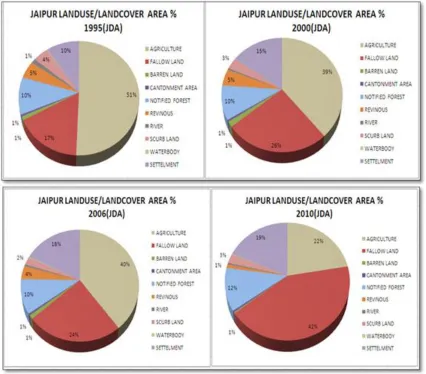
In 1995, following observations are made, 39% of the total study area was agricultural land which has decreased 12% as a result fallow land was increased by 9% of the total area. Areal extent of built up land increased 15% which clearly indicates the development of the city during this period. During 2006 the built up land has grown from 15% to 18% registering an increase of 3% area of built up land. During this period agricultural land and fallow land slightly changed. This shows that the city is in growing stage.
International Journal of Emerging Technology and Advanced Engineering
Website: www.ijetae.com (ISSN 2250-2459,ISO 9001:2008 Certified Journal, Volume 3, Issue 12, December 2013)
[image:6.612.95.521.140.514.2]71
Figure 8: Land use Change (1995-2010
V. CONCLUSION
With the population of India increasing as ever, the pressures on land and resources are also increasing. The urban sprawl is seen as one of the potential threats to sustainable development where urban planning with
effective resource utilization and allocation of
infrastructure initiatives are key concerns. The study attempts to identify such sprawls change for 1995-2010. The study was carried out, Jaipur (Jaipur Development Authority) Rajasthan, India using the techniques of GIS and remote sensing to identify and detect the urban sprawl. The spatial data along with the attribute data of the region aided to analyze remotely sensed and statistically.
This research conceptualized urban sprawl from a geographic perspective in order to assess the spatial distribution of Sprawl patterns and LULC change. The Research shows that Jaipur City has expanded towards south and western directions in uncontrolled manner, engulfing used productive cropped areas.
Sprawl may be found impact to the city and its surrounding environment in the following way:-
I. Slums and associated health hazards
II. Traffic congestion, pollution and health hazards III. Reduced social interactions due to low-density
International Journal of Emerging Technology and Advanced Engineering
Website: www.ijetae.com (ISSN 2250-2459,ISO 9001:2008 Certified Journal, Volume 3, Issue 12, December 2013)
72 Acknowledgement
The authors are very grateful to Dept. of Remote Sensing, BIT Mesra, Ranchi and National Remote Sensing Centre (NRSC), Hyderabad for organizational support and providing satellite data.
REFERENCES
[1] Agarwal P.,GIS in cultural resource management in historical urban centres. GIS development, Vol. 4(11): 2000 pp. 34.
[2] Alberti M., Booth D., Hill K., Marzluff J., ―The impact of urban patterns on ecosystem dynamics‖. Urban Research Initiative, National Science Foundation (NSF) PROPOSAL 1999-2002. University of Washington, Seattle.
[3] Allen, J., Lu, K..‖ Modeling and Prediction of Future Urban Growth in the Charleston Region of South Carolina: a GIS-based Integrated Approach‖. Conservation Ecology 8 (2): 2003, 2.
[4] Barnes K.B., Mrogan III, J.M., Roberge, M.C., Lowe, S., 2001. Sprawl Devlopment: Its Patterns, Consequences, and Measurement. Towson University, Towson.
[5] Batty M., Xie Y., and Sun Z., The dynamics of urban sprawl. Working Paper Series, Paper 15, Centre for Advanced Spatial Analysis, University College London, 1999.
[6] Cheng, J. and Masser, I.,. Urban growth pattern modeling: a case study of Wuhan city, PR China. Landscape and Urban Planning, 62, 2003 pp. 199 - 217.
[7] Civco, D. L., Hurd, J. D., Wilson, E. H., Arnold, C. L., and Prisloe, M., Quantifying and describing Urbanising Landscapes in the Northeast United States. Photogrammetric Engineering and Remote Sensing, Vol. 68(10), 2002.pp. 1083 - 1090.
[8] Douglas I. Human Settlements. In: William B. Meyer and B.L. Turner II (Editors), Changes in Land,Use and Land Cover: A Global Perspective. Cambridge University Press, Cambridge, U.K. 1994. [9] Epstein, J., Payne, K., Kramer, E., 2002. Techniques for mapping
suburban sprawl. Photogrammetr. Eng. Remote Sens. 63 (9), 913-918.
[10] Esnard, Margaret-Ann., Yang, Yizhao Descriptive and Comparative Studies of Urban Extent Data for the New York Metropolitan Region. Urban and Regional Information Systems Association 14 (1): 2002. 57-62.
[11] Gupta R. Study of Population Change and Urban Land Use relationship using an Integrated Remote Sensing and GIS Approach, The Deccan Geographer, Vol.44, (2006). pp.1-12.
[12] Gupta R., Sen. A (2008). Monitoring physical growth of Ranchi city by using geo-Informatics Techniques, ITPI journal, 5: 4 (2008) 38 – 48.
[13] Grumbler A., Technology. In: William B. Meyer and B.L. Turner II (Editors), Changes in Land Use and Land Cover: A Global Perspective. Cambridge University Press, Cambridge, U.K. 1994. [14] JDA, Master Development Plan – 2011.
[15] Jothimani, P. Operational urban sprawl monitoring using satellite remote sensing: excerpts from the studies of Ahmedabad, Vadodara and Surat, India. Paper presented at 18th Asian Conference on Remote Sensing held during October 20-24, 1997, Malasiya. [16] Lata K. M., Sankar Rao C. H., Krishna Prasad V., Badrinath K. V.
S., Raghavaswamy, ―Measuring urban sprawl: a case study of Hyderabad‖, GIS development, Vol. 5(12). 2001.
[17] Misra, B.D.: Population, eco-system and the environment: an Indian scenario. Demographic India, 19(1): (1990).59-66.
[18] Sierra Club, 1998. The Dark Side of the American Dream: The Costs and Consequences of Suburban Sprawl.
[19] Subudhi, A.P.: ―Raster based database design and analysis for urban and regional resource mapping‖. In: Remote Sensing and GIS Application in Urban and Regional Studies. B.S. Subudhi, B.S. Sokhi and P.S. Roy (Eds). HUSAG, IIRS, GOI, Dehradun (2001). pp. 58-69.
[20] Sudhira, H. S., Ramachandra, T. V., and Jagadish, K. S., 2003. Urban sprawl pattern recognition and modeling using GIS. Paper presented at Map India - 2003, New Delhi. January 28 - 31, 2003. [21] The Regionalist, 1997. Debate on Theories of David Rusk, Vol. 2,
no. 3.
[22] Torrens, P.M., Alberti, M., 2000. Measuring sprawl. Working paper no. 27, Centre for Advanced Spatial Analysis, University College, London.