International Journal of Emerging Technology and Advanced Engineering
Website: www.ijetae.com (ISSN 2250-2459,ISO 9001:2008 Certified Journal, Volume 5, Issue 5, May 2015)
465
Comparative Study of Wind Load Analysis of Buildings of
Various Shapes and Sizes as per IS: 875 (Part 3) and ASCE 7-02
Lodhi Saad
1, S. S. Jamkar
2 1PG Student, 2Assistant Professor, Aurangabad, India
Abstract— Wind load is one of the important load influencing the design of a building structure. For the analysis of a building considering the effect of wind load, it is necessary to calculate the wind speed and pressure for different height of building and for different geometry. Various major standards and codes gives us the procedures and coefficients required for calculation of wind load for particular parameters, like for importance of building, surrounding terrain, topography of building size, pressure and force coefficients for different geometric shapes and sizes of buildings. This paper presents the comparative study of effect of wind loading on various sizes and shapes of building as per IS 875 (part 3) and ASCE 7-02. The wind load was analytically determined and numerical model of 9 different structures ware created in Staad Pro v8i. The influence of the wind load response in terms of peak deflections, inter story drift is calculated and compared.
Keywords— Wind loading, pressure coefficient, Story Drift, building height ratio and building plan ratio, IS: 875-3, ASCE 7-02.
I. INTRODUCTION
Expansion of construction industry at international level, increasing demand of high rise buildings, and the recent focus on the development of unified international codes/standards has increased the need to better understand the common points and differences among the major international wind loading codes/standards, which are also constantly being revised and updated time to time. To address this need, a comprehensive comparison of wind loads and their effects on various geometric sizes and shapes of buildings is conducted utilizing two major international codes/standards: ASCE 7-02. 2010 (USA) and IS: 875 (part 3) - 1987 (INDIA). Over the past few years the behavior and characteristics of the atmospheric wind in the lower layers of the atmosphere have become increasingly important in relation to design requirements over a broad range of engineering problems. Therefore a comparative study of wind loading codes is done.
II. WIND LOAD PHENOMENON
The force on a structure arising from the impact of wind on it.
As the wind movements are horizontal, it creates lateral load on buildings. Wind load in the direction of flow of wind on a building is not constant throughout the height of building, it increases with height of building because the velocity of wind varies with height as the obstructions on the ground reduces its speed due to friction. So accordingly one should care about the wind forces acting horizontally on different height of story while analyzing a building.
III. WIND PRESSURE ON BUILDING
The pressure exerted by wind at a point on the structure will be different from the pressure of wind far upstream of the structure, called ‘free stream static pressure’. The ratio of the difference of the pressure at a point on the structure and static pressure of the incident wind to the design wind pressure is termed as Pressure Coefficient. The Pressure Coefficient is a function of building shape and location, and whether the wind load induces inward or outward pressures.
Pressure coefficient is given in two parts. The first part is on the Primary Frames Systems, it is for the design of the entire building. The second part, Elements and Components of Structure, is for the design of cladding. The pressure coefficients are always given for a particular surface or part of the surface of a building. The average values of these pressure coefficients for some building shapes are given in standards/codes.
IV. PRESSURE COEFFICIENT
The pressure coefficients are always given for a particular surface or part of the surface of a building. The wind load acting normal to a surface is obtained by multiplying the area of that surface or its appropriate portion by the pressure coefficient (Cp) and the design wind pressure at the height of the surface from the ground.
International Journal of Emerging Technology and Advanced Engineering
Website: www.ijetae.com (ISSN 2250-2459,ISO 9001:2008 Certified Journal, Volume 5, Issue 5, May 2015)
466
Where considerable variation of pressure occurs over a surface, it has been subdivided and mean pressure coefficients given for each of its several parts.
In addition, areas of high local suction (negative pressure concentration) frequently occurring near the edges of walls and roofs are separately given in codes. Coefficients for the local effects should only be used for calculation of forces on these local areas affecting roof sheeting, glass panels, and individual cladding units including their fixtures. They should not be used for calculating force on entire structural elements such as roof, walls or structure as a whole.
The coefficients given in different tables have been obtained mainly from measurements on models in wind- tunnels, and the great majority of data available has been obtained in conditions of relatively smooth flow. Where sufficient field data exists as in the case of rectangular buildings, values have been obtained to allow for turbulent flow.
A. External pressure coefficient
The External pressure coefficient depends on wind direction, structure configuration in plan, and its height versus width ratio and, characteristics of roof and its shape.
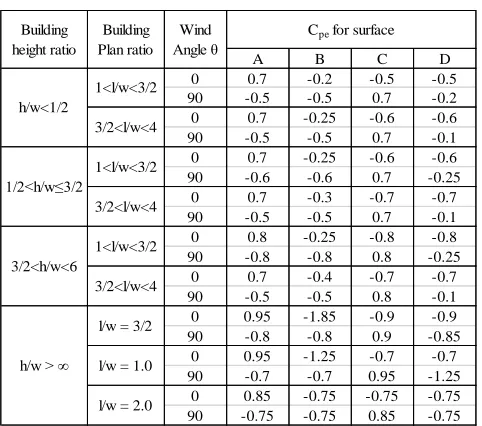
[image:2.612.323.559.144.391.2]As we are studying comparative study of analysis of building of various shapes and sizes under wind as per IS: 875-part 3 and ASCE 7-02, external pressure coefficient is the main point on which the variation in wind load occurs. These coefficients for rectangular clad buildings in IS: 875 (part 3) are given as below in table 1.
TABLE 1
EXTERNAL PRESSURE COEFFICIENT GIVEN IN IS:875-3
A B C D
0 0.7 -0.2 -0.5 -0.5
90 -0.5 -0.5 0.7 -0.2
0 0.7 -0.25 -0.6 -0.6
90 -0.5 -0.5 0.7 -0.1
0 0.7 -0.25 -0.6 -0.6
90 -0.6 -0.6 0.7 -0.25
0 0.7 -0.3 -0.7 -0.7
90 -0.5 -0.5 0.7 -0.1
0 0.8 -0.25 -0.8 -0.8
90 -0.8 -0.8 0.8 -0.25
0 0.7 -0.4 -0.7 -0.7
90 -0.5 -0.5 0.8 -0.1
0 0.95 -1.85 -0.9 -0.9
90 -0.8 -0.8 0.9 -0.85
0 0.95 -1.25 -0.7 -0.7
90 -0.7 -0.7 0.95 -1.25
0 0.85 -0.75 -0.75 -0.75
90 -0.75 -0.75 0.85 -0.75
Building height ratio
Wind Angle θ
h/w > ∞
l/w = 3/2
l/w = 1.0
l/w = 2.0 1/2<h/w≤3/2 1<l/w<3/2 3/2<l/w<4 3/2<h/w<6 1<l/w<3/2 3/2<l/w<4 Building Plan ratio
Cpe for surface
h/w<1/2
1<l/w<3/2
3/2<l/w<4
ELEVATION PLAN
Where,
In Elevation,
h = Height to caves or parapet,
w = lesser horizontal dimension of a building, In plan,
l = Greater horizontal dimension of a building, A, B, C and D = Four sides of building, θ = Angle of attack.
And, external pressure coefficients for rectangular clad building given in ASCE 7-02 are as below in table 2,
TABLE2
EXTERNAL PRESSURE COEFFICIENT GIVEN IN ASCE7-02
Surface L/B Cp
Windward
Wall All values 0.8
0-1 -0.5
2 -0.3
4 -0.2
Side Wall All values -0.7
Leeward Wall
Where,
B = Horizontal dimension of building, in feet (meter), measured normal to wind direction,
L = Horizontal dimension of building, in feet (meter), measured parallel to wind direction,
Cp = External pressure coefficient.
B. Internal pressure coefficient
[image:2.612.49.290.503.716.2]International Journal of Emerging Technology and Advanced Engineering
Website: www.ijetae.com (ISSN 2250-2459,ISO 9001:2008 Certified Journal, Volume 5, Issue 5, May 2015)
467
The Codes indicates Cpi for a range of values with a possible maximum (that is positive pressure) and a possible minimum (that is negative pressure) with the provision that both the extreme values would have to be examined to evaluate critical loading on the concerned member. Three cases have been specifically indicated for arriving at Cpi:
Openings up to 5 percent of wall area,
Openings from 5 percent to 20 percent of wall area, and
Openings larger than 20 percent of wall area (including buildings with one side open).
In IS: 875 -3: The internal pressures given in IS: 875 have been deliberately specified slightly higher (negatively) than the codes of temperate countries to reflect the fact that as a tropical country, the size of windows/doors are larger in India and the normal tendency is to keep them open as much as possible
V. USED METHODOLOGY
linear and static analysis of 18 models (9 pairs) are done using Staad Pro software for same wind speed 55 m/s (124 mph), terrain category 2 and plan topography with no upwind slope i.e. slope less than 3°. Size and shapes of structure are different for 9 pairs of structure were taken according to building height ratio and building plan ratios as per given in IS: 875 (part 3) (table 4) for external pressure coefficients (Cpe) for walls of rectangular clad buildings. Among each pair, one model is analyzed considering pressure coefficient according to IS: 875 (part 3) and another model is analyzed considering pressure coefficient according to ASCE 7-02. All 18 structures are rectangular clad building with flat roof.
A. Details of models
Nine pairs of structures are modeled in Staad Pro, their building dimensions, with respect to the plan and height ratio as per given in the IS: 875 (part 3), column and beam sizes are tabulated below, slab thickness for all models was taken as 150 mm. Dead loads were taken as self-weight of structural elements. Live load was taken as 3 kN/m2, as it is considered as commercial buildings.
1 1< l/w < 3/2 6 7.5 3 230x300 230x300
2 3/2 < l/w < 4 10.6 29.15 3 230x380 230x380
3 1 < l/w < 3/2 6 7.5 6 230x450 230x450
4 3/2 < l/w < 4 6 16.5 6 230x450 230x450
5 1 < l/w < 3/2 8 10 30 300x600 230x450
6 3/2 < l/w < 4 8 22 30 450x650 300x450
7 l/w = 3/2 12 18 60 450x650 300x450
8 l/w = 1.0 12 12 60 600x600 300x450
9 l/w = 2.0 12 24 60 450x650 300x450
h/w > ∞ 3/2 < h/w < 6 1/2 < h/w ≤ 3/2
h/w < 1/2
Building Plan ratio Building
height ratio
Model No.
width (m)
length (m)
size of columns
(mm) size of beams (mm)
height (m)
VI. ANALYTICAL RESULTS
Relative displacements of points at each adjacent floor due to wind load calculated by IS: 875 (part 3) and by ASCE 7-02 in X-direction and in Z-direction are given below in graphs, Y axis direction is considered as vertical axis, X and Y are horizontal axis. All displacements are in mm. Graphs are plotted between stories and their relative displacements. Along X axis displacements of stories is plotted whereas along Y axis height of building or stories are plotted. Following are the nine pairs of graphs given,
International Journal of Emerging Technology and Advanced Engineering
Website: www.ijetae.com (ISSN 2250-2459,ISO 9001:2008 Certified Journal, Volume 5, Issue 5, May 2015)
468
For model pair 2.
For model pair 3.
For model pair 4.
International Journal of Emerging Technology and Advanced Engineering
Website: www.ijetae.com (ISSN 2250-2459,ISO 9001:2008 Certified Journal, Volume 5, Issue 5, May 2015)
469
For model pair 6.
For model pair 7.
International Journal of Emerging Technology and Advanced Engineering
Website: www.ijetae.com (ISSN 2250-2459,ISO 9001:2008 Certified Journal, Volume 5, Issue 5, May 2015)
470
For model pair 9.
VII. CONCLUSIONS
In present study pair of nine R.C.C symmetric building was analyzed for wind load calculated from IS: 875 (part 3) and ASCE 7-02 and non-linear static analysis is carried out on Finite element software Staad Pro. After analysis of buildings subjected to wind load, following conclusions were drawn.
1) In case of pairs of model 1 to 4 in both x and y direction displacements are more when calculated by ASCE 7-02 compared to IS: 875 (part 3).
2) When pairs of models 5 and 6 are analyzed and compared, it shows the displacements are more in x direction according to ASCE 7-02 and displacement is more in z direction according to IS: 875 (part 3).
3) High rise buildings such as given in pairs of model 7, 8 and 9 shows that in both x and y directions displacements are more when calculated by IS: 875 (part 3) in compared with ASCE 7-02.
4) It is also observed that when plan ratio of building is more (like 3/2 < l/w < 4) displacements in X direction is slightly higher when calculated according to IS: 875 (part 3) in comparison with ASCE 7-02 for same plan ratio for displacement in Y direction.
5) Therefor it can be concluded that for the design of low height and medium height (up to 10 stories) buildings it will be more economical to design using the coefficients given in IS: 875 (part 3) and designing high rise buildings (more than 10 stories) it is safer to design with coefficients given in IS: 875 (part 3).
REFERENCES
[1] Indian Standard Code of Practice for Design Loads (Other than Earthquake) For Buildings and Structures (Part 3 – Wind Loads) (1987)
[2] Explanatory handbook on Indian Standard Code of Practice for Design Loads (Other than Earthquake) For Buildings and Structures (Part 3 – Wind Loads).
[3] American Society of Civil Engineers SEI/ASCE 7-02 Second Edition Minimum Design Loads for Buildings and Other Structures Revision of ASCE 7-98 Longinow A, and Mniszewski KR. Protecting buildings against vehicle bomb attacks, Practice Periodical on Structural Design and Construction, ASCE, New York, pp. 51-54, 1996
[4] Dae Kun Kwon, Ahsan Kareem, 2013. Comparative Study of Major International Wind Codes and Standards for Wind Effects on Tall Buildings. University of Notre Dame.
[5] Weerasuriya A.U., Lewangamage C.S., Jayasinghe M.T.R. 2008. Comparison of Five Major Wind Codes with Sri Lankan Context. University of Moratuwa.
[6] M. A. Saleem and M. M. Saleem. 2012.Pakistan Journal of Science, Comparison of American and Canadian Practices for Wind Load Calculations. University of Engineering and Technology Lahore. [7] Yukio Tamura, John D. Holmes, Prem Krishna, Lu Guo, Akira
Katsumura, The Seventh Asia-Pacific Conference on Wind Engineering, November 8-12, 2009, Comparison of Wind Loads on Medium-Rise Building according To Asia-Pacific Codes/Standards Taipei, Taiwan.