Neuroscience Institute Dissertations Neuroscience Institute
8-13-2019
Identifying the Role of Vasopressin and Oxytocin
in the Microbiota-Gut-Brain-Behavior Axis
Nicole Peters
Follow this and additional works at:https://scholarworks.gsu.edu/neurosci_diss
This Dissertation is brought to you for free and open access by the Neuroscience Institute at ScholarWorks @ Georgia State University. It has been accepted for inclusion in Neuroscience Institute Dissertations by an authorized administrator of ScholarWorks @ Georgia State University. For more information, please [email protected].
Recommended Citation
Peters, Nicole, "Identifying the Role of Vasopressin and Oxytocin in the Microbiota-Gut-Brain-Behavior Axis." Dissertation, Georgia State University, 2019.
MICROBIOTA-GUT-BRAIN-BEHAVIOR AXIS
by
NICOLE PETERS
Under the Direction of Geert de Vries, PhD
ABSTRACT
The gut microbiota is a complex ecosystem of microorganisms that form a
bidirectional communication pathway with the brain, called the gut-brain axis. In
addition to their roles in mediating host metabolism and digestion, a wealth of research
is identifying roles for the gut microbiota in neural development and function, immune
modulation, and behavioral expression. Many neural targets of gut-brain axis signaling
have been identified, but little attention has been paid to vasopressin and oxytocin.
Vasopressin and oxytocin are neuropeptides that are targets of immune signaling and
are implicated in the control of anxiety-like, depressive-like, and social behaviors,
vasopressin and oxytocin would be affected through immune system activation to result
in behavioral alterations seen in microbiota dysbiosis. To test these predictions, we
used pro-inflammatory and anti-inflammatory microbiota manipulation mouse models to
identify the roles of vasopressin and oxytocin in the gut-brain axis. First, we
demonstrated that microbiota is needed for proper vasopressin and oxytocin system
development by using a germ-free mouse model. Second, we explored the impacts that
chronic intestinal inflammation has on behavior and neuropeptide expression in Toll-like
receptor 5 knockout (T5KO) mice. Third, we investigated whether the behavioral
phenotype in T5KO mice is microbiota dependent. Collectively, these experiments
provide support to the hypothesis that microbiota alter the vasopressin and oxytocin
systems through an immune-mediated pathway to alter the behavior of both mouse
models. They also support the use of T5KO mice in investigating the interplay between
chronic, low-grade inflammation and psychiatric disorders. Future experiments are
needed to uncover the exact mechanisms underlying the microbiota-gut-brain-behavior
axis and understanding this axis will provide a basis for developing microbiota-based
therapeutics to treat CNS disorders.
MICROBIOTA-GUT-BRAIN-BEHAVIOR AXIS
by
NICOLE PETERS
A Dissertation Submitted in Partial Fulfillment of the Requirements for the Degree of
Doctor of Philosophy
in the College of Arts and Sciences
Georgia State University
Copyright by Nicole Victoria Peters
MICROBIOTA-GUT-BRAIN-BEHAVIOR AXIS
by
NICOLE PETERS
Committee Chair: Geert de Vries
Committee: Nancy Forger
Aras Petrulis
Andrew Gewirtz
Electronic Version Approved:
Office of Graduate Studies
College of Arts and Sciences
Georgia State University
DEDICATION
To my grandfather, Daniel Krzesinski, and my mother, Victoria Peters, for
ACKNOWLEDGEMENTS
First of all, I would like to thank my mentor Dr. Geert de Vries. Without you, none
of this would have been possible. Your enthusiasm for science and learning is
infectious and inspired me daily, and your ability to see how techniques from other fields
can be used to answer neuroscience questions has made me a better scientist. You
have taught me to look at writing in a different way, and I’ve started to not (completely)
hate it.
I would like to acknowledge the considerable contributions that my committee
has made throughout the development of this thesis and my scientific career. Thank
you to Dr. Nancy Forger, who has been invaluable in helping me to develop my writing
and experimental design skills and has always been a sounding board for any questions
I have had along the way. She also serves as a model for a successful woman in
science, somehow balancing a thriving, funded lab with running our department, as well
as being an excellent teacher and maintaining a personal and family life. I would like to
thank Dr. Aras Petrulis for providing me with a chance to rotate in his lab, where I
learned the proper way to do surgery on rodents, for always being available for me to
ask questions and to critique my behavioral testing methods and conclusions, and for
running our DnD game. Finally, thank you to Dr. Andrew Gewirtz for all of your help in
developing the research questions presented in this thesis, for providing animals,
personnel, and lab equipment for me to do this research, and for your prompt feedback
on posters, abstracts and papers.
I cannot begin to thank everyone else who has helped me develop as a scientist
Dr. Mary Holder, and Dr. Benoit Chassaing. Each of you were there to teach me new
techniques, answer panicked questions at all hours of the day, and provided emotional
support for when graduate school became difficult. Thank you, Matt, for being there
every time I have needed you, for teaching me how design and run experiments, for
making me into a meticulous scientist, and for using that sweet post doc money to buy
us appetizers. Thank you, Mary, for providing a new insight into how the academic and
research worlds work, for taking the time to help me consolidate my thoughts when
anxiety brain got in the way, and for reading pretty much everything I have written in
grad school. Thank you, Benoit, for doing so much for my projects when you must have
had another 10 projects demanding your attention, for providing me with the skills and
knowledge to do microbiota experiments, and for being a friendly face after hours of
tissue collections.
Thank you to everyone else in the Neuroscience Institute faculty who has
provided academic, research, or emotional support throughout the years, including Dr.
Chuck Derby, Dr. Anne Murphy, Dr. Kyle Frantz, Dr. Elliott Albers, Dr. Laura Carruth,
Dr. Dan Cox, Dr. Angela Mabb, and Dr. Marise Parent. I would like to thank the staff of
the Neuroscience Institute for making sure everything was running smoothly with
everything, including Emily Hardy, Liz Weaver, Tenia Wright, Rob Poh, Ryan Sleeth,
Raquel Lowe, Anwar Lopez, and everyone else who has helped me out along the way.
None of this would have been possible without the help I received from DAR, including
Dr. Michael Hart and Dr. Amelia Wilkes, Dean Blake, Matthew Davis, Evan Hutto,
Michael Morrison, and Robert for providing extraordinary animal care and working with
Thank you to my lab mates and friends who have kept me sane. Jack, I don’t
know if I can ever repay you for all the help you’ve given me. I actually would not have
finished without you. Chris, thank you for all the feedback you’ve given throughout the
years. All the members of the Forger lab, including Alex Castillo-Ruiz, Carla Cisternas,
Laura Cortes, Morgan Mosley, Andrew Jacobs, Yarely Hoffiz, Alex Strahan, and Jill
Weathington. My sometimes coworkers and always friends, certainly not limited to
Marisa, John, Greg, Luis, Alisa, Arlene, Katie, Mihika, Niko, Kat, Johnny, Hillary, Evan,
Amin, and so many others that I have probably not expressed well enough how much
they matter.
Finally, but certainly not least, thank you to my established family and
newly-made family. My parents and brother have always been there to offer a shoulder for me
to cry on or to complain to, and they offer guidance and support whenever they can. To
Brenton, who has honestly run my life for the past 4 years, and without him I would be
even more of a disaster than I am. I love you and cannot thank you enough. To my
dogs for simultaneously stressing me out and making every day fun. You all have made
TABLE OF CONTENTS
ACKNOWLEDGEMENTS ... V
LIST OF TABLES ... XII
LIST OF FIGURES ... XIII
LIST OF ABBREVIATIONS ... XV
1 INTRODUCTION ... 1
1.1 Microbiota-Gut-Brain Axis ... 1
1.2 Microbiota and Neuropeptides ... 6
1.3 Summary of Chapters ... 8
2 MICROBIOTA ARE NECESSARY FOR PROPER NEURAL VASOPRESSIN AND OXYTOCIN DEVELOPMENT IN MICE ... 12
2.1 Abstract ... 12
2.2 Introduction ... 13
2.3 Materials and Methods ... 15
2.3.1. Animals ... 15
2.3.2. Behavioral Testing ... 16
2.3.3. Euthanasia and Tissue Collections ... 18
2.3.4. Immunohistochemistry ... 18
2.3.5. Image Analysis ... 20
2.4 Results ... 21
2.4.1. Animals ... 21
2.4.2. Adult Immunoreactivity ... 22
2.4.3 Weanling-Aged Immunoreactivity ... 26
2.4.4 Weanling-Aged Behavior and Body Measures ... 29
2.5 Discussion ... 31
2.6 Figures ... 40
3 KNOCKOUT OF TOLL-LIKE RECEPTOR 5 RESULTS IN AN ANXIOGENIC PHENOTYPE ASSOCIATED WITH CHANGES IN NEURAL VASOPRESSIN THROUGH A MICROBIOTA-INDEPENDENT PATHWAY ... 50
3.1 Abstract ... 50
3.2 Introduction ... 51
3.3 Materials and Methods ... 54
3.3.1. Experiment 1... 54
3.3.2. Experiment 2... 55
3.3.3. Descriptions of Behavioral Assays ... 57
3.3.4 Euthanasia and Tissue Collections ... 62
3.3.5. Immunohistochemistry ... 62
3.3.6. Colonic Myeloperoxidase Assay ... 63
3.3.8 Image Analysis ... 64
3.3.9. Statistical analyses ... 64
3.4 Results ... 65
3.4.1. Experiment 1: Behavioral and neural phenotyping of T5KO mice ... 65
3.4.2. Experiment 2: T5KO and WT microbiota transplantation to WT mice ... 72
3.5 Discussion ... 76
3.6 Figures ... 85
4 DISCUSSION ... 105
4.1 Vasopressin and Oxytocin in the Microbiota-Gut-Brain-Behavior Axis ... 105
4.2 Commentary on Behavioral Testing ... 109
4.3 Pathways of microbiota-gut-brain-behavior communication ... 111
4.3.1. Microbiota to gut signaling ... 111
4.3.2. Gut to brain signaling ... 113
4.3.3. Brain to Behavior Signaling ... 115
4.3.4. Proposed Pathway ... 116
4.4 Implications for Human Health ... 118
4.4.2 Dietary Considerations ... 121
4.5 Conclusions ... 122
REFERENCES ... 124
LIST OF TABLES
Table 3.1. Structure matrix for discriminant analysis of behavior. ... 93
Table 3.2. Structure matrix for discriminant analysis of neuropeptide expression.
... 94
Table 3.3 Behavioral Data for Microbiota-treated Mice ... 101
Table 3.4. Structure matrix for discriminant analysis of behavior in microbiota
treated mice. ... 103
LIST OF FIGURES
Figure 2.1. Recolonization with microbiota generally increases AVP
immunoreactivity in adult mice. ... 40
Figure 2.2. Microbiota alter adult OXT-ir in sex- and region-specific ways. ... 41
Figure 2.3. Recolonization does not rescue the reduced microglia expression in
GF mice. ... 42
Figure 2.4. Lack of a microbiota alters AVP-ir at weaning in a region-specific
manner. ... 43
Figure 2.5. Germ-free conditions in weanling-aged mice increase OXT-ir in some
brain regions in a similar pattern to adults. ... 44
Figure 2.6. Germ-free conditions reduce microglia expression in a brain
region-dependent manner. ... 45
Figure 2.7. Female GF mice spend less time interacting with a littermate than
female CC mice at weaning. ... 46
Figure 2.8. GF mice do not dig more in the marble burying test but spend more
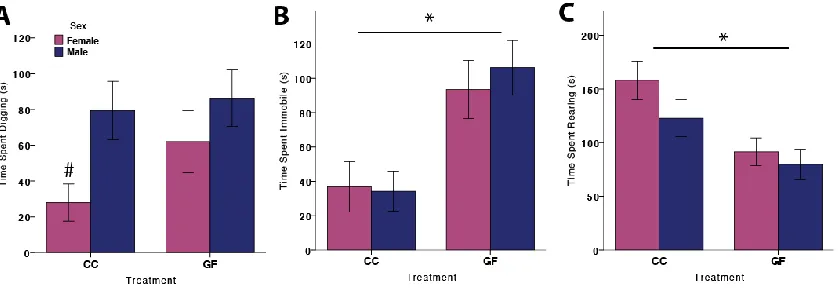
time immobile. ... 47
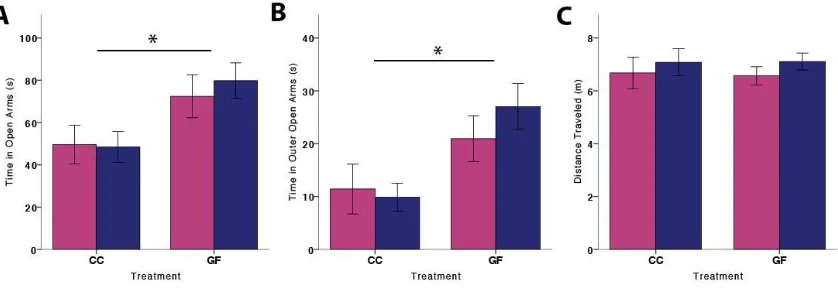
Figure 2.9. Weanling-aged GF mice show less anxiety-like behavior than CC mice.
... 48
Figure 2.10. Weanling-aged GF mice show adult-typical GF physiology. ... 49
Figure 3.1. T5KO mice replicate metabolic syndrome and low-grade inflammatory
phenotype. ... 85
Figure 3.3. T5KO mice show increased repetitive grooming in the marble burying
test. ... 87
Figure 3.4. T5KO mice are more social than WT mice when WT mice are used as a
stimulus. ... 88
Figure 3.5. T5KO increased AVP-ir in PVN and SCN projection sites. ... 90
Figure 3.6. T5KO has little effect on OXT-ir. ... 91
Figure 3.7. Multivariate test statistics reveal a separation of sex and genotype in
behavioral and neuropeptide expression in T5KO and WT mice. ... 92
Figure 3.8. T5KO-g is not sufficient to induce morphological T5KO phenotype in
juvenile (P29) mice. ... 95
Figure 3.9. T5KO-g has no effect on anxiety- and depressive-like behavior in
weanling-aged mice. ... 96
Figure 3.10. T5KO-g had no effect on weanling-aged social behavior. ... 97
Figure 3.11. T5KO microbiota is sufficient to produce the morphological
phenotype of T5KO in adult mice. ... 98
Figure 3.12. T5KO-g has a mild effect on adult anxiety-like and depressive-like
behavior. ... 99
Figure 3.13. T5KO-g had little effect on adult social behavior in the three-chamber
apparatus. ... 100
Figure 3.14. Discriminant analysis does not reveal a separation along sex or
microbiota treatment for behavioral characteristics of T5KO-g or WT-g
mice. ... 102
LIST OF ABBREVIATIONS
5-HT- 5-hydroxytryptamine
ABC- avidin-biotin complex
AH- anterior hypothalamus
ANOVA- analysis of variance
ASD- autism spectrum disorders
AVP- arginine vasopressin
BBB- blood-brain barrier
BDNF- Brain derived neurotrophic factor
BNST- bed nucleus of the stria terminalis
BNSTmv- medial ventral bed nucleus of the stria terminalis
CC- conventionally colonized
CEC- cerebral endothelial cells
CNS- central nervous system
CRF- corticotrophin-releasing factor
CVO- circumventricular organs
DAB- nickel-enhanced diaminobenzidine
DMH- dorsomedial nucleus of the hypothalamus
EEC- enteroendocrine cells
EPM- elevated plus maze
EZM- elevated zero maze
GABA- gamma-aminobutyric acid
HPA- hypothalamus-pituitary-adrenal axis
Iba-1- ionized calcium binding adapter molecule 1
ICV- intracerebroventricular
IEC- intestinal epithelial cells
IHC- immunohistochemistry
IL-1𝛽- interleukin-1𝛽
ir- immunoreactivity
L/D Box- light/dark box
Lcn-2- lipocalin-2
LHb- lateral habenula
LPS- lipopolysaccharide
LS- lateral septum
LSV- ventral lateral septum
MANOVA- multivariate analysis of variance
MD- mediodorsal nucleus of the thalamus
MHC- major histocompatibility complex
mRNA- messenger ribonucleic acid
NF-B- Nuclear Factor kappa-light-chain-enhancer of activated B cells
NGS- normal goat serum
OFT- open field test
OXT- oxytocin
PBS- phosphate-buffered saline
PVT- paraventricular nucleus of the thalamus
RE- recolonized
SCFA- short-chain fatty acids
SCN- suprachiasmatic nucleus
SEM- standard error of the mean
SON- supraoptic nucleus
SPZ- subparaventricular zone
T5KO- Toll-like receptor 5 knockout
T5KO-g- mice treated with Toll-like receptor 5 knockout microbiota
TBS- Tris-buffered saline
TCT- three chamber sociability test
TLR- Toll-like receptor
TLR4- Toll-like receptor 4
TLR5- Toll-like receptor 5
TNF-𝛼- tumor necrosis factor alpha
TST- tail suspension test
WT- Wild-type
1 INTRODUCTION
1.1 Microbiota-Gut-Brain Axis
Mammals and other animals are inhabited by millions of microorganisms on any
surface that is exposed to the outside environment, including the skin, mouth, gut, and
vaginal canal (Backhed et al., 2005). These microorganisms, called the microbiota,
consist of bacteria, fungi, parasites, and other microorganisms, and are estimated to
equal or outnumber by up to ten times the host’s cells (Sender et al., 2016). Bacteria
comprise by far the largest portion of the microbiota and typically form a symbiotic
relationship with the host (Chow et al., 2010). The microbiota is a complex ecosystem
and perturbations to the ecosystem can result in the proliferation of non-beneficial
species, leading to a state of dysbiosis (Rojo et al., 2017). While the definition of
dysbiosis is generally unclear (reviewed in Fields et al., 2018), one can consider it to be
a shift in the composition such that there is a pro-inflammatory effect on the
body. Dysbiosis has been shown to be a component of a number of disorders, such as
inflammatory bowel disease and psychiatric disorders (Carding et al., 2015).
While the microbiota is present throughout the body, the role of the gut
microbiota has been particularly well-studied with regards to its relation to human
health, as it plays roles in host digestion, metabolism, and even diet selection (Rezzi et
al., 2007; Ley et al., 2008; Alcock et al., 2014; Andoh, 2016; Gentile and Weir, 2018).
However, the gut microbiota has functions that extend past the intestines, achieved
through numerous communication pathways with the rest of the body. For example, the
microbiota can interact directly with the nervous system through activation of the vagus
microbiota can produce metabolic byproducts such as short-chain fatty acids that signal
the cells of the intestinal epithelium, or they can also produce neurotransmitters, such
as serotonin, that can communicate with the rest of the body (Aidy et al., 2015; Morrison
and Preston, 2016; Kennedy et al., 2017). Finally, they can directly influence the
immune system by stimulating immune cells to release pro- or anti-inflammatory
cytokines, either locally or systemically, or by recruiting and activating immune cells in
the gut or brain (Chassaing & Gewirtz, 2016; Fiebiger et al., 2016; Mcdermott &
Huffnagle, 2014). Signaling through this route is the main focus of investigation
throughout this dissertation.
Through these pathways, the gut microbiota can communicate with the brain to
change behavior, as evidenced by their role in psychiatric disorders. In fact, a wealth of
research has been performed in the past 15 years on the effects changing the
composition of the microbiota has on the brain and behavior. One of the primary
models used is germ-free (GF) mice. GF mice, raised in sterile isolators, have a
number of physiological and behavioral changes from conventionally colonized (CC)
mice. For example, they have ceca that are twice as large as normally colonized mice
due to their inability to adequately digest fiber (Wostmann and Bruckner-Kardoss, 1959;
Respondek et al., 2013). They also have decreased anxiety-like behavior, decreased
sociability, and cognitive impairments (Clarke et al., 2013; Desbonnet et al., 2014;
Neufeld et al., 2011). GF mice are a useful model for identifying neural systems
affected by the microbiota, due to the severity of a global knockout of microbiota
(Luczynski et al., 2016). Furthermore, GF mice are excellent for identifying critical
recolonize them at specific developmental time points. In fact, a number of studies
have used this manipulation to identify temporal effects of microbiota on brain
development and behavior (Diaz Heijtz et al., 2011; Erny et al., 2015; Lu et al., 2018;
Neufeld et al., 2011). In addition, GF mice are useful as an anti-inflammatory
physiological system, due to their immature immune systems and lack of immune
challenges from the environment (Abrams et al., 1963; Clarke et al., 2013). Despite the
fact that GF mice are not an ethologically relevant model, they are an excellent way to
identify neural systems affected by microbiota.
There are a number of models that use different manipulations to mimic intestinal
inflammation. One way that is used frequently in the literature is to administer
lipopolysaccharide (LPS), the component of the membrane of Gram-negative bacteria,
either intraperitoneally or by oral gavage to result in a proxy of bacterial infection (Fields
et al., 2018; Hug et al., 2018; Taylor et al., 2012). Another way is to increase the
inflammatory nature of the microbiota through introduction of pro-inflammatory bacterial
species, such as Campylobacter jejuni or Escheria coli (Chassaing et al., 2014; Lyte et
al., 1998). Alternatively, there are genetic manipulations that result in chronic,
low-grade intestinal inflammation. One such manipulation is the use of Toll-like receptor 5
knockouts.
Organisms use pattern recognition receptors to identify invading pathogens by
recognizing conserved bacterial, fungal, or viral components on the pathogens in the
body, and once activated, they begin a signaling cascade to promote an inflammatory
response to rid the body of the pathogen (Takeuchi and Akira, 2010). One such family
recognize a different component (Rakoff-Nahoum et al., 2004; Yiu et al., 2016). For
example, TLR4 recognizes LPS and TLR5 recognizes flagellin, a component of the
flagella of motile bacteria (Chow et al., 1999; Hayashi et al., 2001). TLR5 is most
frequently located on the basolateral surface of the intestinal epithelial layer, indicating
that bacteria need to pass through the epithelium to activate these receptors (Gewirtz et
al., 2001). In TLR5 knockout (T5KO) mice, TLR5 receptors are not present to catch any
invading bacteria, giving the invading bacteria longer to reproduce and resulting in a
more intense immune response once detected (Vijay-Kumar et al., 2008). Over time,
these immune challenges build to form a phenotype characterized by increased
inflammation, glucose sensitivity, insulin insensitivity, increased triglycerides, and
obesity, all characteristics of intestinal inflammation and metabolic syndrome
(Vijay-Kumar et al., 2007; Vijay-(Vijay-Kumar et al., 2010).
Unlike many of the previously-discussed models that increase the inflammatory
state of the gut, the physiological changes of the T5KO mouse model depend on the gut
microbiota. When GF wild-type (WT) mice are colonized with microbiota from T5KO
mice, they develop the symptoms of metabolic syndrome seen in the T5KO mice
(Vijay-Kumar et al., 2010). This is due to increased levels of Proteobacteria in the T5KO mice
as well as an increased bacterial load (Carvalho et al., 2012). In addition, the mucus
layer that protects the intestinal epithelium from contact with the microbiota is also
thinner in these mice, which allows bacteria to be closer and more adherent to the
intestinal wall (Carvalho et al., 2012). Unsurprisingly, the physiological phenotype of
T5KO mice is due to the loss of TLR5 in the intestinal epithelial cells (IEC) (Chassaing
whole-body TLR5 deficiency. T5KO mice are an excellent model to investigate the
microbiota-gut-brain-behavior axis because they show microbiota-dependent chronic
inflammation and their physiological changes are well characterized by our
collaborators. Furthermore, unlike GF mice, T5KO mice are relevant to human
health. While humans with a 75% reduction in TLR5 function do not exhibit the same
phenotype as our T5KO mice (Gewirtz et al., 2006), the phenotype of these mice is
reminiscent of metabolic syndrome, which is increasingly plaguing Western society
(Vijay-Kumar et al., 2010).
Metabolic syndrome comprises a constellation of symptoms, including obesity,
dyslipidemia, glucose intolerance, and hypertension, which increases the risk for
cardiovascular disease and type 2 diabetes. It is estimated that 20-25% of the adult
population has metabolic syndrome, making it a significant health concern (Mazidi et al.,
2016). Multiple studies have demonstrated an association between anxiety-like and
depressive-like behaviors and metabolic syndrome in mice, rats, and humans (Dinel et
al., 2011; de Cossío et al., 2017; Rebolledo-Solleiro et al., 2017; Penninx and Lange,
2018a). A similar pattern is seen in the comorbidity between functional gastrointestinal
disorders like irritable bowel syndrome and psychiatric disorders (De Palma et al., 2014;
Midenfjord et al., 2019; Zamani et al., 2019), underscoring the importance of
understanding the factors that cause this association. The TLR5 knockout mouse, with
its phenotype resembling functional gastrointestinal disorders and metabolic syndrome,
1.2 Microbiota and Neuropeptides
There has been an explosion of research into identifying and understanding
where and how gut microbiota manipulations affect neural circuitry, and a number of
neurotransmitters have been implicated in this pathway, including serotonin,
corticotropin-releasing hormone (CRF), brain-derived neurotrophic factor (BDNF),
glutamate, and dopamine, among others (Baj et al., 2019; Bercik et al., 2011;
Crumeyrolle-Arias et al., 2014; Guida et al., 2018a; Liu et al., 2016; Lukíc et al., 2019;
Nishino et al., 2013; O’Leary et al., 2018; O’Mahony et al., 2015; Palomo-Buitrago et al.,
2019; Singhal et al., 2019). Despite their roles in many behaviors affected by
microbiota, including social, anxiety-like and depressive-like behaviors, little is known
about the roles that the neuropeptides vasopressin and oxytocin play in the gut-brain
axis (reviewed in Caldwell et al., 2008; Jurek & Neumann, 2018; Kormos & Gaszner,
2013; Neumann & Landgraf, 2012). Vasopressin and oxytocin both increase social
behaviors but play opposite roles in anxiety-like behaviors (Neumann and Landgraf,
2012). Vasopressin has an anxiogenic effect, evidenced by increased central
vasopressin mRNA in rats bred for high anxiety-like behavior, and reduced anxiety-like
behavior in vasopressin receptor knockout mice (Bielsky et al., 2004; Wigger et al.,
2004). Oxytocin is anxiolytic, shown by increased anxiety-like behavior in oxytocin
knockout mice and reductions in anxiety-like behavior when oxytocin is administered
centrally (Amico et al., 2004; Ring et al., 2006). Similar patterns are seen in the
moderation of depressive-like behavior by vasopressin and oxytocin (Arletti and
sensitive to peripheral and immune signals, making these neuropeptides a likely target
in the gut-brain axis (Nava et al., 2000).
To date, very few studies have investigated the interaction between microbiota
and vasopressin and oxytocin in the brain, and these studies are generally restricted to
mRNA expression in the hypothalamus. For example, Desbonnet and colleagues found
that antibiotic treatment beginning at weaning reduced vasopressin and oxytocin mRNA
in the hypothalamus in adulthood (Desbonnet et al., 2015), but they did not see any
changes in vasopressin mRNA after treatment with the probiotic Bifidobacteria in rats
(Desbonnet et al., 2008). They also found that in a maternal separation paradigm, there
was no effect of the probiotic Bifidobacterium infantis administration on vasopressin
mRNA in the amygdaloid cortex or the hypothalamus (Desbonnet et al., 2010). This
same research group found that NIH Swiss mice showed a decrease in vasopressin
receptor 1a mRNA expression in the hypothalamus in a maternal immune activation
model that was associated with increased intestinal permeability and motility (Morais et
al., 2018). Furthermore, our lab found that rats with a naturally-occurring knockout of
vasopressin show a sex-specific shift in gut microbiota composition that is correlated
with anxiety-like behavior (Fields et al., 2018b). While these studies point to a role of
vasopressin in response to microbiota manipulations, or vice versa in the case of Fields
et al. (2018b), they are restricted only to the hypothalamus and mRNA
expression. More detailed analysis is required to truly understand the role that
vasopressin plays in the gut-brain axis.
A series of elegant mechanistic experiments demonstrated that the probiotic
spectrum disorders (ASDs) by increasing oxytocin expression in the paraventricular
nucleus of the hypothalamus (PVN; Buffington et al., 2016; Sgritta et al., 2019). This
suggests that oxytocinergic signaling is affected by the actions of bacteria, and it is
possible that behavioral alterations from changes to the gut microbiota are occurring by
disrupting the oxytocin system. In addition, stressed mice treated with antibiotics from
weaning had reduced oxytocin mRNA in the hypothalamus, and prenatal stress reduced
oxytocin receptor mRNA in the cortex and altered the gut microbiota (Desbonnet et al.,
2015; Gur et al., 2019), suggesting an interaction between stress, microbiota and
oxytocin expression. Another study did not find any change in oxytocin expression in
antibiotic-treated rats, which may point to species-specific effects of microbiota on
oxytocin (Kentner et al., 2018). Finally, human studies found that higher levels of
circulating oxytocin is associated with increased Dialister genera, associated with
glucose metabolism, but no correlation between plasma oxytocin and composition of the
fecal microbiota was found in ASD patients (Tomova et al., 2015; Barengolts et al.,
2018). While more is known about oxytocin’s place in the gut-brain axis than that of
vasopressin, it is worthwhile to investigate it further for the potential therapeutic
implications of oxytocin.
1.3 Summary of Chapters
The studies in this dissertation explore the microbiota-gut-brain axis in the
context of the effect of microbiota on behavior. While many studies recently have
explored this axis, there is still a vast deficiency in our knowledge on how microbiota
composition affects the body at the levels of microbiota ecosystem, gut physiology, gut
the roles vasopressin and oxytocin play in the gut-brain axis. We hypothesize that
microbiota change social, anxiety-like and depressive-like behaviors in part by affecting
neuropeptide pathways implicated in those behaviors, namely vasopressin and
oxytocin. We investigate this through the use of an anti-inflammatory model, GF mice,
that show decreases in anxiety-like behaviors, and a pro-inflammatory model, T5KO
mice, that should show increases to anxiety-like behaviors. We expand the findings that
microbiota influence anxiety-like and social behaviors by investigating the role that the
neuropeptides oxytocin and vasopressin may play in this pathway and correlating those
roles with behavioral expression.
In Chapter 2, I used an anti-inflammatory mouse model, GF mice, to investigate if
the gut microbiota is necessary for proper development of the vasopressin and oxytocin
systems. GF mice show myriad behavioral abnormalities, including reduced anxiety-like
behavior and decreased sociability, but the mechanisms underlying these behavioral
changes are still not fully defined. We hypothesized that oxytocin and vasopressin are
involved in modulating behavior in response to signals from the microbiota, because
these neuropeptides are sensitive to peripheral immune signals, and they are involved
in the expression of anxiety-related and social behavior (Chikanza and Grossman,
2002; Caldwell et al., 2008b; Li et al., 2017b; Jurek and Neumann, 2018b). Thus, we
characterized vasopressin and oxytocin immunoreactivity in weanling and adult mice in
the production sites (paraventricular nucleus of the hypothalamus, supraoptic nucleus,
suprachiasmatic nucleus), and projection sites of these neuropeptides (Rood and De
Vries, 2011; Rood et al., 2013). We were also interested in whether changes in these
microbiota at weaning. We settled on this time point because puberty seems to be a
critical period in the effects of microbiota on brain development (Markle et al.,
2013). Finally, despite the well-characterized behavior of adult GF mice, less is known
about their behavioral development. Thus, we investigated anxiety-like and social
behaviors in weanling-aged GF mice. Overall, we found that the lack of microbiota
affects vasopressin immunoreactivity in weanling-aged animals but has no effect in the
adults, whereas oxytocin is increased both at weaning and in adulthood in GF mice.
These changes to the vasopressin and oxytocin systems are associated with behavioral
alterations. Furthermore, recolonization at weaning is not sufficient to recapitulate
normal vasopressin and oxytocin expression, which suggests that microbiota is needed
for proper neuropeptide system development.
In Chapter 3, we used a pro-inflammatory mouse model to explore whether
chronic intestinal inflammation (1) affects anxiety-like and social behaviors, (2) is
associated with changes to the oxytocin and vasopressin systems, and (3) whether
these changes are due to microbiota changes. The use of inflammatory agents in
microbiota or behavioral research is not new. A primary manipulation used is
administration of LPS, which activates TLR4 and is responsible for inducing sickness
behavior. However, we were interested in what effect chronic intestinal inflammation,
similar to what would occur in disorders like inflammatory bowel syndrome, has on
neuropeptides and behavior. We chose to use a T5KO model that has been well
phenotyped by our collaborators and that has microbiota-dependent symptoms of
chronic intestinal inflammation and metabolic syndrome. First, we behaviorally
tests. Next, we examined vasopressin and oxytocin immunoreactivity in brain regions
that receive signals from the periphery and are involved in mediating these behaviors.
Finally, we used T5KO microbiota transplantation into GF mice to determine if the
microbiota is sufficient to cause the T5KO behavioral phenotype. We found that T5KO
mice are characterized by increased anxiety-like behavior and reduced locomotion that
is correlated with increased vasopressin immunoreactivity, and that this behavioral
phenotype is not induced by T5KO microbiota transplant into GF mice.
Combined these studies point to the need for future investigation into
vasopressin as a mediator between microbiota composition changes and behavioral
expression, as well as introduce a model of intestinal inflammation that should be
utilized in gut-brain axis research. More broadly, they point to the need for more
mechanistic or pathway driven studies to uncover the effects that microbiota have on
the central nervous system (CNS) in both health and disease states. In Chapter 4, I
discuss the larger context for the results of my experiments in the
2 MICROBIOTA ARE NECESSARY FOR PROPER NEURAL VASOPRESSIN AND
OXYTOCIN DEVELOPMENT IN MICE
Nicole V. Peters, Mary K. Holder, Daniel Teuscher, Grace Signiski, Matthew J. Paul, Jack
Whylings, Andrew T. Gewirtz, Benoit Chassaing and Geert J. de Vries
2.1 Abstract
Gut microbiota can influence anxiety-like, depressive-like and social behaviors, but
the underlying mechanisms are still mostly unknown. Because vasopressin (AVP) and
oxytocin (OXT) play significant roles in the control of these behaviors, we investigated
whether being raised in a germ-free (GF) environment permanently alters AVP and OXT
circuits. We found that compared to conventionally colonized (CC) mice, adult GF mice
had region- and sex-specific alteration of AVP and OXT immunoreactivity, and these
effects were not rescued by recolonization of GF mice at weaning. There was also
region- and sex-specific changes to microglia, a marker of neuroinflammation and
measured by Iba-1 immunoreactivity and cell number, in AVP and OXT-expressing
nuclei of GF mice. Since AVP and OXT influence juvenile anxiety-like and social
behaviors, this led us to investigate whether the behavioral and neural phenotype of GF
mice is present at weaning. We found that weanling-aged GF mice show decreased
anxiety-like behavior and decreased social behavior, similar to adult GF mice, as well as
changes to AVP and OXT immunoreactivity. These results suggest that AVP, OXT, and
microglia are influenced by microbiota during development, and the changes to these
2.2 Introduction
The microbiota that colonizes our gut, skin, oral cavity, and other regions of the
body exposed to the external environment affects the physiology of the body as well as
the brain (Foster and McVey Neufeld, 2013; Mayer et al., 2015; Dinan and Cryan,
2017). Germ-free (GF) mice, which are born and raised in sterile isolators, have been
widely used to identify systems affected by microbiota (reviewed in Cryan & Dinan,
2012; Luczynski et al., 2016). Adult GF mice have a well-established behavioral and
physiological profile, characterized by decreased anxiety-like, depressive-like, and
social behaviors, particularly in less stress-responsive mouse strains (Borre et al., 2014;
Desbonnet et al., 2014; Farzi, Fröhlich, & Holzer, 2018), as well as immature immune
system development and low intestinal inflammation (Foster and McVey Neufeld, 2013;
Luczynski et al., 2016). Colonizing GF mice before puberty with conventional
microbiota restores behavior to normal levels in GF mice (Desbonnet et al., 2014; Diaz
Heijtz et al., 2011; Pan et al., 2019a), however, colonizing after puberty does not (Sudo
et al., 2004). This suggests a critical period for the effects of microbiota on behavior,
and thus on the underlying neural circuitry.
It is still unclear what neural circuitry is affected by the low inflammatory status of
GF mice to change their behavior. Others have shown that monoamines, including
noradrenaline, dopamine, and serotonin, as well as brain-derived neurotrophic factor,
and corticotropin-releasing factor are affected in the brains of GF mice (Guida et al.,
2018b; Baj et al., 2019; Lukić et al., 2019; Palomo-Buitrago et al., 2019; Pan et al.,
2019b; Singhal et al., 2019). However, relatively little attention has been paid to the
social behavior (reviewed in Bredewold & Veenema, 2018; Caldwell, 2017; Jurek &
Neumann, 2018). Previous experiments show that antibiotic treatment reduced AVP
and OXT mRNA expression in the hypothalamus and altered anxiety-like and social
behaviors (Desbonnet et al., 2015). Furthermore, OXT is needed during probiotic
treatment to ameliorate social behavior impairments in a maternal high fat diet model
(Buffington et al., 2016; Sgritta et al., 2019). These results point to the need to further
investigate how the microbiota affects these neuropeptides.
As gut inflammation can cause neuroinflammation (Rizzetto et al., 2018; Serra et
al., 2019), we used microglia, the macrophages of the central nervous system, as a
marker of neuroinflammation (Colonna and Butovsky, 2017). GF mice tend to have an
immature microglia profile, including increased microglial number, disturbed neural
surveillance parameters, and diminished response to pathogens (Erny et al., 2015;
Castillo-Ruiz et al., 2018; Thion et al., 2018), and recolonization with microbiota before
puberty restores the microglia to a more mature profile.
In the present study, we examined the immunoreactivity of AVP, OXT, and
microglia in adult GF and conventionally colonized (CC) mice, and in GF mice colonized
with microbiota at weaning (recolonized; RE) in brain regions implicated in the control of
social and anxiety-like behaviors. We found that OXT immunoreactivity was increased
in GF mice in some regions, whereas there was no difference in AVP immunoreactivity
between GF and CC mice. We also found site- and sex-specific effects of lack of
microbiota to Iba-1 (a marker of microglia) immunoreactivity and Iba-1 positive cell
count. Recolonization did not rescue immunoreactivity to the levels of CC mice in any
This discovery led us to question whether the deficits in AVP, OXT, and microglia
were already present in weanling-aged mice. To do this, we first established that
weanling-aged mice show the same GF behavioral phenotype as described in adults,
defined by decreased anxiety-like behavior and social behavior. Then, we
characterized AVP, OXT and Iba-1 immunoreactivity in the same regions as the
previous experiment to determine if these systems are altered by weaning from the lack
of microbiota in early life, and if changes to these systems may explain the changes in
behavior in GF mice.
2.3 Materials and Methods
2.3.1 Animals
Swiss-Webster mice (GF, CC, and RE) were obtained from our breeding
program at Georgia State University. All non-sterile mice (CC and RE) were housed in
ventilated transparent Optimouse cages (35.6 x 48.5 x 21.8cm) lined with Bed-O-Cobs®
bedding, with nestlets and shelters for enrichment. Animals were kept on a 12h:12h
light:dark cycle (lights off at 1900 EST) and ambient temperature was kept at 23°C.
Food (Purina rodent chow no. 5001) and water were available ad libitum. Animals were
weaned at postnatal day 21 (P21) and housed with littermates of the same sex and
genotype. All procedures were in accordance with the Guide for Care and Use of
Laboratory Animals and were approved by the Animal Care and Use Committee at the
Georgia State University.
Germ-free mice were maintained in a Park Bioservices isolator as previously
described (Chassaing et al., 2015) and allowed ad libitum access to autoclaved food
from the established GF breeding colony at Georgia State University. Recolonized mice
were removed from the isolator at P21 and orally administered with 200uL of fecal
suspension from a sex-matched donor, then kept in conventional animal housing as
described above.
Weanling CC Swiss Webster mice used for behavioral testing were obtained
from Taconic (Germantown, NY) and allowed to habituate to the animal facility before
use in the behavioral experiment, and weanling GF mice were obtained as described
above. None of the animals used in behavioral testing were used for the anatomical
experiments.
2.3.2 Behavioral Testing
Weanling-aged mice (P21) were tested in the social interaction, marble burying,
and elevated plus maze tests, in that order, after removal from the isolators or animal
facility and an hour-long habituation to the testing room. The tests were ordered this
way, from least to most anxiogenic, to reduce residual stress from the previous test
(Mcilwain et al., 2001). GF and CC mice were not tested on the same day to reduce the
possibility of contamination of the GF mice. Behavioral testing began 3 hours after the
beginning of the light phase of the light:dark cycle, with overhead lights as illumination,
and was completed within a 6-hour time frame in one day to minimize microbiota
colonization. Mice were immediately moved from the social interaction arena to the
marble burying arena, then were returned to their home cage for between 30 minutes to
3 hours between the marble burying and EPM. This variation in time was due to the
animal order being randomized for each test. Apparatuses were cleaned with 70%
start and end of each testing day; chlorine dioxide; Quip Laboratories, Wilmington, DE)
to remove the scent of the previous mouse. An experimenter blind to treatment
conditions scored all behavioral tests.
2.3.2.1 Social Interaction
A Plexiglas arena (24cm W X 46 cm L) was filled with 2 cm of Alpha-dri bedding
(Shepherd Specialty Paper, Fibercore, Cleveland, OH, USA). Two mice from the same
litter (and therefore the same treatment) were placed into the arena and video recorded
for 10 minutes. Time spent walking, immobile, grooming, allogrooming, rearing, digging,
and investigating the other mouse were scored using Observer XT 11.5 (Noldus
Information Technology, Wageningen, The Netherlands).
2.3.2.2 Marble Burying Test
A Plexiglas arena (24cm W X 46 cm L) was filled with 4 cm of Alpha-dri bedding
(Shepherd Specialty Paper, Fibercore, Cleveland, OH, USA). Mice were placed into the
arena for a 5-minute habituation period, then removed in order to place 20 marbles
(17mm) in an evenly spaced, 4x5 grid on top of the bedding. Mice were returned to the
center of the arena and their behavior was video-recorded for 10 minutes. The number
of marbles buried during this period, defined as being half or more covered by bedding,
the latency to bury the first marble, and total time spent digging were quantified using
Observer XT 11.5 (Noldus Information Technology, Wageningen, The Netherlands).
2.3.2.3 Elevated Plus Maze
A standard mouse elevated plus maze (EPM) was used, with 2 open arms and 2
closed arms. The arms were 10 cm W x 50 cm L, connected by a 10 cm X 10 cm
cm from the floor. At the beginning of the test, mice were placed in the center square of
the arena and allowed to freely explore for 5 min. Video trials were recorded from a
digital camera mounted above the apparatus that was connected to a computer. The
number of entries into the open and the closed arms of the apparatus, time spent in
open and closed arms, and total distance traveled were quantified by AnyMaze version
4.96 (Stoelting, Co., Wood Dale, IL).
2.3.3 Euthanasia and Tissue Collections
After completion of behavioral testing, mice were deeply anesthetized using
isoflurane (5%v/v). Blood was collected by retrobulbar intraorbital capillary plexus.
Hemolysis-free serum was collected by centrifugation of blood using serum-separator
tubes (Becton Dickinson, Franklin Lakes, NJ). Following blood collection, mice were
euthanized by cervical dislocation. The weight and length of the colon and weights of
the spleen, liver, and perigonadal adipose fat depot were recorded and normalized to
the body weight.
2.3.4 Immunohistochemistry
Brains were removed and fixed in 5% acrolein in sodium phosphate buffer (0.1M,
pH 7.4) at 20°C for 24 hours, followed by cryoprotection in 30% sucrose in
phosphate-buffered saline (PBS: 0.05M, ph7.4) at 4°C until sectioning (at least 24 hours). Brains
were sectioned (30µm) in the coronal plane with a cryostat and stored in a
cryoprotectant solution (ethylene glycol/sucrose in sodium phosphate buffer) at -20°C
2.3.4.1 AVP Immunohistochemistry
Free-floating sections were rinsed five times in Tris-buffered saline (TBS; 0.05 M
Tris, 0,9% NaCl, pH 7.6), then incubated for 30 min in 0.05 M sodium citrate in TBS.
After rinsing in TBS sections were placed in 0.1 M glycine in TBS for 30 min, rinsed
again, and placed into block solution (10% normal goat serum (NGS), 0.4% Triton-X
and 1% H2O2 in TBS) for 30 min. Sections were then incubated overnight(~18 hours) in
anti-AVP (Bachem; 1:32000 dilution in TBS with 2% NGS and 0.4% Triton-X). The next
day, sections were rinsed five times in TBS containing 1% NGS and 0.02% Triton-X and
incubated in biotinylated secondary antiserum [goat anti-rabbit for AVP
immunoreactivity (Vector Laboratories, Burlingame, CA)] diluted 1:250 in TBS with 2%
NGS and 0.4% Triton-X for 1 h. This was followed by rinses in TBS containing 0.4%
Triton X, incubated in avidin-biotin complex (Vectastain Elite ABC Kit; Vector
Laboratories) diluted to 1:800 in TBS for 1 h, followed by four TBS rinses. Finally, the
staining was visualized using nickel-enhanced diaminobenzidine (DAB) Substrate Kit
(Vector Laboratories). Sections were mounted onto gelatin-coated slides and
cover-slipped with Permount.
2.3.4.2 OXT Immunohistochemistry
Sections were subjected to the same procedure outlined above, with the
exception of the sodium citrate step, and the secondary antibody and ABC steps were
increased to 90 minutes. Anti-OXT primary antibody (Peninsula Labs, 1:120,000) and
2.3.4.3 Iba-1 Immunohistochemistry
Sections were treated as outlined above with the following changes. Sections
were washed nine times in TBS before a 60 min sodium citrate step. A concentrated
blocking solution was used (TBS with 20% normal goat serum, 0.3% Triton-X, and 1%
hydrogen peroxide), and sections were incubated overnight in rabbit anti-Iba-1primary
antibody (Fisher, 1:20,000) diluted in TBS with 2% NGS and 0.3% Triton-X. Slices were
then rinsed in dilute blocking solution (TBS with 1% NGS and 0.02% Triton-X) three
times before secondary antibody.
2.3.5 Image Analysis
Matched sections for each mouse were imaged using a Zeiss Axio Imager M2
microscope connected to an ORCA-R2 CCD digital camera (Hamamatsu Photonics).
Gray-scale images of the fiber density or positively labeled cell bodies in the
photomicrographs were gray-level threshold analyzed in Image J 1.43u (National
Institutes of Health, Bethesda, MD) in accordance to the methods previously described
in Rood et al., 2012. The region of analysis was outlined in each section. Subjects for
which the relevant sections were damaged or unavailable were dropped from a given
analysis. Brain regions were selected from each of the three neuropeptide source and
projection pathways: the PVN/SON pathway, the BNST-medial amygdala (MA)
pathway, and SCN pathway (as described in Rood & De Vries, 2011). The PVN/SON
pathway includes the PVN. The BNST-MA pathway includes the lateral habenula
(LHb), ventral lateral septum (LS), and mediodorsal nucleus of the thalamus (MD). The
SCN pathway includes the SCN, subparaventricular zone (SPZ), paraventricular
(DMH). Cell counts were only available for OXT and Iba-1 staining, as the dense
packing of cells and abundance of AVP-ir fibers made distinguishing individual cells
impossible. The SON was not included in AVP-ir analysis because the staining was too
dark to discern cell bodies or fiber tracts.
2.3.6 Statistical Analysis
Data were analyzed and visualized using IBM SPSS Version 21 (IBM). All data
were analyzed by a two-way ANOVA with sex and treatment as factors, followed by
Bonferroni post-hoc analyses. Differences in the post-hoc comparisons were noted as
significant *p<0.05.
2.4 Results
2.4.1 Animals
All animals used in this study were in good health with no impairments. A total of
55 adult mice were used in the adult IHC experiment (9 male GF, 8 female GF, 10 male
CC, 7 female CC, 13 male RE, and 8 female RE). In the weanling-aged IHC
experiment, 29 mice were used (6 male GF, 9 female GF, 7 male CC, and 7 female
CC). Finally, in the weanling-aged behavioral experiment, 63 mice were used (16 male
GF, 17 female GF, 19 male CC and 11 female CC), except for the social interaction
test, where 8 male CC and 4 female CC were excluded due to being paired with
2.4.2 Adult Immunoreactivity
2.4.2.1 AVP Immunoreactivity
2.4.2.1.1 Suprachiasmatic Nucleus and Projection Sites
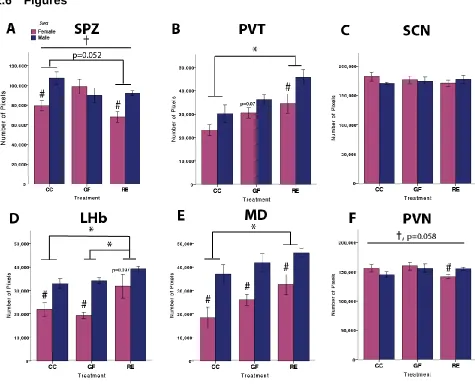
In the subparaventricular zone (SPZ), an effect of microbiota on AVP-ir emerged
that resulted in a sex by treatment interaction (Figure 2.1A, F(2, 53)= 5.880, p=
0.005). In this region, male CC mice had higher AVP-ir expression than the CC females
(F(1, 53)= 8.961, p=0.004). This sex difference was abolished in the GF mice but
rescued in the RE mice. The overall levels of AVP-ir in RE mice were decreased
compared to the CC mice (main effect of treatment, F(2, 53)= 4.008, p= 0.025;
Bonferroni post-hoc analysis, p= 0.052).
The PVT showed a different AVP-ir expression pattern than the SPZ. RE mice
had higher levels of AVP-ir than CC mice (Figure 2.1B; main effect of treatment, F(5,
53)= 8.578, p=0.001; Bonferroni post-hoc analysis, p<0.001) and a trend towards higher
levels than GF mice (p=0.059). Males had consistently higher AVP-ir than females (F(5,
53)= 9.038, p=0.004).
There was no effect of germ-free status or recolonization on AVP-ir in the
suprachiasmatic nucleus (SCN; Figure 2.1C, p>0.05). A projection site of the SCN, the
DMH, also showed no differences between sex and treatment groups (p>0.05, data not
shown).
2.4.2.1.2 Bed Nucleus of the Stria Terminalis-Medial Amygdala Pathway Projection
Sites
In the lateral habenula (LHb), RE mice had greater AVP-ir than GF or CC mice
respectively). GF and CC males had higher levels of immunoreactivity than females
(F(1, 54)= 30.563, p<0.001), and this sex difference was abolished in the RE mice. In
the mediodorsal nucleus of the thalamus (MD), RE mice showed an increase in AVP-ir
compared to CC mice (Figure 2.1E; F(2, 52)= 5.278, p=0.009; Bonferroni post-hoc
analysis, p=0.009). Again, we replicated the sex difference seen in this region, in which
males have a significant increase in immunoreactivity compared to the females (F(1,
52)= 29.759, p<0.001). In the lateral septum (LS), a projection site of the BNST, we
replicated the well-established sex difference in AVP-ir (F(1, 54)= 91.245, p<0.001, data
not shown), in which males had almost twice the immunoreactivity levels as the females
in each treatment group (Gatewood et al., 2006; Rood et al., 2013).
2.4.2.1.3 Paraventricular Nucleus of the Hypothalamus
There was a trend towards a sex by treatment interaction on AVP-ir in the PVN
(Figure 2.1F; F(2, 54)= 3.012, p= 0.058), where male RE mice had higher levels of
AVP-ir than female RE mice (p= 0.003).
2.4.2.2 OXT Immunoreactivity
2.4.2.2.1 Paraventricular Nucleus of the Hypothalamus and Projection Areas
Germ-free mice had an increase in OXT-ir positive cells in the PVN compared to
CC mice (Figure 2.2A; F(2, 54)= 4.165, p=0.021; Bonferroni post-hoc analysis,
p=0.013). Recolonization with CC microbiota only partially returned the number of
immunoreactive cells to CC levels. There was no difference in OXT-ir between groups
in the PVN pixel number analysis despite an increase in OXT-ir cells in GF mice
Recolonization had differing effects on OXT-ir in the AH and PVT. In the AH,
there was a trend towards RE mice having higher levels of OXT-ir than GF or CC mice
(Figure 2.2B; F(2, 54)=2.431, p=0.098). In the PVT, a sex difference emerged in the RE
mice, in which the females had higher immunoreactivity than the males (t-test, p=0.003).
This sex difference was large enough to result in a trend towards an interaction between
sex and treatment in the overall ANOVA (Figure 2.2C; F(2, 54)= 2.926, p=0.063).
Converse to the previous regions, there was a decrease in OXT-ir positive cells
in the BNST in GF and RE mice (Figure 2.2D; F(2, 54)= 4.178, p=0.021; Bonferroni
post-hoc analysis, p=0.07 and p=0.087, respectively). Despite the increase in OXT-ir
positive cells, there was no difference in OXT-ir pixel number. There was a sex
difference in the CC and a trend towards significance in GF groups, where females
show more immunoreactivity than males (F(1, 54)= 5.637, p=0.022; t-test, p=0.027 and
0.096, respectively, data not shown).
There was no difference between treatment or sex in the SPZ (p>0.05).
2.4.2.2.2 Supraoptic Nucleus
Germ-free females had more OXT-ir positive neurons than the males, who had
similar levels to the other groups (Figure 2.2E; t-test, p=0.031). Females had higher
levels of OXT-ir than males, but this did not quite reach significance (F(1, 39)= 3.167,
p=0.084).
2.4.2.3 Iba-1 Immunoreactivity
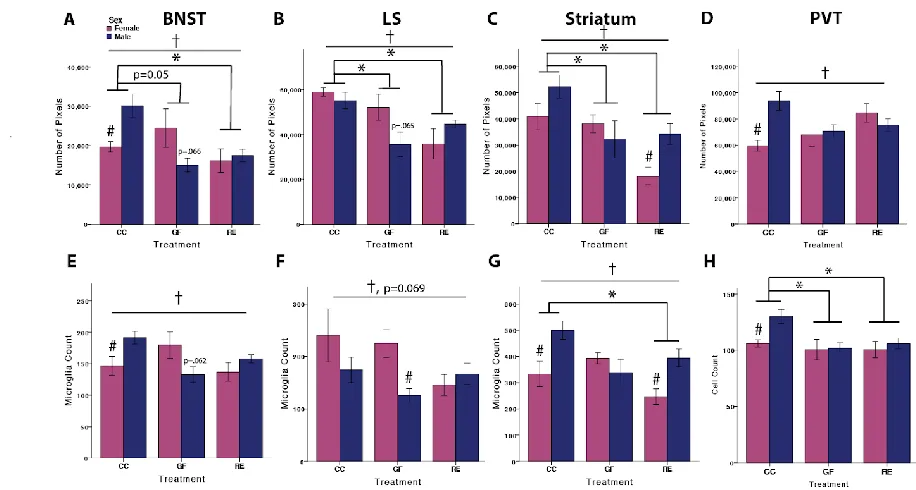
In the BNST, there was a sex by treatment interaction in Iba-1 immunoreactivity
(Figure 2.3A; F(2, 52)= 5.883, p=0.005), driven by greater immunoreactivity in male CC
immunoreactivity in the GF and RE mice compared to CC mice (Bonferroni post hoc
analysis, p=0.05 and p=0.003, respectively). Iba-1 positive cell counts in the BNST
showed a similar pattern to Iba-1 immunoreactivity (Figure 2.3E; sex by treatment
interaction, F(2, 52)= 6.511, p= 0.003), including the reversal of the sex difference in the
GF mice, but there were no significant differences between treatment groups
(Bonferroni post-hoc analysis, p>0.05). This pattern of sex differences and decrease
from CC mice persisted in Iba-1 positive cell counts, resulting in a sex by treatment
interaction (F(2, 37)= 5.233, p=0.011). CC mice had higher cell counts than RE mice
(p=0.034).
There was a sex by treatment interaction in Iba-1 immunoreactivity in the LS
(Figure 2.3B; F(2, 37)= 4.059, p= 0.027), driven partially by the appearance of a sex
difference in GF mice. GF mice and RE mice had decreased immunoreactivity
compared to CC mice (Bonferroni post-hoc analysis, p=0.027 and p=0.003,
respectively). There was a trend towards a sex by treatment interaction in Iba-1 positive
cell counts (Figure 2.3F; F(2, 37)= 2.913, p=0.069), driven by a sex difference in the GF
mice, with females showing higher numbers of microglia than males (main effect of sex,
F(1, 37)= 4.972, p=0.033).
In the striatum, there was a trend towards a sex by treatment interaction (Figure
2.3C; F(2, 37)= 3.051, p=0.061) in Iba-1 immunoreactivity. CC mice had higher levels
of immunoreactivity than GF or RE mice (F(2, 37)= 9.5, p=0.001, Bonferroni post-hoc
analysis, p=0.044 and p<0.001, respectively). There was an increase in
immunoreactivity in the males of CC mice and RE mice, but not in the GF animals,
pattern of sex differences and decrease from CC mice persisted in Iba-1 positive cell
counts, resulting in a sex by treatment interaction (Figure 2.3G; F(2, 37)= 5.233,
p=0.011). CC mice had higher cell counts than RE mice (t-test, p=0.034).
There was a sex by treatment interaction in Iba-1 immunoreactivity in the PVT
(Figure 2.3D; F(2, 51)= 6.080, p=0.005), driven by greater immunoreactivity in the male
CC mice (p= 0.001). CC mice had higher numbers of Iba-1 positive microglia compared
to both GF and RE mice (Figure 2.3H; F(2, 51)= 4.123, p= 0.023, Bonferroni post-hoc
analysis, p= 0.019 and p= 0.039, respectively), driven by a similar increase in male CC
Iba-1 cells (p= 0.006), leading to an almost significant main effect of sex (F(1, 51)=
3.945, p=0.053). GF and RE mice did not have a sex difference in Iba-1 expression,
indicating that this sex difference is established by microbiota exposure before weaning.
There were no treatment differences in Iba-1 immunoreactivity nor Iba-1 positive
cell count in the PVN (p>0.05).
2.4.3 Weanling-Aged Immunoreactivity
Due to the above results, showing that recolonization does not rescue GF mice
to expression levels of CC mice, we were interested in whether weanling-aged GF mice
show similar deficits in AVP, OXT and Iba-1 expression. We first examined AVP, OXT,
and Iba-1 expression in weanling-aged mice to establish whether changes to these
systems are present at weaning. In a cohort, we established the behavioral and
morphological profile of weanling-aged mice, to determine if any changes in these
2.4.3.1 AVP Immunoreactivity
2.4.3.1.1 Suprachiasmatic Nucleus and Projection Sites
In the SCN, GF mice showed less immunoreactivity than the CC mice (Figure
2.4A; F(3, 28)= 15.877, p=0.001). In a projection site from the SCN, the DMH, there
was a similar decrease in AVP-ir in the GF mice (Figure 2.4B; F(3, 28)=5.954,
p=0.022). There was no effect of germ-free status on AVP-ir in the SPZ (p>0.05; data
not shown).
A different pattern was seen in the anterior portion of the PVT. GF mice had
higher AVP-ir than CC mice (Figure 2.4C; F(3, 28)= 6.179, p=0.02), driven by a
substantial increase in AVP-ir in the females (sex by treatment interaction, F(3, 28)=
5.733, p= 0.024).
2.4.3.1.2 Paraventricular Nucleus of the Hypothalamus
In the PVN, the GF mice had higher levels of AVP-ir than the CC mice, but this
difference did not reach significance (Figure 2.4D; F(3, 28)= 2.992, p= 0.096).
2.4.3.1.3 Bed Nucleus of the Stria Terminalis and Projection Sites
At weaning, there was no visible staining in the lateral septum, lateral habenula
or mediodorsal nucleus of the thalamus with the antibody for AVP used in this study,
2.4.3.2 OXT Immunoreactivity
2.4.3.2.1 Paraventricular Nucleus of the Hypothalamus and Projection Sites
Germ-free mice had increased OXT-ir compared to CC mice in the PVN (F(1,
28)= 21.946, p<0.001, data not shown). This may be partially attributed to an increase
in OXT-ir positive cells in GF mice (Figure 2.5A, F(1, 28)= 21.54, p<0.001).
There was no effect of the lack of microbiota on OXT fiber projections from the
PVN in the anterior hypothalamus (AH; Figure 2.5B), PVT (Figure 2.5C), DMH and SPZ
(data not shown; p>0.05). Females had increased OXT-ir in the BNST compared to
males (F(1, 28)= 7.171, p=0.013, data not shown). However, there was an interaction
of sex and treatment in OXT-ir positive cells in the BNST (Figure 2.5D; F(1, 27)= 4.608,
p= 0.042), where GF males had a trend towards increased OXT-ir cells than GF
females (p=0.077).
2.4.3.2.2 Supraoptic Nucleus
Germ-free mice had an increased number of OXT-ir positive cells in the SON
(Figure 2.5E; F(1, 28)= 5.611, p=0.026). This did not extend to an increase in OXT-ir in
the SON area analyzed, however (p>0.05).
2.4.3.3 Iba-1 Immunoreactivity
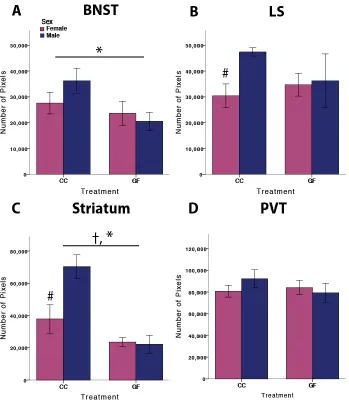
GF mice showed less Iba-1 immunoreactivity (Figure 2.6A; F(1, 26)= 4.584,
p=0.043) and less microglia cell counts (F(1, 26)= 9.656, p=0.005, data not shown) than
CC mice in the BNST. There was a sex by treatment interaction in the striatum (Figure
2.6C; F(1, 19)= 6.937, p=0.018), in which the sex difference in Iba-1 immunoreactivity in
the CC mice was abolished in GF mice. This interaction was driven by the greater
mice compared to CC mice (F(1, 19)= 21.127, p<0.001, data not shown), and there was
a trend towards a main effect of sex (F(1, 19)= 3.336, p=0.087). In the PVN, there were
no effects of sex or treatment on Iba-1 immunoreactivity, but there was a trend towards
a sex by treatment interaction in microglia count (F(1, 27)= 3.219, p=0.085, data not
shown). There were no differences in sex or treatment in Iba-1 positive cells or
immunoreactivity in the LS (Figure 2.6B) or PVT (Figure 2.6D; p>0.05).
2.4.4 Weanling-Aged Behavior and Body Measures
2.4.4.1 Social Behavior
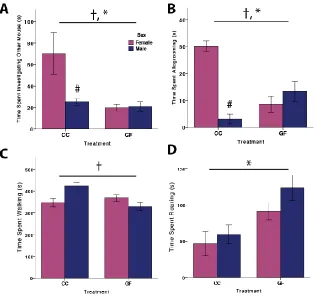
GF mice spent less time interacting with a familiar mouse in the social interaction
test than CC mice, (Fig. 2.7A, F(3, 59)= 19.149, p<0.001). Male CC mice showed
similar levels of social interaction as both male and female GF mice, indicating that a
lack of microbiota abolished the sex difference seen in the CC mice, whereas female
CC mice spent more time socially with the target mouse, resulting in a main effect of
sex, (F(3, 59)= 12.343, p<0.001), and an interaction between sex and treatment (F(1,
59)= 13.457, p<0.001). This same pattern was seen in allogrooming behavior, where
GF mice also spent less time allogrooming than CC female mice, but more than the CC
males, resulting in a sex by treatment interaction (Fig. 2.7B, F(3, 17)= 9.052, p= 0.009).
There was an interaction between sex and treatment in time spent walking in the
arena (Fig. 2.7C, F(3, 59)= 6.751, p= 0.012). This was driven by a reversal in the
direction of sex differences from CC males walking more to GF females walking
more. When not walking or interacting with the other mouse, GF mice spent their time
rearing, (Fig. 2.7D; F(3, 56)= 7.758, p=0.007), and showed a trend towards spending
was no difference between GF and CC mice in time spent immobile or time spent
digging in the bedding (p>0.05; data not shown).
2.4.4.2 Marble Burying Test
Conventionally colonized males spent more time digging than CC females in the
marble burying test (Fig. 2.8A; F(3, 74)= 4.788, p=0.032), but this sex difference is
abolished in the GF mice. Both GF and CC mice walked in the arena similar amounts
of time (p>0.05; data not shown), but the main difference lied in their behavior when not
walking and digging. GF mice spent more time immobile (Fig. 2.8B; F(3, 74)= 15.268,
p<0.001), in which they were not actively investigating the arena, versus the CC mice,
who spent more time rearing against the walls of the arena (Fig. 2.8C; F(3, 74)= 11.647,
p=0.001).
2.4.4.3 Elevated Plus Maze
Weanling aged GF mice showed decreased anxiety behavior in the elevated plus
maze, as measured by time spent in the open arms (Figure 2.9A; F(3, 74)=8.039,
p=0.006). This difference was due to GF mice spending more time in the outer half of
the open arms of the apparatus than CC mice (Figure 2.9B; F(3, 62)=10.898, p=0.002),
but not due to an increase in distance traveled in the GF mice (Figure 2.9C;
p>0.05). There was no difference in the time spent immobile in the apparatus between
the GF and CC mice (p>0.05; data not shown).
2.4.4.4 Body Measures
Overall, weanling GF mice weighed less than the CC mice (Fig. 2.10A, F(3, 44)=
40.43, p<0.001), driven by smaller gonadal adipose deposits (Fig. 2.10B, F(4, 62)=