International Journal of Emerging Technology and Advanced Engineering
Website: www.ijetae.com (ISSN 2250-2459, ISO 9001:2008 Certified Journal, Volume 7, Issue 11, November 2017)
62
Identification of QRS Complexes in Single Lead ECG Using
K-Means Algorithm and Combined Entropy Criterion
Shantanu Choudhary
1, S S Mehta
21Lecturer Electrical Engineering, Govt. Polytechnic College, Government of Rajasthan, Jodhpur, India- 342001
2 Professor Electrical Engineering, MBM Engineering College, Jai Narain Vyas University, Jodhpur, India- 342001
Abstract- An electrocardiogram is a measure of how the electrical activity of the heart changes over time as action potentials propagate throughout the heart during each cardiac cycle. Electrocardiogram (ECG) is an important bioelectric signal used for assessing the cardiac system. Among the various components of ECG, QRS-complex is the most prominent feature and the other features are identified in context with it. Therefore, the accurate detection of QRS complex forms the basis of reliable ECG interpretation and diagnosis system. Automatic detection of QRS-complex is a challenging task because the QRS complex has its amplitude and morphology varying over a wide range. A number of methods reported in literature for the detection of QRS complex with varying degree of success. New method for automatic QRS complex detection using K-means algorithm and combined entropy criterion has been developed in the present work. Using this algorithm onthe standard CSE ECG database,QRS-complexes have been identified with an accuracy of 99.21% with 0.82%of false negative (FN) and 1.94% of false positive (FP) respectively
Keywords— ECG, K-means, Entropy, Combined Entropy, QRS complex
I. INTRODUCTION
An electrocardiogram, also called an ECG, which is abbreviated from the German word Elektro-Kardiographie, or EKG, is a simple, non-invasive test that records the heart's electrical activity, which is used in the investigation of heart diseases. It consists of a recurrent wave sequence of P-wave, QRS-complex and T-wave associated with each beat. Fig. 1 shows the components of an electrocardiogram. Unlike the bio-currents generated by some other muscles the currents generated by the heart muscles are periodic means they consist of a repeated sequence of characteristic waveforms, which correspond to a heart-beat. From clinical practice it is possible to make accurate ECG diagnoses in some diseases and to estimate other diseases with an acceptable probability. Therefore, most of the abnormality of the heart can be found out by looking at the various features of the ECG.
The QRS-complex is the most striking waveform within the electrocardiogram. Its abrupt and high amplitude makes QRS-detection easier than the other waves.[1] Thus, it is generally used as a reference within the cardiac cycle. The QRS represents the spread of the electrical impulse through the muscle of the ventricles.
A wide diversity of algorithms like derivative based
algorithms, algorithms based on digital filters,
mathematical transformation, wavelet transform, pattern recognition techniques, artificial neural networks, genetic algorithms, statistical methods, Heuristic methods etc. have been proposed in the literature for QRS-detection. Kohler et al [2] described and compared the performance of all the QRS-detectors reported in literature till 2002.
Recently, few other methods based on Hilbert transform
[3], moving-averaging incorporating with wavelet
denoising [4], first derivative [5], Genetic Algorithm [6], adaptive quantized threshold [7], Sigmoidal radial basis function ANN [8], use of pre-processing techniques and kurtosis based enhanced efficiency [9] have been proposed or the detection of QRS complexes. With the advent of technology we are witnessing amazing advancements in all the fields, including QRS-detection. Chen and Chuang [10] have proposed a real-time QRS detection and R point recognition method with low computational complexity wherein the enhancement of QRS segments and restraining of P and T waves are carried out by the proposed ECG signal transformation, which also leads to the elimination of baseline wandering. Novel feature of this method is that it is used for Wearable Single-Lead ECG Devices and utilizes Mobile Healthcare system.
International Journal of Emerging Technology and Advanced Engineering
Website: www.ijetae.com (ISSN 2250-2459, ISO 9001:2008 Certified Journal, Volume 7, Issue 11, November 2017)
63 FIG. 1- COMPONENTS OF ELECTROCARDIOGRAM
II. METHODS ADOPTED FOR NDT
K-means Algorithm
A clustering technique known as K-means algorithm has been used in the present work for the detection of QRS-complexes in ECG. Pattern classification by distance function is one of the earliest concepts in automation tool follows naturally from the fact that the most obvious way of establishing a measure of similarity between pattern vectors, which consider as point in Euclidean space, is by determining their proximity.[13] These concepts are generalized and developed in mathematical framework. Since proximity of an unknown pattern to the patterns of class will serve as a measure of its classification, the term minimum distance pattern classification will be used to characterize this approach. The clustering properties play an important role in the performance of classifiers based on a distance concept. For pattern classification, several cluster seeking algorithms like simple cluster seeking algorithm, Maximum distance algorithm and K-means algorithms are available. A simple cluster seeking algorithm needs the extensive experimentation with various values of the threshold and Maximum distance algorithm is not self organizing. So, K-means algorithm is best choice for clustering. When a number of samples are given and it is required to group them into K number of clusters, K-means algorithm can be used. It is based on the minimization of performance index, which is defined as the sum of square distances from all points in a cluster domain to the cluster center. [14]
The various procedural steps of the K-means algorithm are as follows:
Step 1: Choose initially K cluster centers z1 (1), z2 (1)... zk(1). These are arbitrary and are usually selected as the first K samples of the given samples set.
Step 2: At the kth iterative step, distribute the samples {x} among the K cluster domains, using the following relation,
(1)
For all i = 1, 2,..., K, i j, where denotes the set
of samples whose cluster center is zj(k).
Step 3: from the results of step 2, compute the new cluster
centers , j = 1, 2,…,K, such that the sum of the
squared distances from all the points in to the new
cluster center is minimized. In other words, the new center is computed so that the performance index,
(2)
is minimized. The which minimizes this
performance index is simply the sample mean of S j(k). Therefore, the new cluster center is given by,
(3)
Where, Nj is the number of samples in S j(k). The name "K-means" is obviously derived from the manner in which cluster are sequentially updated.
Step 4: (k+1) = (k) for j = 1,2,....K, the algorithm has
converged and the procedure is terminated. Else go to step 2.
The strength of the method is its simplicity, efficiency and self-organization capability. Because of its simplicity, it is still widely used in the clustering initialization.
International Journal of Emerging Technology and Advanced Engineering
Website: www.ijetae.com (ISSN 2250-2459, ISO 9001:2008 Certified Journal, Volume 7, Issue 11, November 2017)
64 The limitations are: 1) The number of clusters, K must be pre-specified; 2) it is a linearly separating algorithm.
Preprocessing of ECG Signal
The recorded ECG signal is often contaminated by noise and artifacts that can be within the frequency band of interest and manifest with similar characteristics as the ECG signal itself. In order to extract useful information from the noisy ECG signals, we need to process the raw ECG signals. Inroutine recording procedures of ECG it may contain degree of noise. Therefore, before any
processing these noises should be minimized.
Preprocessing stage removes the 50 Hz power line interference and the base line wander from the recorded ECG signal.A digital filter is used to remove 50 Hz frequency interference components from ECG signal. The filter proposed by Furno and Tomplins [15] is used to remove 50Hz power line interference.The Finite impulse response (FIR) notch filter proposed by Van Alste and Schilder [16] is used to remove baseline wander. The adaptive filter to remove base line wander is a special case of notch filter with notch at zero frequency (or dc). This filter has a 'zero' at dc and consequences creates a notch with a bandwidth of (µ/π)*fs, where fs is the sampling frequency of the signal and µ is the convergence parameter. Frequencies in the range 0-0.5Hz are removed to reduce the base the drift. The convergence parameter µ used is 0.0025. The slope at every sampling instant of the filtered ECG signal is calculated for each lead and these are clustered into two classes, namely QRS and non-QRS classes using K-means of clustering algorithm [17]. Slope is used as an important feature because slope of the ECG signal was much more in the QRS region than in the non-QRS region. The probability, Pi(x) of slope at each sampling instant belonging to each of the two classes is calculated using (4)
i = 1, 2; x = 1, 2,...., s (4)
Where i and mi are the standard deviation and mean of
ith class and s represents total number of samples in the
ECG signal.
Entropy is a statistical measure of uncertainty. A feature, which reduces the uncertainty of a given situation are considered more informative than those, which have opposite effect.
Thus, a meaningful feature selection criterion is to choose the features that minimize the entropy of the pattern class under consideration.
The entropy hi(x) at each sampling instant belonging to
QRS and non-QRS-class is calculated using equation 5. hi(x)= -Pi(x) loge Pi(x),
i= 1, 2; x = 1,2,...., s (5)
These entropies are then normalized using equation 6. hin(x) = (hi(x) – Himin) / (Himax – Himin)
i= 1,2; x= 1,2,..., s (6)
where hin(x) is normalized entropy and Himin, Himax are
the minimum and maximum values of entropy hi(x)
respectively.
The combined entropy, hc(x) is then calculated by using
equation 7. Thereafter it is also normalized.
hc(x)= (1- h2n(x) )* h1n(x) (7)
Thus, from a single filtered ECG signal, one absolute slope curve; two normalized entropy curves, one for the QRS-entropies and other for the non-QRS-entropies; and one combined entropy curve are obtained. Similar procedure is applied for remaining leads of a subject and for all the subjects from the CSE ECG data-set 3.
Single lead QRS-detection algorithm using K-means and Combined Entropy criterion
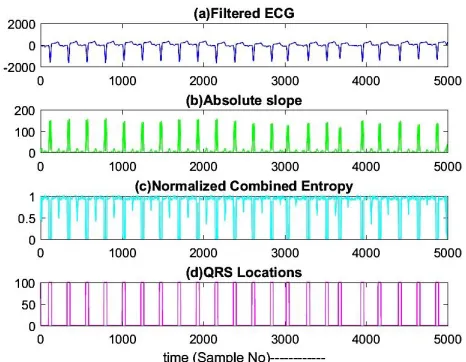
Step 1: A raw digital single lead ECG signal of a patient is acquired and it is filtered to remove power line interference and baseline wander. Fig. 2(a) displays the filtered ECG signal after removal of power line interference and base line wander.
Step 2: The absolute value of slope of the ECG signal is used as an important discriminating feature. The absolute slope of the signal is much more in the QRS-region than in the region other than QRS as depicted in Fig. 2(b). The absolute slope is calculated to enhance the signal in the region of QRS-complex. These absolute slope values are then normalized to reduce the burden on the classifier. Step 3: K-means is applied to the absolute slope. It is done in order to cluster them into two groups, the QRS and non-QRS regions. An output of 1 is marked if the sample belongs to the QRS-cluster and 0 for the non-QRS-cluster.
International Journal of Emerging Technology and Advanced Engineering
Website: www.ijetae.com (ISSN 2250-2459, ISO 9001:2008 Certified Journal, Volume 7, Issue 11, November 2017)
65 Step 5: By using the probabilities of QRS and non-QRS classes, the entropy at each sampling instant, belonging to QRS and non-QRS-class is calculated. These entropies are then normalized.
Step 6: The combined entropy of each QRS and non-QRS class is then calculated. Thereafter, it is also normalized. Fig. 2(c) displays the combined entropy after application of K-means, calculation of probability and calculation of Entropy and Combined Entropy and their normalization.
Step 7: Thereafter, K-means is re-applied on normalized combined entropy in order to further refine the QRS and non-QRS regions in two groups. It is observed that we get a train of 1’s in QRS regions. These trains of 1’s are used to form square wave pulses.
Step 8: All the candidate QRS pulses are picked and using their duration, average pulse width is evaluated. Those trains of 1's, whose duration turns out to be more than the average pulse widths are detected as QRS-complex and the other ones are discarded.
The trains of 1's are obtained in the P or T-wave region also but with small duration as compared to that of QRS-complex. In order to differentiate between trains of 1's for QRS-complex and that of peaky P or T-waves, an average duration of the trains of 1's is calculated. Those trains of 1's whose duration is greater than average pulse width are picked up as QRS-complexes and those whose duration is smaller than the average pulse width are discarded. Thus, average pulse duration criterion reduced the number of false positive detection. The locations of the QRS-complexes are shown by the curve Fig. 2(d).
Step 9: The numerical result is plotted for better visualization and saved to computer memory.
FIG. 2- RESULTS OBTAINED AT VARIOUS STEPS OF THE ALGORITHM - (A) FILTERED ECG, (B) ABSOLUTE SLOPE OF ECG, (C) NORMALIZED COMBINED ENTROPY, (D) QRS-COMPLEXES IDENTIFIED BY THE
ALGORITHM
Performance Evaluation
[image:4.612.328.561.141.322.2]International Journal of Emerging Technology and Advanced Engineering
Website: www.ijetae.com (ISSN 2250-2459, ISO 9001:2008 Certified Journal, Volume 7, Issue 11, November 2017)
66 (8)
(9)
In the dissertation, k-means has been used for QRS-detection in single lead ECG along with combined entropy criterion. A testing set of 1500 single-lead ECGs picked from dataset 3 of CSE ECG database has been used. There are 17856 QRS-complexes in all the 1500 single-lead ECGs. Out of these 17709 QRS have been correctly detected. Thus, the detection rate of 99.21% has been obtained. The percentages of false positive (FP) and false negative (FN) detection obtained are1.94% and 0.82% respectively. The detection rate of proposed algorithm for QRS detection is found to be better than the detection rate of the algorithms reported in literature and tested on the same database [19, 20, 21, 22]. The sensitivity and positive predictivity of proposed algorithm for QRS- detection are found to be 99.18% and 98.08% respectively.
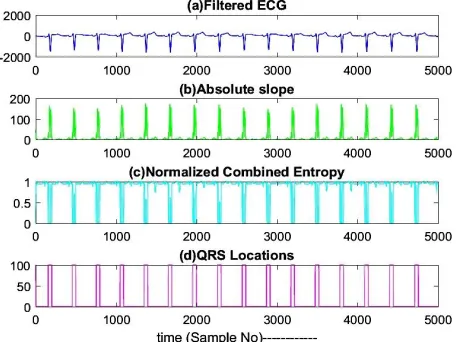
Fig. 3 shows QRS-detection in lead V1 of record MO1_102. The P and T-waves are not prominent in this case. This means QRS-complexes are prominent and hence slope in this QRS-region is more. The absolute value of slope ensures positive prediction of QRS-complexes and with application of entropy a refined graph for QRS locations has been obtained. Hence, the algorithm has corrected all the sixteen QRS-complexes of RS morphology.
FIG. 3- QRS DETECTION IN LEAD V1 OF RECORD MO1_102(A) FILTERED ECG, (B) ABSOLUTE SLOPE OF ECG, (C) NORMALIZED
COMBINED ENTROPY, (D) QRS-COMPLEXES IDENTIFIED BY THE ALGORITHM
Fig. 4 shows QRS-detection in lead aVF of record MO1_083. In this record P-wave and T-wave are prominent. Though their amplitudes are comparable but their slope is less compared to QRS-complexes as can be seen in absolute slope curve. Moreover, the normalized combined entropy has low values in QRS-regions. Hence, the algorithm has correctly detected all the fifteen QRS-complexes out of fifteen.
FIG. 4-QRS DETECTION IN LEAD AVF OF RECORD MOI_083, (A) FILTERED ECG, (B) ABSOLUTE SLOPE OF ECG, (C) NORMALIZED
COMBINED ENTROPY, (D) QRS-COMPLEXES IDENTIFIED BY THE ALGORITHM
[image:5.612.55.284.502.673.2]International Journal of Emerging Technology and Advanced Engineering
Website: www.ijetae.com (ISSN 2250-2459, ISO 9001:2008 Certified Journal, Volume 7, Issue 11, November 2017)
67 FIG. 5-QRS DETECTION IN LEAD AVF OF RECORD MO1_066(A)
FILTERED ECG, (B) ABSOLUTE SLOPE OF ECG, (C) NORMALIZED COMBINED ENTROPY, (D) QRS-COMPLEXES IDENTIFIED BY THE
ALGORITHM
It can be seen in Fig. 6which shows QRS detection in lead V2 in subject MO1_065that P and T-wave are of normal and consistent amplitude. However, two QRS-complexes have very small amplitude as compared to the other QRS-complexes and hence their slope is also very small as compared to the remaining ones. Therefore, these two QRS-complexes are not identified, resulting in a case of two false negative (FN). Hence, the algorithm has correctly detected ten QRS-complexes out of twelve in lead V2 of record MO1_065.
FIG. 6- QRS DETECTION IN LEAD V2 OF RECORD MO1_065(A) FILTERED ECG, (B) ABSOLUTE SLOPE OF ECG, (C) NORMALIZED
COMBINED ENTROPY, (D) QRS-COMPLEXES IDENTIFIED BY THE ALGORITHM
It can be seen the Fig. 7 that amplitudes of the QRS-complexes are varying over a wide range and over that three T-waves are of very large amplitude due to which their slope is comparable rather more prominent than that of QRS-complexes. Also, one QRS-complex has very small amplitude as compared to the other QRS-complexes and hence its slope is also smaller as compared to the remaining ones. Therefore, this one QRS-complex was not identified; resulting in a case of one false negative and the above-mentioned three T-waves were detected, resulting in three false positives. Hence, the algorithm has correctly detected all the ten QRS-complexes out of eleven in lead V2 of record MO1_103.
FIG. 7- QRS DETECTION IN LEAD V2 OF RECORD MO1_103(A) FILTERED ECG, (B) ABSOLUTE SLOPE OF ECG, (C) NORMALIZED
COMBINED ENTROPY, (D) QRS-COMPLEXES IDENTIFIED BY THE ALGORITHM
III. CONCLUSION
The detection of QRS-complexes in ECG using k-means algorithm and combined entropy criterion has been demonstrated in the present work. Further, it has been shown that this algorithm gives the better results than some of the other algorithms reported in the literature. The detection of QRS-complexes in single lead using K-means has been tested on 1500 single-lead ECG records picked from data set 3 of CSE ECG database. The detection rate of 99.21% has been obtained and percentages of false positive (FP) and false negative (FN) detection are also very low.
International Journal of Emerging Technology and Advanced Engineering
Website: www.ijetae.com (ISSN 2250-2459, ISO 9001:2008 Certified Journal, Volume 7, Issue 11, November 2017)
68 Therefore, this method can be used for monitoring patients in intensive care units (ICU) in hospital. This method can be viewed as simple and effective for the analysis of ECG. Moreover, this approach can be also used in other biomedical signal processing applications such as
Magnetic resonance imaging (MRI) and
Electroencephalography (EEG).
Scope for Future Work
In the present work combined entropy criterion of single lead ECG has been used for the detection of QRS complexes. It has been observed that the algorithm does not detect the leads in which the QRS complexes are very small in amplitude and have lesser slope. But this may not be true with QRS complexes of all the other leads of the same subject.
If the average combined entropy of all the 12-leads, recorded simultaneously, is used instead of single lead then the entropy of the lead with small QRS-complexes is outweighed. Thus, intuitively it can be said that 12-lead based algorithm can perform better than single lead approach.
REFERENCES
[1] Trahnias P. and Skordalakis E., ―Syntactic pattern recognition of the ECG,‖ IEEE Trans. on Pattern Analysis and Machine Intelligence, vol. PAMI-21, no. 7, pp. 648-657, 1990.
[2] Kohler B. U., Henning C. and Orgleister R., ―The principles of software QRS detection,‖ IEEE Eng. in Med. and Bio, pp. 42-47, 2002.
[3] Benitez D., Gaydecki P. A., Zaidi A. and Fitzpatrick A. P., ―The use of Hilbert transform in ECG signal analysis,‖ Comp. in Bio. and Med., vol. 31, pp. 399-406, 2001. Available: DOI: 10.1016/S0010-4825(01)00009-9.
[4] Chen S. W., Chen H. C. and Chan H. L., ―A real time QRS detection method based on moving-averaging incorporating with wavelet denoising,‖ Comp. Methods and Prog. in Biomed, vol. 82, pp. 187-195, 2006.
[5] Arzeno N. M., Poon C. S. and Deng Z. D., ―Quantitative analysis of QRS detection algorithms based on first derivative of the ECG,‖ Paper proceeding at 28th IEEE EMBS annual international conference, New York, USA, pp. 1788-1791, 2006.
[6] Mehta S. S., Bansal S. K. and Lingayat N. S., ―Application of Genetic Algorithm for ECG Pattern recognition,‖ UGC National Conference on Advances in Computer Integrated Manufacturing (NCACIM), Jodhpur, India, pp. 36-40, 2007.
[7] Chouhan V. S. and Mehta S. S., ―Detection of QRS-complexes in 12-lead ECG using adaptive quantized threshold, International Journal of Computer Science and Network security,‖ vol. 8, no. 1, p. 155-163, 2008.
[8] Arbateni K. and Bennia A., ―Sigmoidal radial basis function ANN for QRS complex detection,‖ Neurocomputing, vol. 145, pp. 438-450, Dec. 5, 2014.
[9] Sharma L. D. and Sunkaria R. K., ―A robust QRS detection using novel pre-processing techniques and kurtosis based enhanced efficiency,‖ Measurement, vol. 87, pp. 194-204, June 2016. [10] Chen C.-L. and Chuang C.-T., “A QRS Detection and R Point
Recognition Method for Wearable Single-Lead ECG Devices,‖ Sensors, vol. 17, no. 9, 2017, Available: DOI: 10.3390/s17091969. [11] Willems J. L., Arnaud P., Bemmel J. H. V., Bourdillon P. J., Degam
R., Denis B., Graham I., Harms M. A., Mcfarlane P. W., Mazzacca G., Meyer J. and Zywietz C., ―Establishment of a reference library for evaluating computer ECG programs,‖ Computers in Biomedical research, vol. 18, pp. 439-457, 1985.
[12] Willems J. L. et al., ―Common Standards for Quantitative Electrocardiography: Goals and main results,‖ Meth Inform. Med., vol. 29, pp. 263-271, 1990.
[13] Kanungo Tapas, Mount David M., Netanyahu Nathan S., Piatko Christine D., Silverman Ruth and Wu Angela Y., ―An Efficient K-Means Clustering Algorithm: Analysis and Implementation‖, IEEE Transactions On Pattern Analysis And Machine Intelligence, vol. 24, no. 7, July 2002.
[14] Mehta S.S. , Shete D.A. , Lingayat N.S. and Chouhan V.S., ―K-means algorithm for the detection and delineation of QRS-complexes in Electrocardiogram‖, IRBM, vol. 31, pp. 48–54, 2010. [15] Furno G. S. and Tompkins W. J., ―A learning filter for removing
noise interference,‖ IEEE Trans. Biomed. Eng., vol. 30, pp. 234, 1983.
[16] Alste Van J.A. and Achilder T.S., ―Removal of baseline wander and power line interference from the ECG by an efficient FIR filter with a reduced number of taps,‖ IEEE Trans. Biomed. Eng., vol. 32, pp. 1052-1059, 1985.
[17] J.L. Tou and R.C. Gonzalez, ―Pattern Recognition Principles‖, Addison-Wesley Publishing Company, MA, 1974.
[18] ANSI/AAMI EC57: Testing and reporting performance results of cardiac rhythm and ST segment measurement algorithms (AAMI recommended Practice/American National Standard), 1998. Available: http//www.aami.org, Order Code: EC57-293.
[19] Mehta S. S., Shete D. A. and Lingayat N. S., ―ECG pattern recognition using k-means algorithm,‖ Proceeding of International conference on recent application of soft computing in engineering and technology, Institute of Engineering and Technology, Alwar, India, pp. 770-774, Dec 22-23, 2007.
[20] Kyrkos A., Giakoumakis E. A. and Carayannis G., ―QRS detection through time recursive prediction technique,‖ Signal Processing, vol. 15, pp. 29-436, 1988.
[21] Trahanias P. E. and Skordalalkis E., ―Bottom up approach to the ECG pattern recognition problem,‖ Med Bio eng. and Comp., vol. 27, pp. 221-229, 1989.