Development and Validation of a Simple, Sensitive and
Selective RP-HPLC Method for the Quantitative
Determination of Ritonavir in Bulk and Pharmaceutical
Formulation
Jyothsna Modugula*1, N.Kumar D.B2, Marry Prasanthi Maram3, Venkata Seshagiri Podili4, krishnaveni kamepalli5. 1
Department of pharmaceutical Analysis, SIMS College of Pharmacy, Mangaldas nagar-522001, Guntur, Andhra Pradesh, India.
2
Junior Manager, Syngene International Limited, Bommasandra-Jigani link road, Bangalore-560099. 3
Masters of public health, La Trobe University, City campus, 360 Collins Street, Melbourne, Victoria-3000, Australia.
4
Department of Pharmacology, St. Xavier Institute of Pharmacy, Phirangipuram, Guntur, Andhra Pradesh, India.
5
Department of Pharmaceutical Chemistry, St. Xavier Institute of Pharmacy, Phirangipuram, Guntur, Andhra Pradesh, India.
Email id: [email protected]
Abstract: A simple, economic, selective and precise RP-HPLC method has been developed and validated for Ritonavir in bulk and Pharmaceutical formulation. The isocratic LC analysis was performed on Inertsil BDS C18 column (250 mm x 4.6 mm, 5 µ) using mobile phase composed of Methanol and Acetate buffer pH 4.0 (55:45 v/v) at a flow rate of 1.0 ml/min. Quantitation was performed using UV detector at 261 nm. The retention time was found to be 4.521min. The analytical method was validated according to ICH guidelines. The linearity was observed in the range of 20-60 µg/ml with correlation coefficient (r2) is 0.999 for Ritonavir. The % recovery was found to be 100.10 - 100.71 %. The relative standard deviation values for repeatability and intermediate precision studies were less than 2%. The proposed method was precise, rapid, accurate, and cost-effective and can be used for the routine estimation for Ritonavir in bulk and pharmaceutical formulation.
Index Terms: Ritonavir,ICH guidelines, pharmaceutical formulation, RP-HPLC
1. INTRODUCTION
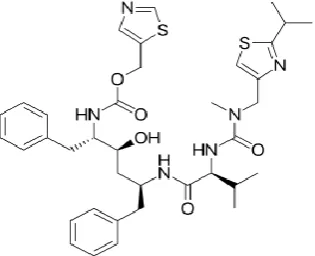
Ritonavir belongs to the class of organic compounds known as n-carbamoyl-alpha aminoacids and derivatives. These are compounds containing an alpha amino acid (or a derivative thereof) which bears and carbamoyl group at its terminal nitrogen atom [1].
Ritonavir structure- activity studies states that it is a protease inhibitor with activity against Human Immunodeficiency Virus Type 1 (HIV-1). Protease inhibitors block the part of HIV called protease [2].
[image:1.595.220.378.582.710.2]HIV-1 protease is an enzyme required for the proteolytic cleavage of the viral polyprotein precursors into the individual functional proteins found in infectious HIV-1[1]. Ritonavir binds to the protease active site and inhibits the activity of the enzyme. This inhibition prevents cleavage of the viral polyproteins resulting in the formation of immature non-infectious viral particles. Protease inhibitors are almost always used in combination with at least two other anti-HIV drugs. [3]
Fig 1. Structure of Ritonavir
HPLC –Waters Model NO.2690/5 series Compact System Consisting of Inertsil-C18 BDS column.
Electronic balance (SARTORIOUS)
Sonicator( FAST CLEAN)
2.2. Chemicals
Methanol HPLC Grade.
Sodium acetate, ammonium acetate and Glacial acetic acid were Analytical reagent grade.
2.3. Raw Material
Ritonavir and Lopinavir Working Standards obtained from local market.
2.4. Preparation of Solutions 2.4.1.Mobile Phase
Degassed Methanol and Acetate buffer pH 4.4 in the ratio of 55:45 V/V.
2.4.2. Preparation of Acetate buffer solution pH 4.4 Dissolve 136 g of sodium acetate and 77 g of ammonium acetate in water and dilute to 1000.0 mL with the same solvent; add 250.0 mL of glacial acetic acid and mix.
2.4.3. Preparation of standard solution
The solution was prepared by dissolving 25.0 mg of accurately weighed Ritonavir in 100.0 mL of volumetric flask and add mobile phase then
sonicate for 20min. From the above solutions take 10.0 mL of each solution into a 50.0 mL volumetric flask and then make up with mobile phase. The stock solutions equivalent to 50µg was prepared and filtered through 0.45µ membrane.
2.4.4. Preparation of sample drug solution for pharmaceutical formulations
Twenty tablets were weighed accurately and a quantity of tablet powder equivalent to 25 mg was weighed and dissolved in the 30 mL mobile phase and sonicate for 10 min. The content was diluted to 100 mL with mobile phase. This solution was filtered through a 0.45 µm Nylon syringe filter and 10.0 mL of the filtrate was diluted into a 50.0 mL volumetric flask to give a test solution containing 50 µg/mL of Ritonavir.
2.5. Detection of Wavelength maximum
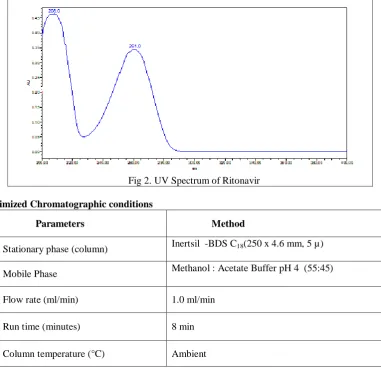
[image:2.595.107.489.395.764.2]The sensitivity of method depends on UV detection and the proper selection of wavelength is that gives maximum absorbance and good response for the given drug. In setting up the conditions for development of the assay method, the choice of the detection wavelength was based on the scanned absorption spectrum. The UV-spectrum of Ritonavir was scanned in the wavelength range of 200-400 nm against blank. From the spectrum 261nm wavelength was selected for the analysis.
Fig 2. UV Spectrum of Ritonavir
2.6. Optimized Chromatographic conditions
Parameters Method
Stationary phase (column) Inertsil -BDS C18(250 x 4.6 mm, 5 µ)
Mobile Phase Methanol : Acetate Buffer pH 4 (55:45)
Flow rate (ml/min) 1.0 ml/min
Run time (minutes) 8 min
Volume of injection loop (l) 20
Detection wavelength (nm)
261nm
Drug RT (min) 4.521min
3. RESULTS AND DISCUSSION 3.1. Method Development
Trials were done to develop a RP-HPLC method which was able to separate and quantify the Ritonavir in short time with an adequate sensitivity and selectivity. So as to achieve the good peak symmetry, various parameters like choice of mobile phase, its composition, flow rate and detection wavelength were considered during optimization of method. During trials with different columns, it was observed that Inertsil-BDS C18 (250 x 4.6 mm, 5 µ) gave good results
(good symmetric and sharp peak) [4,5]. Hence the
same column is used in the analysis. Different mobile phases in different ratios, different flow rate and different pH were tried. Finally methanol and Acetate buffer PH 4.0 in the ratio of (55:45v/v) with a flow rate of 1 ml/min was selected as mobile phase and these chromatographic conditions provided less analysis time, good peak response and good peak symmetric[6,7]. The sensitivity of the method was good at a wavelength of 261 nm. Therefore the same wavelength was selected as analytical wavelength. The chromatogram of Ritonavir after optimization is given in fig. 3.
Fig 3. Standard Chromatogram for Ritonavir
3.2. Method validation
The validity of method was tested by determining the validation parameters according to the Instructions given by ICH guidelines for method validation. [8,9]
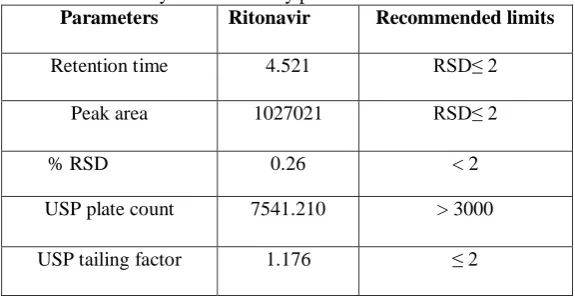
3.2.1. System suitability:
A Standard solution was prepared by using Ritonavir working standard as per test method and was injected Five times into the HPLC system The system suitability parameters were evaluated from standard chromatograms by calculating the % RSD retention times and peak areas for five replicate injections of Ritonavir.
[image:3.595.94.498.71.143.2] [image:3.595.130.510.324.490.2] [image:3.595.154.442.627.776.2]
Table 1. System Suitability parameters for Ritonavir
Parameters Ritonavir Recommended limits
Retention time 4.521 RSD≤ 2
Peak area 1027021 RSD≤ 2
% RSD 0.26 < 2
USP plate count 7541.210 > 3000
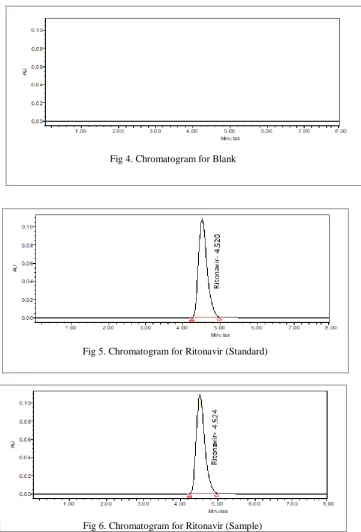
3.2.2. Specificity:
Specificity was carried out to determine the interference of any other peaks like impurity peaks or reagent peaks etc. at the retention time of analytical peak. Solutions of standard and samples were prepared as per the test method and are injected into chromatographic systems. The
chromatogram of Standard and Sample shows identical retention time and blank injection was performed and there is no interference of blank reagents at the retention time of sample as shown in fig 4-6.
Fig 4. Chromatogram for Blank
[image:4.595.129.491.169.702.2]
Fig 5. Chromatogram for Ritonavir (Standard)
Fig 6. Chromatogram for Ritonavir (Sample)
3.2.3. Precision
Precision is the degree of agreement among individual results. The entire procedure should be applied repeatedly to separate, identical samples
drawn from the same homogeneous batch of material. [10]
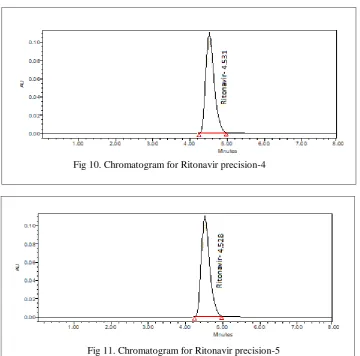
same homogenous sample was injected for five times. Measure the peak area and % assay for each injection. %RSD for peak area and % assay was found to be 0.225 and 0.45 respectively. The chromatograms were shown in fig 7-11.
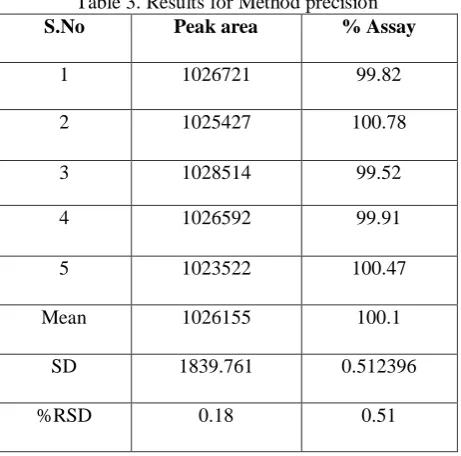
b. Method precision: Prepared five sample preparations individually as per test
method and injected each solution. Measure the peak area and % assay for each injection. %RSD for peak area and % assay was found to be 0.18 and 0.51 respectively Test results are showing that the test method is precise. Refer tables 2 and 3 for system precision and for method precision.
Fig 7. Chromatogram for Ritonavir precision-1
Fig 8. Chromatogram for Ritonavir precision-2
Fig 10. Chromatogram for Ritonavir precision-4
Fig 11. Chromatogram for Ritonavir precision-5
[image:6.595.140.501.64.420.2] [image:6.595.185.414.452.676.2]
Table 2. Results for System precision
S.No Peak area % Assay
1 1027021 99.52
2 1022421 100.12
3 1027542 100.52
4 1025120 99.65
5 1028124 99.47
Mean 1026046 99.86
SD 2318.665 0.451365
%RSD 0.225 0.45
Table 3. Results for Method precision
S.No Peak area % Assay
1 1026721 99.82
2 1025427 100.78
3 1028514 99.52
4 1026592 99.91
5 1023522 100.47
Mean 1026155 100.1
SD 1839.761 0.512396
%RSD 0.18 0.51
3.2.3.1. Intermediate precision (analyst to analyst variability)
Intermediate precision is also known as ruggedness. This was performed by two analysts as per test method. The standard solution was injected for five times and the individual assays were
calculated for both Ritonavir and Lopinavir. It should be not less than 98% and not more than 102% and %RSD of assays should be NMT2.0% by both analysts. Individual % assays and %RSD of assay are calculated and tabulated in table: 4
[image:7.595.184.415.399.626.2]
Table 4. Results for Intermediate precision
S.No Peak area % Assay
1 1031721 100.82
2 1029447 100.18
3 1028554 99.67
4 1025214 99.95
5 1028522 100.17
Mean 1028692 100.16
SD 2339.3 0.424347
%RSD 0.23 0.42
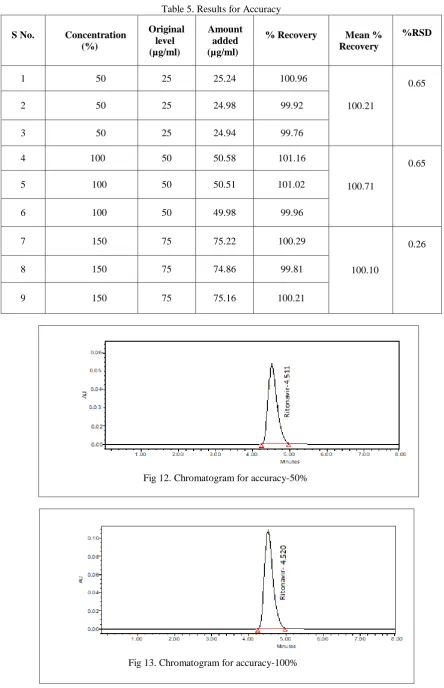
3.2.4. Accuracy (Recovery)
Accuracy of the method was performed by using standard addition method. This method was conducted by prepared triplicate solutions as per the test method with equivalent amount of Ritonavir and spike the solution to get the
concentration equivalent to 50%, 100%, and 150% of the labelled amount as per the test method. The average % recovery was calculated and tabulated in Table-5 and the chromatograms were shown in figure 12-14.
Table 5. Results for Accuracy
S No. Concentration (%)
Original level (µg/ml)
Amount added (µg/ml)
% Recovery Mean % Recovery
%RSD
1 50 25 25.24 100.96
100.21
0.65
2 50 25 24.98 99.92
3 50 25 24.94 99.76
4 100 50 50.58 101.16
100.71
0.65
5 100 50 50.51 101.02
6 100 50 49.98 99.96
7 150 75 75.22 100.29
100.10
0.26
8 150 75 74.86 99.81
9 150 75 75.16 100.21
Fig 12. Chromatogram for accuracy-50%
Fig 14. Chromatogram for accuracy-150%
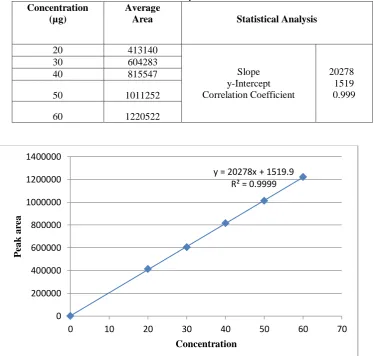
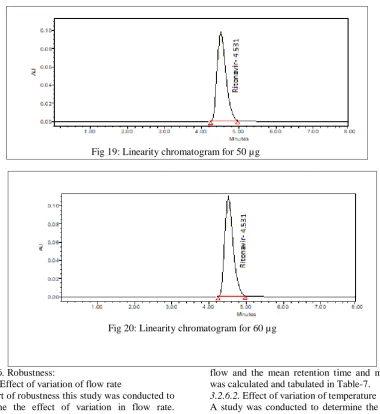
3.2.5. Linearity
Linearity was performed by preparing a series of concentrations (20ppm to 60ppm) by using Ritonavir working standard. Each concentration was injected into chromatographic system and measures the peak area response of solutions. The graph was plotted by taking concentration of the
drug on x-axis and peak area on y-axis. The correlation coefficient was found to be 0.999 which shows an excellent correlation existed between absorbance and concentration of the drug within the concentration range tested. The linearity plot was shown in the fig 15-20 and the results were tabulated in Table-6
Table 6. Results for Linearity
Concentration (µg)
Average
Area Statistical Analysis
20 413140
Slope y-Intercept Correlation Coefficient
20278 1519 0.999
30 604283
40 815547
50 1011252
60 1220522
Fig 15. Linearity plot for Ritonavir
y = 20278x + 1519.9 R² = 0.9999
0 200000 400000 600000 800000 1000000 1200000 1400000
0 10 20 30 40 50 60 70
P
eak
ar
ea
[image:9.595.131.506.375.731.2]Fig 16. Linearity chromatogram for 20 µg
Fig 17: Linearity chromatogram for 30 µg
Fig 19: Linearity chromatogram for 50 µg
Fig 20: Linearity chromatogram for 60 µg
3.2.6. Robustness:
3.2.6.1. Effect of variation of flow rate
As a part of robustness this study was conducted to determine the effect of variation in flow rate. Standard solution prepared as per the test method was injected into the HPLC system by varying the flow rates at 0.8ml/min and1.2ml/min. The system suitability parameters were evaluated and found to be within the limits for 0.8ml/min and 1.2ml/min
flow and the mean retention time and mean area was calculated and tabulated in Table-7.
3.2.6.2. Effect of variation of temperature
A study was conducted to determine the effect of variation in temperature on the developed method. The sample solution was prepared and injected at 25º±2C temperature and the retention times were comparable and the results were tabulated in Table-7.
Table 7. Results for Robustness
Parameter Adjusted to
System suitability parameters
Mean area Mean RT %RSD Ritonavir
Flow rate(ml/min) 1.0-0.2 1029447 4.514 0.81
1.0+0.2 1023512 4.421 0.35
Temperature (ºC) 25+2.0 1022544 4.152 0.48
25-2.0 1023654 4.418 0.56
4. SUMMARY AND CONCLUSION
In the present investigation, a simple, sensitive, precise and accurate RP-HPLC method was developed for the quantitative estimation of Valsartan and Hydrochlorothiazide in bulk and Pharmaceutical dosage forms.
The advantage of the developed method lies in the simplicity of the solution preparation and the method was accurate (100.10 - 100.71 %.), precise (%RSD=0.45), linear (20 to 60µg/ml) and
[image:11.595.97.510.546.658.2]It can be concluded that the proposed method can be used for the routine analysis for the RP-HPLC method development and validation for the estimation of Valsartan and Hydrochlorothiazide in bulk and Pharmaceutical dosage forms
REFERENCES
[1] Ashish Chandwani and Jonathan Shuter. (2008): Lopinavir/ritonavir in the treatment of HIV-1 infection: a review. Ther Clin Risk Manag, 4(5), pp. 1023–1033.
[2] Dale j, Kempf, Hing L et al. (1998): Discovery of Ritonavir, a Potent Inhibitor of HIV Protease with High Oral Bioavailability and Clinical Efficacy. Journal of Medicinal Chemistry, 41(4), pp. 602-617.
[3] Robert K, Zeldin Richard A and Petruschke. (2004): Pharmacological and therapeutic properties of ritonavir-boosted protease inhibitor therapy in HIV-infected patients. Journal of Antimicrobial Chemotherapy, 53(1), pp. 4–9.
[4] Chiranjeevi and Channabasavaraj k.p. (2011): Development and Validation of RP-HPLC method for Quantitative Estimation of Ritonavir in Bulk and Pharmaceutical dosage forms. International Journal of Pharmaceutical Sciences and Research, 2(3), pp. 596-600 [5] Anindita Behera, Swapan Kumar
Moitra, Sudam Chandra Si, Amit Kumar Meher. (2011). Method development, validation and stability study of ritonavir in bulk and pharmaceutical dosage form by spectrophotometric method. Chronicles of Young Scientists, 2(3), pp.161-167.
[6] Usami Y, Oki T, Nakai M, Sagisaka M, Kaneda T. (2003). A simple HPLC method for simultaneous determination of lopinavir, ritonavir and efavirenz.Chem Pharm Bull, 51(6), pp. 715-718.
[7] Santosh V. Gandhi and Rasika R. Korhale. (2016). A RP-HPLC Method Development and Validation for the Estimation of Ritonavir in Bulk and Pharmaceutical Dosage Form. Journal of Chemical and Pharmaceutical Research. 8(7), pp. 901-904
[8] International conference on the
harmonization. ICH Harmonized Tripartite Guideline. Stability Testing of New Drug
Substances and Products Q1A (R2), 2003. [9] International conference on the
harmonization. ICH Harmonized Tripartite Guideline. Validation of Analytical Procedures: Text and Methodology Q2 (R1), 2005.