A Modified Real-Valued Feed-Forward Neural Network Low-Pass
Equivalent Behavioral Model for RF Power Amplifiers
Luiza B. Chipansky Freire, Caroline de Fran¸ca, and Eduardo G. de Lima*
Abstract—This work addresses the low-pass equivalent behavioral modeling of radio frequency (RF) power amplifiers (PAs) for modern wireless communication systems. Similar to a previous approach, here the PA behavioral modeling is based on two independent real-valued feed-forward artificial neural networks (ANNs). A careful analysis is first presented to show that the nonlinear training algorithm for the previous ANN-based approach can be easily trapped into local minima, especially for the ANN that estimates the polar angle component of a complex-valued signal. Then, a modified ANN-based model is proposed to eliminate the local minimum problem, in this way significantly improving the modeling accuracy. Indeed, in the proposed model the two real-valued ANNs are responsible for estimating the in-phase and quadrature components of a complex-valued base-band signal. When applied to the behavioral modeling of a GaN HEMT class AB PA, the proposed ANN-based model reduces normalized mean-square error (NMSE) by up to 2.2 dB, in comparison with the previous ANN-based model having an equal number of network parameters.
1. INTRODUCTION
Linearity is an obligatory requirement in modern cellular systems [1]. Indeed, the providers of cellular services can only comply with the agreed high data rates and acceptable levels of quality if rigorous linearity specifications are completely satisfied. The frequency spectrum is shared among a large set of completely different applications, and therefore, the bandwidth allocated to cellular systems is very narrow. In this context, a fundamental concern is the adoption of a strategy to allow for an efficient use of the bandwidth, in the sense of achieving higher data rates in the fixed available bandwidth. Actually, a significant augment in the rate of data transmission is possible if, besides the phase, the amplitude of a radio frequency (RF) carrier signal is also allowed to be changed as a function of the information signal [2]. However, an amplitude modulated RF carrier demands for linearity. While the information signal preserves its bandwidth when applied to a linear operator, the same is not true when it is subject to a nonlinear operator. This is because nonlinear operators can give rise to non-negligible contributions at frequencies not excited by the applied input information signal. As a consequence, the bandwidth of an amplitude modulated RF carrier signal can be widened after the signal is processed thought any nonlinearity. The bandwidth widening dramatically deteriorates the system quality because neighbor users will interfere with each other.
The traditional design of highly linear wireless transmitters critically impacts the overall power efficiency of the system [3]. In particular, power amplifiers (PAs) based on semiconductor transistors polarized in class A, AB or B are linear only when driven at lower power levels. On the other hand, to optimize its power efficiency, the PA must operate near its maximum power, at strong gain compression, producing non-negligible nonlinear distortions. Therefore, to comply with the linearity requirements,
Received 28 February 2015, Accepted 9 April 2015, Scheduled 17 April 2015 * Corresponding author: Eduardo Gon¸calves de Lima ([email protected]).
the PA efficiency is very poor. This has serious consequences, especially because the PA is the circuit that consumes the largest amount of energy in the wireless communication system. Thus, a lot of effort is been pushed toward high efficiency, especially for extending the battery autonomy in handsets and relaxing the demand for heat dissipation in base-stations [4, 5].
To obtain high efficiency at the same time keeping the linearity within mandatory thresholds, a common approach is to include, in the transmitter chain, a linearization scheme known in literature as digital base-band predistortion (DPD) [6]. An accurate model for the PA, which relates complex-valued envelope signals and is capable of predicting nonlinear dynamic behaviors observed in PAs with reduced computational cost, is essential to designing a DPD that works properly [7–13]. A real-valued feed-forward artificial neural network (ANN), when excited by the same complex-valued envelope signal applied to the PA input and after proper supervised training, can mimic the PA dynamic nonlinear behaviors and, in this way, generate a complex-valued envelope signal very close to the measured PA output signal [10].
In literature, great efforts have been spent to obtain more accurate predictions for the PA complex-valued output envelope based on real-complex-valued ANNs with fewer network parameters (weights and biases) [10–13]. For such purpose, the strategy followed in [10–12] was to change the real-valued signals applied as ANN inputs. In fact, for applying real-valued ANNs to the low-pass equivalent PA behavioral modeling, complex-valued signals must be first transformed into real-valued signals to only then be applied to the ANN inputs. In particular, a decomposition based on amplitude and phase difference components [12] was reported to produce a better compromise than the traditional Cartesian [10] and polar [11] decompositions. Additionally, [13] reported the advantages of using two independent ANNs (of single output) with respect to the use of a unique ANN having two outputs. Moreover, for applying real-valued ANNs to the low-pass equivalent PA behavioral modeling, real-valued signals at the ANN outputs must be somehow combined to obtain a complex-valued estimation. However, the impacts on modeling accuracy of constructing one complex-valued signal from two real-valued signals estimated by the ANNs were not investigated in [10–13]. The novelties of this work are the following. First, it identifies the main impacts that the choice for the mapping from two real-valued to one complex-valued signals can have on modeling accuracy. Second, it is observed that the choices for such mapping made by previous approaches can critically affect the modeling accuracy because the ANN training algorithm can be easily trapped into local minima. Third, it proposes an alternative mapping that has the advantage of turning the ANN training algorithm less susceptible to the local minimum problem, and therefore, can produce a better trade-off between modeling accuracy and computational complexity. In other words, here a novel strategy is adopted to further improve the modeling accuracy of feed-forward ANNs. Specifically, the main contribution of this work is to propose a behavioral model that differs from the previous approach of [13] by the real-valued signals that must be estimated by the ANNs. In fact, in the proposed model, the ANNs are trained to estimate the real and imaginary parts of a complex-valued base-band signal.
This work is organized as follows. Section 2 describes low-pass equivalent PA behavioral modeling, and Section 3 briefly reviews feed-forward ANNs. Section 4 introduces the modified ANN-based model, and its advantages over previous approaches are carefully investigated, with particular attention to the local minima problem in the ANN training algorithm. Experimental data reported in Section 5 show that a better trade-off between model fidelity and number of network parameters is achieved by the novel approach. Conclusions are given in Section 6.
2. LOW-PASS EQUIVALENT POWER AMPLIFIER BEHAVIORAL MODELING
Let a PA be excited by the band-pass signal:
the PA output can be accurately written as:
y =[˜yexp (jωCt)] =aycos (ωCt+θy), (2) where ˜y is the complex-valued output envelope signal, ay the amplitude component of ˜y, and θy the polar angle component of ˜y. The nonlinear intermodulation distortions introduced by the PA are not attenuated by the output matching network and can be clearly observed in measurements performed at the PA output. Therefore, an accurate PA behavioral model has to map the output signal as a nonlinear function of the input signal. Additionally, non-ideal frequency responses of the bias circuit and the input and output matching networks give rise to dynamic effects that have a significant impact on the measured signal at the PA output [7]. In order to take into account dynamic effects, a non-recursive discrete-time model must calculate the PA output signal at the instantaneous time sample as a function of the PA input signal at instantaneous and previous time samples. Two different PA behavioral models are available, differing from each other by the kind of input and output signals handled by them [7]. In a band-pass model, the band-pass output at the instantaneous time sample (n) is given by:
y(n) =fBP[x(n), x(n−1), . . . , x(n−MBP)], (3) where fBP indicates an arbitrary band-pass nonlinear operator, and MBP is the number of previous samples required by the band-pass model. In a low-pass equivalent model, the complex-valued envelope output at the instantaneous time sample (n) is computed using:
˜
y(n) =fLPE[˜x(n),x˜(n−1), . . . ,x˜(n−MLPE)], (4) where fLPE indicates an arbitrary low-pass equivalent nonlinear operator and MLPE the number of previous samples required by the low-pass equivalent model. Observe that a band-pass model describes the relationship between the band-pass signals x and y, while in a low-pass equivalent model only the relation between ˜x and ˜y is obtained.
3. REAL-VALUED FEED-FORWARD NEURAL NETWORKS
Figures 1(a) and 1(b) show the block diagrams of the two largely employed real-valued feed-forward artificial neural networks: the three-layer perceptron (TLP) and the radial-basis function (RBF) [16]. Observe that in Figures 1(a) and 1(b), the networks have E inputs, S outputs and R neurons in the hidden layer. 1 u R I b 1 in 1 out 2 u R u 2 in E in 1 I b 1,1 w 2,2 w R,E w 2,1 w R,1 w 1,E w w2,E
1,2 w
R,2
w
Hidden Layer Output Layer Input Layer 1 z 2 z R
z outS
2 out S O b 1,1 h 2,2 h S,R h 2,1 h S,1 h 1,R h h2,R
1,2 h S,2 h 1 O b 2 I
b b2O
NL F NL F NL F 1 in 2 in 1,1 w 2,2 w R,E w 1,2 w 1,E w 2,E w 2,1 w R,2 w Hidden Layer Input Layer R,1 w 1 out Output Layer S out 2 out S O b 1,1 h 2,2 h S,R h 2,1 h S,1 h 1,R h 2,R h 1,2 h S,2 h 1 O b 2 O b E in 1 u 2 u 2 2 2 R u 1 I b 2 I b R I b R z 2 z 1 z NL F NL F NL F (a) (b) ... ... ... ... ... ... ... ... ... ... ... ... ... ... ...
Figure 1. Block diagram of neural networks: (a) three-layer perceptron and (b) radial basis function.
A major difference between a TLP and an RBF is observed in the input layer, whereas the TLP input signals are manipulated by
ur =bIr+ E
e=1
wr,eine, (5)
the RBF input signals are modified according to
ur=bIr
E
e=1
(ine−wr,e)2. (6)
In (5) and (6),wr,e (withr = 1,2, . . . , R ande= 1,2, . . . , E) are the input weights, andbIr (with
r = 1,2, . . . , R) are the input biases. In the hidden layer, each signal ur (with r = 1,2, . . . , R) is applied to a nonlinear operator FNL. Indeed, the hyperbolic tangent sigmoid function
zr=FNL(ur) =
2
1 + exp (−2ur) −1, (7)
is the common choice for TLP-based networks, while the Gaussian function
zr =FNL(ur) = exp
−u2 r
, (8)
is more commonly found in RBF-based networks.
The output layer is exactly the same for both TLP and RBF. For instance, theS network outputs (out1,out2, . . . , outS) are given by:
outs=bOs +
R
r=1
hs,rzr, (9)
where hs,r (with r = 1,2, . . . , R and s = 1,2, . . . , S) are the output weights, and bOs (with
s= 1,2, . . . , S) are the output biases.
4. THEORETICAL DEVELOPMENT
Low-pass equivalent PA behavioral models discussed in Section 2 relate complex-valued envelope signals. Feed-forward ANNs addressed in Section 3 can only process real-valued signals. Therefore, in order to apply real-valued ANNs to the low-pass equivalent PA behavioral modeling, complex-valued signals must be first transformed into valued signals to only then be applied to the ANN inputs. Moreover, real-valued signals at the ANN outputs must be somehow combined to obtain a complex-real-valued estimation for the output envelope.
In [12], it was observed that the conversion from complex-valued into real-valued signals has a significant impact on the accuracy and computational complexity of a low-pass equivalent model. Traditionally, a complex-valued input envelope ˜x can be decomposed into amplitude (ax) and polar angle (θx) components, according to
˜
x=axexp (jθx), (10)
or, equivalently, into real (x) and imaginary (x) parts,
˜
x=x+jx, (11)
where x = axcos(θx) and x = axsin(θx). If the rectangular (10) or polar (11) decompositions are employed to obtain the ANN real-valued inputs, out-of-band contributions are generated by the low-pass equivalent model. However, according to Section 2, a computationally efficient low-low-pass equivalent behavioral model must generate only in-band contributions. Once the polar angle component θx is related to the carrier frequencyωC by (ωCt+θx), in order to preserve the 1ωCt, theθxcannot be directly applied as an ANN input. In fact, ifθx is used as an ANN input, nonlinear activation functions in the hidden layer of an ANN can change the value of the integer number that multiplies ωC. Furthermore, the real (x) and imaginary (x) components cannot be directly applied as ANN inputs, once they are also dependent onθx. Therefore, only the amplitude (ax) component can be directly applied as an ANN input, becauseax is independent from θx, in this way having no relationship withωC. To compensate for memory effects, in [12] the instantaneous (n) and previous (up to the memory lengthM) samples of the input amplitude are applied as ANN inputs, e.g.,ax(n−m), withm from 0 toM. However, applying only amplitude components as ANN inputs severely deteriorates the modeling accuracy [12]. In other words, the ANN inputs must somehow sense the present and past samples of θx in order to provide accurate predictions of to-amplitude-modulation (PM-AM) and phase-modulation-to-phase-modulation (PM-PM) conversions. The strategy introduced in [12] was to purposely modify the polar angle components prior to their application as ANN inputs, in a way that their relationship withωC is completely eliminated. For that purpose, the difference between polar angle components at two consecutive time instants was first calculated, then the sine and cosine were evaluated, and finally, the resulting values, at instantaneous and past samples were applied as independent ANN inputs, e.g., sin[θx(n−m1)−θx(n−m1−1)] and cos[θx(n−m1)−θx(n−m1−1)], withm1 from 0 to (M+ 1).
By using the ANN inputs introduced in [12], independent of the ANN architecture (TLP or RBF), only real-valued base-band (0ωCt) signals are available at the ANN outputs. Therefore, additional computations must be performed to estimate the complex-valued in-band (1ωCt) envelope signal at the PA output. Indeed, the real-valued ANN estimations have to be first condensed into a single complex-valued base-band signal. Then, a complex-complex-valued base-band signal (centered at zero frequency) must be shifted in frequency to the in-band (centered atωC). According to [12], the frequency shifting operation can be done by
˜
y= ˜sexp (jθx), (12)
where ˜sis a complex-valued base-band signal centered at zero frequency,θx the polar angle component of the complex-valued input envelope, and ˜y the complex-valued in-band output envelope. Concerning the conversion from real-valued into complex-valued signals, in [12] a polar decomposition was adopted. In particular, the two real-valued outputs (as and θs) of a single ANN are assumed as the amplitude and polar angle components of the base-band complex-valued signal ˜s, according to:
˜
s=asexp (jθs). (13)
(a) (b)
0 0.2 0.4 0.6
a (V)x
Theta (rad)
S
0 0.2 0.4 0.6
0 0.1 0.2 0.3 0.4 0.5
a (V)x
a
(V)
s
- 0.8 -0.6 -0.4 - 0.2 0 0.2 0.4 0.6
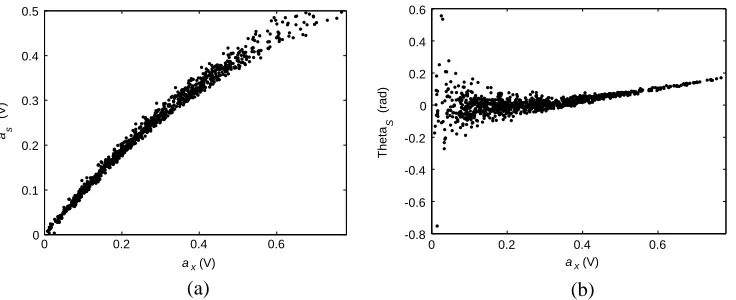
Figure 2. Nonlinear transfer characteristics measured on a GaN HEMT class AB PA excited by a WCDMA signal: (a) amplitude of ˜sas a function of the instantaneous input amplitude, (b) polar angle of ˜sas a function of the instantaneous input amplitude.
by two independent ANNs. In fact, it was observed in [13] that the use of ANNs having single output provides a better trade-off between modeling error and number of network parameters. Nevertheless, in [12, 13], the impact of the conversion from real-valued into complex-valued signals on the accuracy and computational complexity of a low-pass equivalent model was not addressed. In fact, the choice for polar decomposition in the conversion from real-valued to complex-valued signals has no connection with the fulfillment of the band-pass constraint.
Now, it is investigated whether the conversion from two real-valued signals into one complex-valued, performed over the ANN outputs, has any effect on the accuracy and computational complexity of a model. The polar decomposition applied in [12, 13] is first investigated. To that purpose, based on data measured on a GaN HEMT class AB PA excited by a WCDMA signal, Figures 2(a) and 2(b) show the amplitude (as) and polar angle (θs) components of the base-band complex-valued signal ˜s, respectively, as a function of the amplitude (ax) of the input envelope.
The nonlinear transfer characteristics shown in Figure 2 are, indeed, the nonlinear mappings that each ANN of [13] is intended to mimic. Observe that a single value of the instantaneous input amplitude produces different outputs at distinct time instants. The scattering pattern indicates that the nonlinear mappings are not static, in this way clearly illustrating the presence of memory effects. As a consequence, the instantaneous output depends either on previous samples of the input amplitude (dynamic AM-AM and AM-AM-PM conversions) or on previous samples of the input polar angle (AM-AM and PM-PM conversions). From Figure 2(a), notice that for each value of the input amplitude, the vertical displacement (due to the scattering) is essentially constant at all input amplitude levels. However, from Figure 2(b), a remarkable widening of the vertical displacement is observed at very low input amplitude levels. More important, while θs achieves values not larger than 0.2 radians at high input amplitude levels, extremely large values for θs (around 0.6 radians) are observed at input amplitude levels near zero. The huge spreading inθs values at very low input amplitudes can have a catastrophic impact on the identification of the ANN weights and biases. The reasoning is as follows. In the training of an ANN, the network parameters are chosen in order to minimize the mean square error (MSE) between desired and estimated outputs, according to
MSE = 1
N N
n=1
outdess (n)−outests (n)2, (14)
Notwithstanding, the amount of θs deviations at low input amplitude levels is further accentuated by measurement noise.
In summary, the choice for polar decomposition in the conversion from two real-valued signals into one complex-valued signal done in [12, 13] can give rise to non optimal ANN training.
Now, attention is turned to the application of the Cartesian (or rectangular) decomposition to implement the transformation from two real-valued signals into one complex-valued signal. For that purpose, the base-band complex-valued signal ˜s is now constructed from two real-valued signals according to
˜
s=s+js, (15)
where s and s represent the real and imaginary parts of the complex-valued signal ˜s, respectively. Using the same data measured on a GaN HEMT class AB PA excited by a WCDMA signal, Figures 3(a) and 3(b) show the real (s) and imaginary (s) components of the base-band complex-valued signal ˜
s, respectively, as a function of the amplitude (ax) of the input envelope. Observe that the vertical displacement (due to the scattering) is approximately uniform at all input levels for the two nonlinear transfer characteristics shown in Figure 3. In other words, the huge spreading in θs values at very low input amplitudes, clearly observable in Figure 2(b), has no visible consequences on the transfer characteristics shown in Figure 3. Even thoughs and s are dependent onθs, at very low amplitude levels their values are primarily determined by the amplitude information as. Indeed,s =ascos(θs) ands=assin(θs), and the multiplication of a number close to zero by any number is still a number close to zero. Such information is highly valuable and will be exploited in the sequence for the development of a novel ANN-based low-pass equivalent model. It is worth mentioning that, although Figures 2 and 3 were obtained from a class AB PA, similar behaviors are also expected for PAs operating in different classes (A, B, C, etc.).
The ANN-based low-pass equivalent model proposed in this work is addressed. Figure 4(a) shows a block diagram of the two independent real-valued feed-forward neural network model previously introduced in [13]. A block diagram of the model proposed in this work is shown in Figure 4(b). Observe that Figure 4(b) differs from Figure 4(a) only by the real-valued signals that must be estimated by the ANNs. In particular, in the proposed model a Cartesian decomposition is used to perform the conversion from two real-valued signals into one complex-valued signal. Hence, according to Figure 4(b), one ANN estimates the instantaneous sample of the real part (s) of the base-band complex-valued signal ˜s, while another ANN estimates the instantaneous sample of the imaginary part (s) of ˜s. Based on the discussion presented in this section, it is expected that the proposed model, in comparison with the previous approach of [13] in a scenario of same number of network parameters, can provide a superior modeling accuracy. Specifically, in the proposed model there is one ANN to map the nonlinear transfer characteristic shown in Figure 3(a) and one ANN to map the nonlinear transfer characteristic shown in Figure 3(b). Therefore, the training algorithms for both ANNs of Figure 4(b) are less susceptible to be trapped into local minima than the training algorithm for the ANN that estimates θs in Figure 4(a). Finally, it is worth mentioning that the fulfillment of the band-pass constraint is guaranteed in both
(a) (b)
0 0.2 0.4 0.6 a
x (V)
Re (V)
s
0 0.2 0.4 0.6 a
x (V)
Imag (V)
s
-0.05 0 0.05 0.1
0 0.1 0.2 0.3 0.4 0.5
y(n)
(n)
s a
s z
z
−1 z
TLP/RBF
TLP/RBF x
a (n)
x a (n−M)
cos[θ x(n)−θ x(n−1)]
x
expj(.)
s(n)
expj(.) (n)
s
s z
z
z
TLP/RBF
TLP/RBF x
a (n)
x
(.)
j
(a) (b)
...
...
...
...
...
...
~ ~
−1
cos[θ x(n−M+1)−θ x(n−M)]
sin[θ x(n)−θ x(n−1)]
sin[θ x(n−M+1)−θ x(n−M)]
θ (n)
expj(.)
θ (n)
−1
−1
y(n) s(n)
~ ~
θ (n)
(n) cos[θ x(n)−θ x(n−1)]
cos[θ x(n−M+1)−θ x(n−M)]
sin[θ x(n)−θ x(n−1)]
sin[θ x(n−M+1)−θ x(n−M)] x
a (n−M)
−1
−1
Figure 4. Block diagram of ANN-based PA behavioral models: (a) previous [13] and (b) proposed.
Table 1. NMSE results in dB as a function of the number of network parameters.
Number of parameters 38 47 56 65 74 83 92 101 110 119
previous [13] −39.9 −40.6 −41.0 −41.6 −42.1 −42.5 −42.7 −43.0 −43.2 −43.3
proposed −40.8 −41.6 −42.2 −43.0 −43.8 −44.4 −44.8 −45.2 −45.3 −45.5
low-pass equivalent models shown in Figure 4. Indeed, it is the selection of ANN real-valued inputs done in Figure 4 that avoids the generation of out-of-band contributions.
5. EXPERIMENTAL VALIDATION
In this section, the accuracies of the proposed based model of Figure 4(b) and the previous ANN-based model of Figure 4(a) are compared. To that purpose, a Rohde & Schwarz FSQ vector signal analyzer (VSA) was used to measure discrete-time input-output data sampled at 61.44 MHz from a GaN HEMT class AB PA, excited by a double-carrier WCDMA signal having a bandwidth of 8.84 MHz and centered at 900 MHz, for a PA average output power of 26 dBm.
One part of the measured input-output data was used to train, by the back-propagation algorithm [16], the two ANN-based low-pass equivalent behavioral models shown in Figure 4, having the TLP architecture of Figure 1(a) with the hyperbolic tangent sigmoid activation function given by (7). The memory length was fixed in M = 2, but the number of neurons in the hidden layer of the ANNs was varied in order to change the number of network parameters.
The remaining measured input-output data was used to evaluate the normalized mean-square error (NMSE), as defined in [18], between measured and estimated complex-valued output envelopes. Figure 5 and Table 1 show the NMSE as a function of the number of network parameters. Observe that, in case of same number of network parameters, the proposed model of Figure 4(b) is more accurate than the previous approach of Figure 4(a). Indeed, the largest difference between the proposed and previous approaches, quantified by a NMSE difference of 2.2 dB, is achieved if both ANN-based models have 101 real-valued network parameters. Figure 5 and Table 1 confirm that the training algorithms for the proposed model are less susceptible to be trapped into local minima.
20 40 60 80 100 120 140 160 180 200 Number of Parameters
proposed previous
-46 -44 -42 -40 -38 -36
NMSE (dB)
Figure 5. NMSE results as a function of the number of network parameters. The GaN HEMT class AB PA is modeled by TLPs having M = 2 and a variable number of neurons in the hidden layer.
880 885 890 895 900 905 910 915 920 Frequency (MHz)
normalized in measured out estimated out
-110 -100 -90 - 80 -70 -60 -50 - 40
Power Spectral Density (dBm/Hz)
Figure 6. Power spectral densities of the measured and estimated PA output signals. The GaN HEMT class AB PA is modeled by the proposed TLP having M = 2 and 110 network parameters.
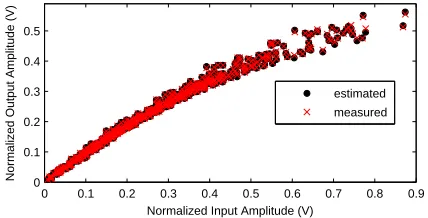
0 0.1 0.2 0.3 0.4 0.5 0.6 0.7 0.8 0.9
0 0.1 0.2 0.3 0.4 0.5
Normalized Input Amplitude (V)
Normalized Output Amplitude (V)
estimated measured
Figure 7. Measured and estimated normalized AM-AM conversions. The GaN HEMT class AB PA is modeled by the proposed TLP havingM = 2 and 110 network parameters.
0 0.1 0.2 0.3 0.4 0.5 0.6 0.7 0.8 0.9
Normalized Input Amplitude (V)
estimated measured 1.5
1
0.5
0
-0.5
Phase Di
erence (rad)
Figure 8. Measured and estimated AM-PM conversions. The GaN HEMT class AB PA is modeled by the proposed TLP havingM = 2 and 110 network parameters.
6. CONCLUSIONS
This work proposes an ANN-based low-pass equivalent PA behavioral model that can be seen as a modified version of a previous ANN-based approach. In one hand, the ANN real-valued inputs are the same in both previous and modified models in order to guarantee that only in-band contributions (centered at ωC) are generated by the low-pass equivalent PA behavioral model. On the other hand, the ANN real-valued outputs in the modified model are different from the ANN outputs in the previous approach in order to attenuate the problem of local minima in the ANN training algorithm. The higher accuracy provided by the modified model than the previous approach of same computational complexity is confirmed by a very significant reduction in modeling error, quantified by improvements in NMSE up to 2.2 dB when applied to fit data measured on a GaN HEMT class AB PA.
ACKNOWLEDGMENT
The authors would like to thank the financial support provided by Coordena¸c˜ao de Aperfei¸coamento de Pessoal de N´ıvel Superior (CAPES).
REFERENCES
2. Raab, H., P. Asbeck, S. Cripps, P. B. Kenington, Z. B. Popovic, N. Pothecary, J. F. Sevic, and N. O. Sokal, “Power amplifiers and transmitters for RF and microwave,” IEEE Trans. Microw. Theory Tech., Vol. 50, No. 3, 814–826, 2002.
3. Cripps, S., RF Power Amplifiers for Wireless Communications, Artech House, Norwood, 2006. 4. Piazzon, L., R. Giofre, P. Colantonio, and F. Giannini, “A method for designing broadband Doherty
power amplifiers,”Progress In Electromagnetics Research, Vol. 145, 319–331, 2014.
5. Kim, J. and Y. Park, “Design of a compact and broadband inverse class-F−1 power amplifier,”
Progress In Electromagnetics Research C, Vol. 46, 75–81, 2014.
6. Kenington, P. B.,High Linearity RF Amplifier Design, Artech House, Norwood, 2000.
7. Pedro, J. C. and S. A. Maas, “A comparative overview of microwave and wireless power-amplifier behavioral modeling approaches,” IEEE Trans. Microw. Theory Tech., Vol. 53, No. 4, 1150–1163, 2005.
8. Wang, H., H. Ma, and J. Chen, “A multi-status behavioral model for the elimination of electrothermal memory effect in DPD system,” Progress In Electromagnetics Research C, Vol. 47, 103–109, 2014.
9. Sun, G., C. Yu, Y. Liu, S. Li, and J. Li, “An accurate complexity-reduced simplified Volterra series for RF power amplifiers,”Progress In Electromagnetics Research C, Vol. 47, 157–166, 2014. 10. Liu, T., S. Boumaiza, and F. M. Ghannouchi, “Dynamic behavioral modeling of 3G power amplifiers
using real-valued time-delay neural networks,”IEEE Trans. Microw. Theory Tech., Vol. 52, No. 3, 1025–1033, 2004.
11. Isaksson, M., D. Wisell, and D. Ronnow, “Wide-band dynamic modeling of power amplifiers using radial-basis function neural networks,”IEEE Trans. Microw. Theory Tech., Vol. 53, No. 11, 3422– 3428, 2005.
12. Lima, E. G., T. R. Cunha, and J. C. Pedro, “A physically meaningful neural network behavioral model for wireless transmitters exhibiting PM-AM/PM-PM distortions,” IEEE Trans. Microw. Theory Tech., Vol. 59, No. 12, 3512–3521, 2011.
13. Chipansky Freire, L. B., C. de Franca, and E. G. de Lima, “Low-pass equivalent behavioral modeling of RF power amplifiers using two independent real-valued feed-forward neural networks,”Progress In Electromagnetics Research C, Vol. 52, 125–133, 2014.
14. Jeruchim, M. C., P. Balaban, and K. S. Shanmugan, Simulation of Communication Systems — Modeling, Methodology, and Techniques, Kluwer Academic/Plenum Publishers, New York, 2000. 15. Benedetto, S., E. Biglieri, and R. Daffara, “Modeling and performance evaluation of nonlinear
satellite links — A Volterra series approach,”IEEE Trans. Aerosp. Electron. Syst., Vol. 15, No. 4, 494–507, 1979.
16. Haykin, S.,Neural Networks: A Comprehensive Foundation, Prentice Hall, New Jersey, 1999. 17. Chen, S., C. F. N. Cowan, and P. M. Grant, “Orthogonal least squares learning algorithm for radial
basis function networks,” IEEE Trans. Neural Netw., Vol. 2, No. 2, 302–309, 1991.

![Figure 4. Block diagram of ANN-based PA behavioral models: (a) previous [13] and (b) proposed.](https://thumb-us.123doks.com/thumbv2/123dok_us/1934411.1254126/8.612.77.543.81.234/figure-block-diagram-based-behavioral-models-previous-proposed.webp)