Available online:
http://edupediapublications.org/journals/index.php/IJR/
P a g e | 667Location Estimation using RSS Technique of
ZigBee Module
*
W.A.F.W. Othman, C.S. Lim, S.S.N. Alhady & A.A.A. Wahab
School of Electrical & Electronic Engineering, Universiti Sains Malaysia, Malaysia
*
Corresponding author | email: [email protected]
Abstract:
The Received Signal Strength (RSS), which could be acquired at the time upon receiving a packet in most standard RF wireless sensor, could be use to estimate location for wireless device. In this paper, experiments have been conducted on Texas Instruments IEEE 802.15.4 / ZigBee CC2431 sensor module to evaluate the reliability and accuracy of using RSS approach for localization algorithm development in an indoor environment.
Keywords
Received Signal Strength, Localization, Wireless Sensor Network, ZigBee
1.
Introduction
Increment of on-field industrial and consumer wireless devices deployment has become a trend for next coming years. The ability of these wireless sensor devices to identify its own location could contribute to the development of various useful monitoring, control and location-based applications [1]. Wireless sensor devices have advantages of low cost, low power utilization and can be deployed in short period. Since signal attenuation strength is falls off with distance, the Received Signal Strength Indicator (RSSI) measured at the receiver can be use to estimate distance between transmitter. This paper studied the Received Signal Strength (RSS) empirically in indoor environment, to access the accuracy of RSS to be used in further wireless sensor nodes localization algorithm development.
The rest of the paper is organized as follow: Section 2 discusses the background and related work. Section 3 focuses on signal propagation model use in RSS measurement. Section 4 describes experiments and discussed on the result. Section 5 concludes the findings.
2.
Related Work
All wireless sensor IC chips nowadays have built-in RF signal receiving quality measurement mechanism. This major advantage provides a great opportunity for creating location-based software application without additional hardware cost.
Wireless sensor network localization measurement method typically based on Received Signal Strength (RSS), Time of Arrival (TOA), Time Difference on Arrival (TDOA), Angle of Arrival (AOA) [1, 6, 8, 13, 16] and Link Quality Indicator (LQI) [7]. RSS gain more popularity as it does not involve complex software algorithm, hence will not incur excessive MCU power consumption, memory space or bandwidth, enable the wireless sensor device to operate for long hours or months duration on battery.
The 802.11 WLAN [3, 4] and IEEE 802.15.4 / ZigBee [2, 5, 6, 7] were among the popular wireless standard used to study RSS in localization algorithm research. Stoyanova et al.[2] assessed factors that could affect RSS accuracy using the Tmote Sky ZigBee module. Multiple impact factors such as, RF operating frequencies, distance between transmitter and receiver, antenna height from ground, antenna orientation, and specific environment scenario was evaluated on RSS at outdoor environment.
Patwari et al. [1] explained that, RSS major error source, and presented statistical model for RSS, TOA, and AOA, on cooperative localization research. In an indoor environment, Elnahrawy et al. [3] presented the constraint of localization algorithm precision on WLAN standard using wireless access point.
Available online:
http://edupediapublications.org/journals/index.php/IJR/
P a g e | 668 measurement.In order to fulfill our research on swarm robotics agent localization algorithm development application scenario [17, 18], we are focusing our study on the measurement of RSS variability for distance in the range of 1 to 10 m, in an indoor environment and effect of receiver position in corresponding to transmitter.
3.
Received signal strength value
acquisition
The CC2431 IC from Texas Instruments was selected as the testing platform. CC2431 is a 2.4 GHz IEEE802.15.4 / ZigBee System-on-Chip (SoC) IC chip. The CC2431 does not publish RSS value directly. Instead, the RSS value is measured internally and published as Received Signal Strength Indicator (RSSI). After loaded in the ZigBee protocol stack (Z-Stack) from Texas Instruments to the CC2431 Evaluation Module (EM), firmware can access the value from the RSSI register in CC2431.
3.1.Signal Propagation Model
The path loss log-normal shadowing statistical model
eq. (1) is used to model distance estimation between two nodes based on the measurement RSS, which is randomness to various deployment environments and distributed characteristic.
Xd d n P dBm d
P r
0 log10 10 0 (1)Where Pr(d) is received power; P0 is the received power at a point with reference distance d0; n is the path loss exponent that measures the rate the RSS decreases with distance; Xσ is a Gaussian random variable with zero mean and standard deviation σ, which accounts for the random effect of shadowing.
For CC2431, the RSS is converted to RSSI and it is modeled based on the simplified log-normal shadowing model, as eq. (2) below.
) log10 10
( n d A
RSSI (2)
Refer eq. (2), n is path loss exponent; d is distance between transmitter and receiver; A is received signal strength at a distance of 1 meter.
The RSS is measured by CC2431 each time a packet is received and stored in RSSI register based on (2). The RSSI value read out need to be added an offset of -45 as specified in CC2431 data sheet to convert to RSS, as eq. (3) below. The offset may vary according to antenna configuration.
dBm RSSI RSSI OFFSETRSS _ (3)
4.1.Experimental Setup
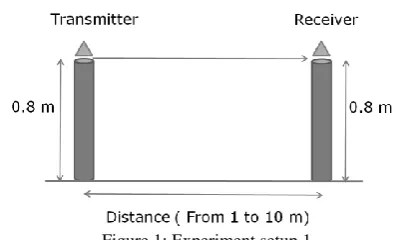
Experimental setup 1, illustrated in Fig. 1 is performed in an indoor environment with area of 12 m × 8 m. CC2431 Evaluation Module (EM) with external swivel antenna is used as transmitter and receiver to perform the RSSI measurement. The CC2431 EM was positioned at top of pole with height of 0.8 m from ground. The experiment has been tested on distance between transmitter and receiver from 1 m to 10 m.
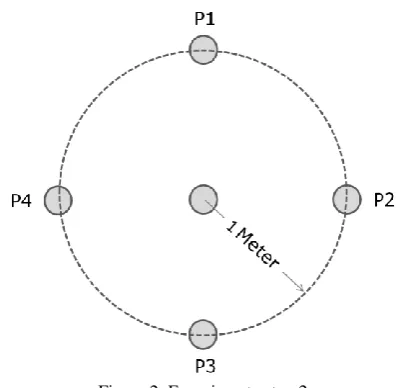
Experimental setup 2, illustrated in Fig. 2 is conducted in an indoor environment to study RSSI measured at 1 m distance between the transmitter and receiver. The receiver is placed at position P1, P2, P3, and P4 each a time. Both the transmitter and receiver are positioned at the top of a pole, which is 0.8 m from the ground.
Both experiments were conducted based on the following procedure: The transmitter send a packet with 30 bytes of constant data every 100 msec. The receiver will receive 200 packets/samples and embedded the measured RSSI, then send to a laptop computer via USB cable for data collection.
Available online:
http://edupediapublications.org/journals/index.php/IJR/
P a g e | 6694.2.Effect of variant receiver node on RSSI
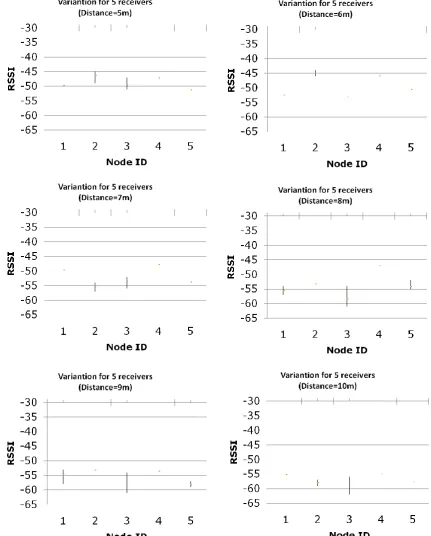
The minimum, maximum and average of RSSI results are shown in Fig. 3, Fig 4 & Fig. 5. The RSSI was measured for 5 receiver nodes in distance from 1 to 10 m. Node 2 recorded the highest variability of RSSI value at distance of 3 m. At distance of 4 m, node 4 and 5 recorded highest RSSI range of 15. Range between minimum and maximum RSSI increase after 2 m, which could cause by wall reflection, multipath fading effect, etc.
Figure 4 illustrates the average RSSI result in distance from 1 to 4 m, and Fig. 5 depicts the average distance from 5 to 10 m for 5 receiver nodes. Overall, node 4 has lowest average RSSI value. Node 3 has highest average RSSI value. We also have noticed that the relationship between RSSI versus distance is not linear in actual environment, and it is highly affected by surrounding factors.
Available online:
http://edupediapublications.org/journals/index.php/IJR/
P a g e | 670 Fig. 3. Average RSSI for 5 receiversFig. 4. Average RSSI for 5 receivers
Fig. 3. Average RSSI for 5 receivers
Available online:
http://edupediapublications.org/journals/index.php/IJR/
P a g e | 6714.3.Effect of receiver node position on RSS
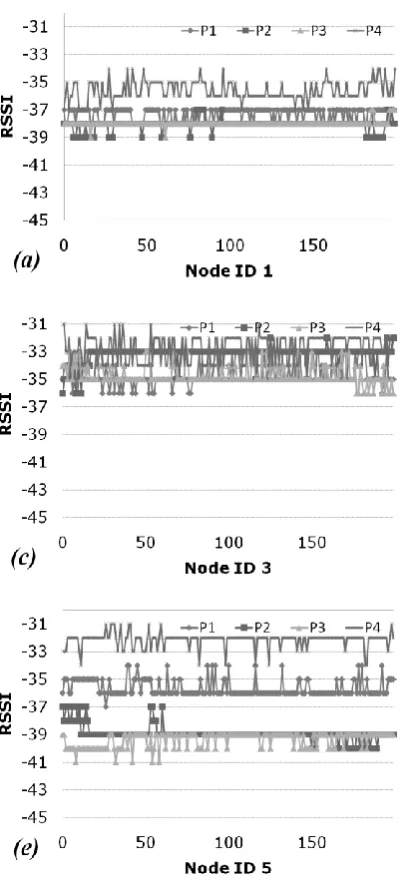
Figure 6 shows result of the RSSI measured when the receiver node is located at position P1, P2, P3, and P4 at experimental setup 2. Node 3 has smallest variability, but node 4 has largest variability, in term
of RSSI value measured. Basically, this explained that the antenna used is not isotropic. This implies that an average value will need to be calculated for parameter A, RSS at distance of 1 m from transmitter, in (2).
Available online:
http://edupediapublications.org/journals/index.php/IJR/
P a g e | 6725.
Conclusion
Using RSS for distance estimation was simple to be implemented and cost effective. Indeed, the irregularity RSS measurement result can be fine tune further with integration of additional filter algorithm. Averaging the RSSI value measured was the simplest method to increase RSSI accuracy. If advanced statistical filter is going to be implemented, we need to carefully investigate the impact of the algorithm towards the resource consumption of the wireless sensor device.
Acknowledgment
All authors have disclosed no conflicts of interest, and authors would like to thank Universiti Sains Malaysia for supported the work by Short Term Grant Scheme (Grant number: 304/PELECT/60311014).
References
[1] N. Patwari, J. N. Ash, and S. Kyperountas, et al., “Locating the nodes”, IEEE Signal Processing Mag., July 2005, pp. 54-69.
[2] T. Stoyanova, F. Kerasiotis, and A. Prayati, “Evaluation of impact factors on RSS accuracy for localization and tracking applications in sensor networks,” Telecommun Syst , July 2009, pp. 235-248.
[3] E. Elnahrawy, X. Li, and R. P. Martin, “The limits of localization using signal strength: a comparative study,” IEEE, 2004.
[4] L. Ye, Z. Geng, and L. Xue, “A novel real time method of signal strength based indoor localization,” ICCSA, 2007, pp. 678-688.
[5] P. Bhuvaneswari, V. Vaidehi, and M. Agnessaranya, “Localization based on signal strength using kalman approach,” Comm. In Computer and Information Science, 1, Vol 90, Part 2, 2010, pp 481-489. [6] T. Huang, Z. Chen, F. Xia and et al., “A practical
localization algorithm based on wireless sensor networks,” GreenCom, 2010, pp. 50-54.
[7] R. Grossmann, J. Blumenthal, and F. Golatowski, “Localization in Zigbee-based sensor networks,” unpublished.
[8] G. Mao, B. Fidan, and B. D. Anderson, “Wireless sensor network localization techniques,” Computer Networks, January 2007.
[9] H. Akcan, Vassil Kriakov, and H. Bronnimann, “Managing cohort movement of mobile sensors via GPS-free and compass-free node localization,” in J. Parallel Distrib. Comput., March 2010.
[10] J. A. Rothermich, M. I. Ecemis, and P. Gaudiano, “Distributed localization and mapping with robotic swarm,” E. Sahin & W.M. Spears, 2005, pp. 58-69. [11] M. Bal, Henry Xue, and W. Shen, “A testbed for
localization and tracking in wireless sensor
3681-3686.
[12] System-on-Chip for 2.4GHz Zigbee®/IEEE 802.15.4 with Location Engine Rev. B, datasheet, Texas Instruments, 2007, [Online] Available: http://www.ti.com/lit/ds/symlink/cc2431.pdf [13] J. N. Ash and R. L. Moses, “Self-localization of
sensor networks,” in Handbook on Array Processing and Sensor Networks, S. Haykin and K.J.R Liu Eds., IEEE-Wiley, 2009.
[14] A. Atyabi, S.P. Amnuaisuk, and C.K.Ho, “Navigating a robotics swarm in an uncharted 2D landscape,” Applied Soft Computing, July 2009. [15] K.N. krishnanand, D. Ghose, “Formations of
minimalist mobile robots using local templates and spatially distributed interactions,” Robotics and Autonomous Systems vol. 53, 2005, pp. 194-213. [16] P. Kulakowski et al., “Angle-of-arrival localization
based on antenna arrays for wireless sensor network,” j.compeleceng, March 2010.
[17] WAFW Othman, BP Amavasai, SP McKibbin, Fabio Caparrelli. “An analysis of collective movement models for robotic swarms”. “EUROCON 2007; The International Conference on Computer as a Tool", pp. 2373-2380, 2007.