Scholarship@Western
Scholarship@Western
Electronic Thesis and Dissertation Repository
11-8-2018 2:30 PM
Spatial and temporal patterns of neutral and adaptive genetic
Spatial and temporal patterns of neutral and adaptive genetic
variation in the alpine butterfly, Parnassius smintheus
variation in the alpine butterfly, Parnassius smintheus
Maryam Jangjoo
The University of Western Ontario
Supervisor
Keyghobadi, Nusha
The University of Western Ontario Graduate Program in Biology
A thesis submitted in partial fulfillment of the requirements for the degree in Doctor of Philosophy
© Maryam Jangjoo 2018
Follow this and additional works at: https://ir.lib.uwo.ca/etd
Part of the Bioinformatics Commons, Entomology Commons, Evolution Commons, Genetics Commons, Molecular Genetics Commons, and the Other Ecology and Evolutionary Biology Commons Recommended Citation
Recommended Citation
Jangjoo, Maryam, "Spatial and temporal patterns of neutral and adaptive genetic variation in the alpine butterfly, Parnassius smintheus" (2018). Electronic Thesis and Dissertation Repository. 5807.
https://ir.lib.uwo.ca/etd/5807
This Dissertation/Thesis is brought to you for free and open access by Scholarship@Western. It has been accepted for inclusion in Electronic Thesis and Dissertation Repository by an authorized administrator of
i
Understanding how much genetic diversity exists in populations, and the processes that
maintain that diversity, has been a central focus of population genetics. The evolutionary
processes that determine patterns of genetic diversity depend on underlying ecological
processes such as dispersal and changes in population size. In this thesis, I examine the
influence of dispersal and population dynamics on neutral and adaptive genetic variation
in a naturally occurring network of populations of the alpine butterfly, Parnassius
smintheus.
My first objective was to determine the combined consequences of demographic
bottlenecks and dispersal on neutral genetic variation within and among populations.
Using microsatellite markers, I genotyped samples collected from across the network of
populations over multiple years and tracked changes in genetic diversity and
differentiation of populations across two documented bottlenecks. I also drew on
long-term mark-recapture data characterizing population size and movement. I demonstrated
that connectivity among populations rescues genetic diversity that is lost as a result of
demographic bottlenecks. I also showed that levels and spatial patterns of genetic
differentiation in the network change cyclically due to continual shifts in the relative
dominance of genetic drift versus gene flow as populations fluctuate in size.
My second objective was to examine relationships between adaptive genetic
variation and dispersal among populations. Using RNA sequencing, I compared gene
expression patterns among individuals with differing dispersal histories. Individuals that
ii
remained in the same patch (non-dispersers). I also examined whether variation at a
candidate locus, the gene encoding the metabolic enzyme phosphoglucose isomerase
(PGI), is associated with dispersal and movement. I found that individuals possessing the
rare allele at each of two non-synonymous Pgi single nucleotide polymorphisms were
either more likely to disperse or dispersed longer distances.
My work demonstrates how population size fluctuations, dispersal, and
landscape structure interact to shape levels and patterns of genetic diversity. My work
also provides insight into how two key global change factors, habitat fragmentation and
climate change, may work synergistically to erode genetic diversity in natural
populations.
Keywords
Alpine butterfly, Connectivity, Demographic bottleneck, Dispersal, Flight, Gene
expression, Gene flow, Genetic differentiation, Genetic diversity, Isolation by distance,
Molecular ecology, Parnassius smintheus, Pgi, Population dynamics, RNA sequencing,
iii
All chapters will be published with Nusha Keyghobadi as a co-author. For all chapters,
Dr. Keyghobadi contributed to study conception and design, supervised the collection of
genetic data, and helped with data interpretation and writing of the manuscripts.
Chapters 2, 3 and 5 are co-authored with Stephen F. Matter and Jens Roland, in
addition to Nusha Keyghobadi. Dr. Matter and Dr. Roland contributed to study design,
oversaw collection of mark-recapture data and samples, and analyzed the mark-recapture
data. In addition to contributing to study design myself, I collected genetic data,
conducted statistical analyses and drafted the manuscripts, with input from all other
authors. Chapter 2 was published in Proceedings of the National Academy of Sciences of
the United States of America. Chapter 3 is in revision at Heredity. Chapter 5 is being
prepared for publication.
Chapter 4 will be co-authored with Joshua B. Benoit, Stephen F. Matter, Brent J.
Sinclair, and Nusha Keyghobadi. I collected field data in collaboration with Dr. Matter.
Dr. Benoit helped with de novo transcriptome assembly and gene expression analyses,
and Dr. Sinclair helped with study design and interpretation of the results. I performed all
laboratory work and analyses, and drafted the manuscript. Chapter 4 is being prepared for
iv
I express my special appreciation to my supervisor Dr. Nusha Keyghobadi for her
invaluable support and guidance throughout my degree. You have been a tremendous
mentor for me and you helped me to achieve more than I expected I could. I am truly
grateful for your efforts every step of the way and for allowing me to grow as a research
scientist.
I also express my gratitude to my committee members, Dr. Brent Sinclair and
Dr. Elizabeth MacDougall-Shackleton for their support, guidance, and assessment of my
work throughout my time at Western. I thank Dr. Stephen Matter and Dr. Jens Roland for
providing a large part of the sampling and field datathroughout my degree. Their
academic advice and constructive feedback has helped me further develop my ability to
interpret ecological and genetic data that improved the thesis.
I thank my former and current lab members: Jenna Siu, Benoit Talbot, Melissa
Lucas, Helen Chen and Andrew Chaulk for their support. Special thanks to Helen,
Melissa and Andrew for their continuous support, friendship, and humor that helped
create an unforgettable experience and pushed me to move forward.
I thank the Biogeoscience Institute of the University of Calgary as well as the
numerous field work teams for running a large mark-recapture study across the network
of butterfly populations and providing samples. Financial support for this project was
provided by the National Science and Engineering Research Council of Canada
(NSERC), Canada Research Chairs and Western University.
A special thanks to my parents, Gholamreza and Afsaneh, and my sisters, Sara
v
support and prayer for me were what sustained me thus far. Finally, I would like to thank
my wonderful husband and my best friend, Ehsan, who helps me in every step of the way.
I am truly grateful for always understanding and for the love you have given me
vi
Abstract ... i
Co-Authorship Statement ... iii
Acknowledgments ... iv
Table of Contents ... vi
List of Tables ... xi
List of Figures ... xiii
List of Appendices ... xv
List of Symbols and Abbreviations ... xvi
List of Software Packages ... xviii
Chapter 1 ... 1
1 General Introduction ... 1
1.1 Dynamics of genetic diversity ... 1
1.2 A brief history of molecular genetic variation studies ... 5
1.3 The ecological context of genetic variation ... 8
1.4 Global change factors affecting genetic diversity ... 9
Effects of habitat loss and fragmentation on genetic diversity ... 10
Effects of climate change on genetic diversity ... 11
Synergistic effects of global change factors ... 12
1.5 Genetic variation and dispersal ... 14
1.6 Pgi as a candidate gene in ecology and evolution ... 17
1.7 Introduction to study species and a model system... 18
1.8 Overview of thesis ... 22
1.9 Literature cited ... 24
vii
2.1 Introduction ... 34
2.2 Materials and Methods ... 38
Sample collection and study region ... 38
Mark-recapture study and estimates of patch connectivity ... 39
DNA extraction and Microsatellite analysis ... 40
Linkage disequilibrium and Hardy–Weinberg tests ... 42
Changes in genetic diversity ... 42
Relationship to patch connectivity and severity of the demographic bottleneck ... 44
2.3 Results and Discussion ... 47
2.4 Literature Cited ... 53
Chapter 3 ... 56
3 Demographic fluctuations lead to rapid and cyclic shifts in genetic structure among populations of an alpine butterfly, (Parnassius smintheus)... 56
3.1 Introduction ... 56
3.2 Material and Methods ... 62
Study site and sample collection ... 62
Tissue sampling and genotyping ... 65
Linkage disequilibrium and Hardy–Weinberg tests ... 65
Spatial genetic structure over time ... 66
Genetic structure and movement patterns ... 68
Direct test of change in spatial genetic structure over time ... 69
3.3 Results ... 70
viii
Direct test of change in spatial genetic structure over time ... 79
3.4 Discussion ... 79
Temporally dynamic interplay of drift and gene flow ... 80
Rapid recovery of spatial genetic patterns ... 82
3.5 Conclusion ... 84
3.6 Literature Cited ... 86
Chapter 4 ... 90
4 Gene expression associated with dispersal history in the alpine butterfly, Parnassius smintheus ... 90
4.1 Introduction ... 90
4.2 Material and methods ... 95
Collection of samples and field data ... 95
Experimental designs ... 96
RNA extractions, and mRNA sequencing... 98
Sequence data processing & de novo transcriptome assembly ... 98
Functional annotation of genes ... 99
Differential gene expression analysis ... 100
Enrichment analysis ... 101
4.3 Results ... 102
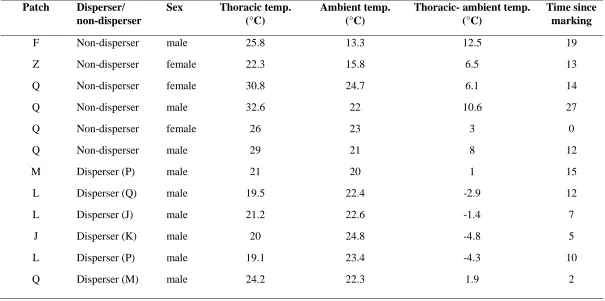
Thoracic temperature and dispersal history ... 102
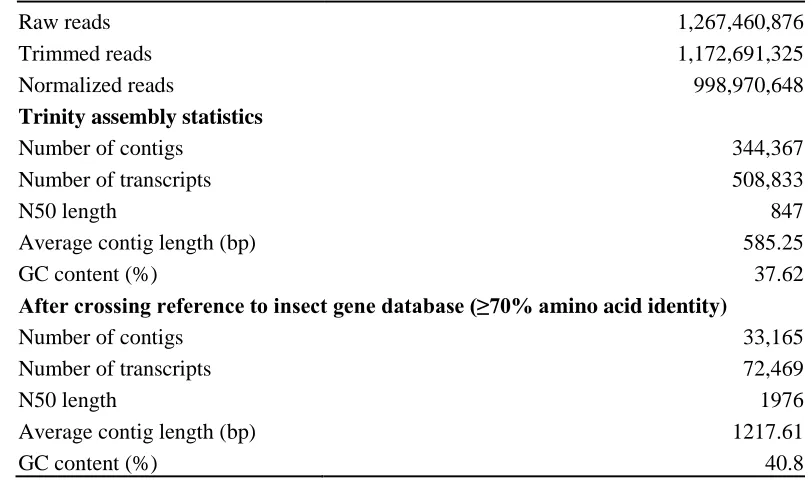
Transcriptome sequencing & de novo reference assembly ... 102
Differential gene expression as a function of dispersal history ... 107
Differential gene expression as a function of thoracic temperature . 116 4.4 Discussion ... 123
ix
5 Genetic variation at the Pgi locus is associated with dispersal in the alpine
butterfly, Parnassius smintheus... 137
5.1 Introduction ... 137
5.2 Material and Methods ... 143
Part I: Pgi coding sequence, thoracic temperature and wing darkness ... 145
Part II: Pgi SNP variation and dispersal in a larger dataset ... 151
5.3 Results ... 154
Part I: Pgi coding sequence, thoracic temperature and wing darkness ... 154
Part II: Pgi SNP variation and dispersal in a larger dataset ... 164
5.4 Discussion ... 168
5.5 Literature cited ... 174
Chapter 6 ... 180
6 General Discussion ... 180
6.1 Overview of dissertation ... 180
6.2 Main contributions of dissertation... 181
Integration of genetic variation with population dynamics ... 181
Integration of genetic variation with dispersal data ... 182
Evaluation of landscape effects ... 184
6.3 General summary ... 185
6.4 Future directions ... 186
6.5 Implications for conservation of alpine species ... 187
6.6 Literature cited ... 190
Appendices ... 193
x
Appendix C: Chapter 4 ... 201
Appendix D: Chapter 5 ... 206
xi
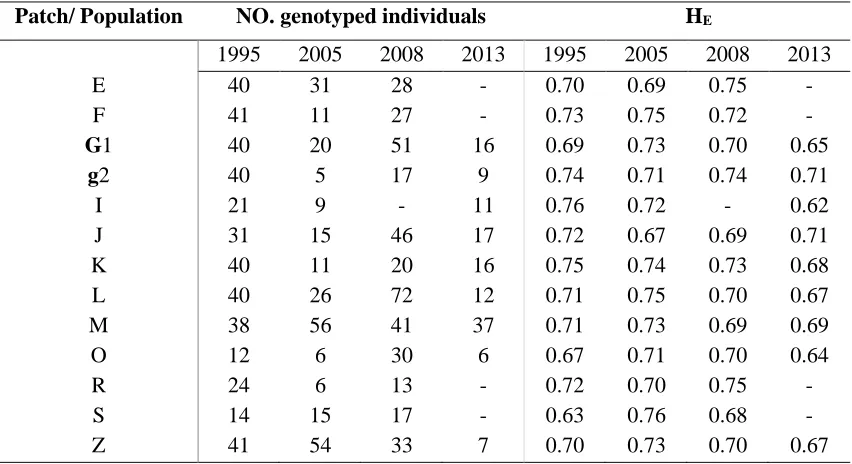
Table 3.1 Sample size and genetic diversity for populations of Parnassius smintheus
sampled at four different time points ... 64
Table 3.2 Summary of Mantel tests and maximum likelihood population effects (MLPE)
models testing the relationship between pairwise genetic distance (FST) and total
geographical distance between populations of Parnassius smintheus at four different time
points. ... 73
Table 3.3 Summary of partial Mantel tests results showing the effects of intervening land
cover on genetic differentiation among populations of Parnassius smintheus at four
different time points ... 76
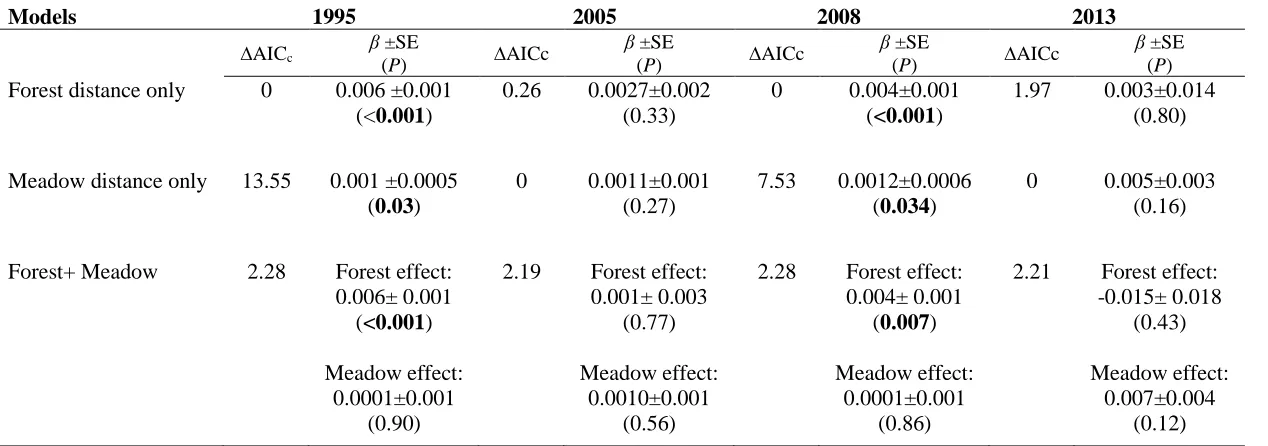
Table 3.4 Summary of maximum likelihood population effects (MLPE) models
explaining genetic differentiation (FST) between populations of Parnassius smintheus as a
function of intervening land cover at four different time points. ... 77
Table 3.5 Summary of Mantel tests and maximum likelihood population effects (MLPE)
models testing the relationship between pairwise genetic distance (FST) and estimated
contemporaneous movement between populations of Parnassius smintheus at four
different time points ... 78
Table 4.1 Information about the samples used for gene expression analysis in this study
... 97
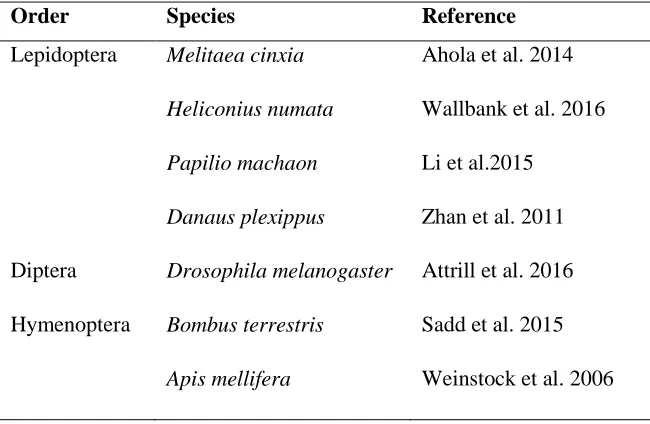
Table 4.2 The insect gene database used to reduce the number of spurious genes and
verify the insect origin of transcripts in the reference transcriptome ... 104
Table 4.3 Summary of de novo assemblies’ quality using common statistical metrics: .. 105
Table 4.4 Summary statistics of sequencing and Parnassius smintheusde novo reference
xii
and wing darkness (part I). ... 146
Table 5.2 Information about the samples used for genotyping Pgi SNPs from genomic
DNA in Parnassius smintheus (Part II) ... 152
Table 5.3 The inferred positions of exons in the coding sequence of the Pgi gene in
Parnassius smintheus, based on alignment to coding sequences of the butterflies, Colia
eurytheme and Melitaea cinxia ... 157
Table 5.4 Non-synonymous SNPs detected in the coding region of Pgi in Parnassius
smintheus. ... 158
Table 5.5 All synonymous SNPs detected in the coding region of Pgi in Parnassius
xiii
Figure 1.1 Map of the study patches occupied by a network of Parnassius smintheus
populations, in Kananaskis, Alberta, Canada ... 20
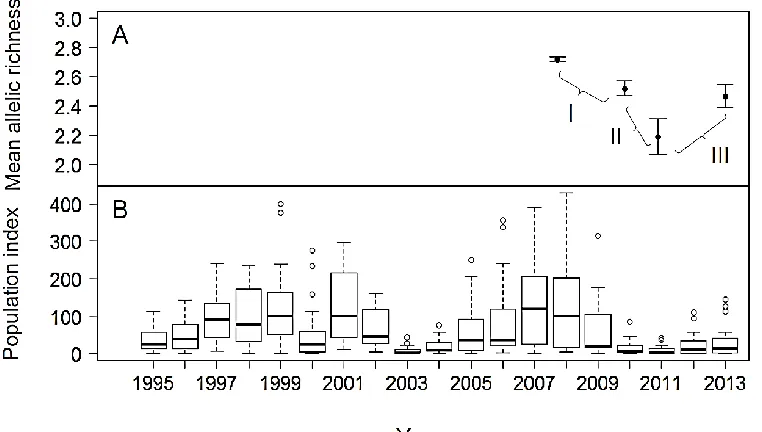
Figure 2.1 Changes in Parnassius smintheus population size and allelic richness (AR) in
the network over different years ... 37
Figure 2.2 Relationship between the proportional loss of allelic richness (AR) across a
demographic bottleneck and habitat patch connectivity in Parnassius smintheus ... 50
Figure 3.1 Parnassius smintheus population size over time ... 60
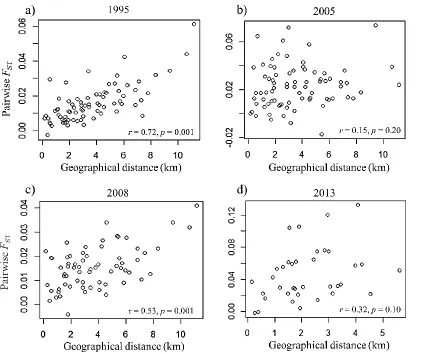
Figure 3.2 Change in the relationship between pairwise genetic differentiation (FST) and
total geographical distance between populations over time, in a network of populations of
Parnassius smintheus. ... 72
Figure 4.1 Cluster analysis based on Pearson correlation coefficients showing similarity
of gene expression profiles in Parnassius smintheus samples. ... 108
Figure 4.2 Heat map matrix of 94 genes differentially expressed between disperser and
non-disperser Parnassius smintheus (FDR <0.05 and minimum four-fold change) ... 109
Figure 4.3 Gene ontology (GO) terms associated with upregulated differentially
expressed genes (DEGs; FDR<0.05) assigned to the biological process (BP) category
... 113
Figure 4.4 Heat map of KEGG pathways associated with significant DEGs (FDR<0.05)
enriched between dispersers and non-dispersers ... 115
Figure 4.5 Cluster analysis based on Pearson correlation coefficients showing similarity
xiv
minimum four-fold change). ... 118
Figure 4.7 Gene ontology (GO) terms associated with upregulated differentially
expressed genes (DEGs; FDR<0.05) assigned to the biological process (BP) category
... 121
Figure 4.8 Heat map of KEGG pathways associated with significant DEGs (FDR<0.05)
enriched between individuals with higher and lower body temperature than ambient. ... 122
Figure 5.1 Relationship between thoracic temperature and ambient temperature in male
dispersers and non-dispersers of Parnassius smintheus ... 163
Figure 5.2 Relationship between relative thoracic temperature (thoracic temperature
minus ambient temperature) and wing color in male dispersers and non-dispersers of
Parnassius smintheus. ... 163
Figure 5.3 The frequency of genotypes (a, b) and alleles (c, d) for dispersal-related SNPs
nsSNP1018 and nsSNP1241, from the coding region of Pgi in Parnassius smintheus... 166
Figure 5.4 The total distance moved between patches for dispersing males with differing
genotypes at the non-synonynous Pgi SNP, nsSNP1018, in Parnassius smintheus ... 167
xv
Appendix A: Chapter 2 ... 193
Appendix B: Chapter 3 ... 198
Appendix C: Chapter 4 ... 201
xvi
ΔAICc Disparity in corrected Akaike information criterion β Estimated parameter coefficient
AIC Akaike information criterion
AICc Corrected Akaike information criterion
AR Allelic richness
ATP Adenosine triphosphate
BLAST Basic local alignment search tool
bp Base pair
BP Biological process
cDNA Complementary DNA synthesized from an mRNA template
CI Confidence interval
CS1 Common Sequence 1
CS2 Common Sequence 2
DEG Differentially expressed gene
df Degrees of freedom
DGAT Diacylglycerol O-acyltransferase DHAP Dihydroxyacetone phosphate DNA Deoxyribonucleic acid e-value Expectation value F6P Fructose-6-phosphate FDR False discovery rate
for Foraging gene
FST Differentiation index G3P Glycerol-3-phosphate
G6P Glucose-6-phosphate
GBS Genotyping by sequencing GLM Generalized linear models
GO Gene ontology
GYS Glycogen synthase
He Expected heterozygosity
hsp Heat‐shock protein
IAM Infinite allele model
IDH1/IDH2 Isocitrate dehydrogenase1,2 IQR Interquartile range
LD Linkage disequilibrium
MAPK Mitogen-activated protein kinases
ML Maximum likelihood
MLPE Maximum likelihood population effects mRNA Messenger ribonucleic acid
N Nucleotide
NADH Nicotinamide adenine dinucleotide NE Effective population size
xvii
Pgi Phosphoglucose isomerase
Phe Phenylalanine
RADSeq Restriction Site Associated DNA Sequencing REML Restricted log-likelihood
RNA Ribonucleic acid
RNA-Seq RNA sequencing or whole transcriptome shotgun sequencing ROS Reactive oxygen species
SD Standard deviation
SE Standard error
SMM Stepwise mutational model SNP Single nucleotide polymorphism
ssSNP Synonymous single nucleotide polymorphism Taq Thermophilus aquaticus
TCA cycle Tricarboxylic acid cycle
Thr Threonine
TMM Trimmed Mean of M-values
TPM Two-phase model
UQCRC2 Ubiquinol-cytochrome c reductase core protein 2 VEGF Vascular endothelial growth factor
xviii DnaSP5 http://www.ub.edu/dnasp/
lme 4 1.1-10 http://CRAN.R-project.org/package=lme4 Ape 5.1 http://ape-package.ird.fr/
BCFtools 1.3.1 http://samtools.github.io/bcftools/
BOTTLENECK 1.2.02 http://www1.montpellier.inra.fr/CBGP/software/ Bottleneck/bottleneck.html
Bowtie2 2.3.0 http://bowtie-bio.sourceforge.net/bowtie2 BUSCO http://busco.ezlab.org
CLC Genomics Workbench 8.5
https://www.qiagenbioinformatics.com/
ClustVis http://biit.cs.ut.ee/clustvis/
corMLPE 0.0.2 https://github.com/nspope/corMLPE
FASTAQC 0.11.5 http://www.bioinformatics.babraham.ac.uk/projects/fastqc FreeNA http://www1.montpellier.inra.fr/CBGP/software/FreeNA/ GeneMapper 4.0 Applied Biosystems (Forest City, CA)
Genepop 4.2 http://genepop.curtin.edu.au
GOseq 1.22.0 http://bioinf.wehi.edu.au/software/goseq/ HMMER 3.1 http://hmmer.org/
HP-Rare 1.0 http://www.montana.edu/kalinowski/ ImageJ http://rsb.info.nih.gov/ij/
KEGG http://www.genome.jp/kegg/
MEGA 6.06 http://www.megasoftware.net
Oases 0.2.08 https://www.ebi.ac.uk/~zerbino/oases/ edgeR 3.5 http://bioconductor.org/packages/edgeR/ Primer3 0.4.0 http://primer3.sourceforge.net/
R v.3.4.4 R Development Core Team, http://www.r-project.org/ RSEM 1.2.25 http://deweylab.biostat.wisc.edu/rsem
SAMtools 1.4.1 http://samtools.sourceforge.net/ SIFT http://sift.jcvi.org/
Stats 3.6.0 https://github.com/arunsrinivasan/cran.stats
TRIMMOMATIC 0.36 http://www.usadellab.org/cms/index.php?page=trimmomatic TRINITY 2.5.0 https://github.com/trinityrnaseq/trinityrnaseq/wiki
TRINOTATE 3.0.2 http://trinotate.github.io
VCFtools 0.1.13 https://vcftools.github.io/index.html
Chapter 1
1
General Introduction
Biodiversity is the variation among all living things on earth (Rao and Hodgkin 2002;
Benton 2016). Genetic diversity is that component of biodiversity represented by
heritable variation among individuals and populations within a species (Rao and Hodgkin
2002). Genetic diversity represents the most fundamental level of biological diversity.
Genetic diversity in populations is important for persistence (Saccheri et al. 1998) and the
ability to adapt to environmental change (Lande and Shannon 1996); therefore, genetic
diversity is arguably the foundation on which higher levels of biodiversity, namely
species and ecosystem diversity, depend.
1.1
Dynamics of genetic diversity
The question of how much genetic diversity is contained in natural populations, and how
that variation arises and is maintained over time, has been a central question of population
genetics since the inception of the field (Charlesworth and Charlesworth 2017). There are
four fundamental evolutionary processes that affect allele frequencies, and therefore
levels of genetic diversity: mutation, gene flow, genetic drift, and selection (Hartl and
Mutation is the ultimate source of genetic variation and leads to new alleles that
can be acted upon by the other evolutionary forces (Fox and Wolf 2006; Frankham et al.
2010). Gene flow is the movement of alleles between populations; it occurs by movement
of individuals or propagules followed by reproduction or establishment, and affects all
parts of the genome. By introducing novel alleles into populations, gene flow increases
genetic diversity within populations and also homogenizes allele frequencies between
populations (Bohonak 1999; Keyghobadi et al. 2005; Fox and Wolf 2006).
Genetic drift is the change in allele frequencies due to random sampling of
gametes from one generation to the next (Hartl and Clark 1989). Like gene flow, genetic
drift affects all parts of the genome. In contrast to gene flow however, genetic drift
reduces genetic variation within populations and increases, on average, differentiation
among populations (Masel 2011). A variety of factors, including founder effects and
demographic bottlenecks, determine the strength of genetic drift by influencing the
effective number of breeding individuals in a population (Fox and Wolf 2006).
Finally, selection alters allele frequencies via the differential survival and
reproduction of individuals with different genotypes. Selection acts on specific loci or
regions of the genome, with nearby physically-linked regions potentially also being
affected through ‘hitchhiking’ (Chevin et al. 2008). Selection can act to increase or
decrease genetic diversity in populations depending on the exact nature of fitness
differences among individuals with different genotypes. Balancing selection, for example,
can maintain polymorphisms within populations, while purifying or directional selection
The fundamental evolutionary forces of gene flow, drift and selection are
determined, in turn, by underlying ecological processes. Thus, dispersal and movement
underlie gene flow (Ronce 2007). Population dynamics and mating structure within
populations have a strong influence on levels of genetic drift (Kliman et al. 2008).
Selection operates through differential ability of individuals to survive and reproduce
within a given environment and ecological context (Pianka 2000).
With respect to genetic variation, a distinction is often made between neutral and
adaptive variation (Holderegger et al. 2006; Frankham et al. 2010). In the case of neutral
genetic variation, different possible alleles at a particular gene or locus do not have any
direct effect on individual fitness. Synonymous substitutions in DNA sequences, which
do not lead to differences at the amino acid level, are an example of potentially neutral
variation. In the case of adaptive genetic variation, in contrast, different possible alleles at
a gene or locus lead to differences in individual fitness. Adaptive variation is arguably
most relevant to a population’s persistence and growth, as it determines the population’s
direct response to environmental conditions (Fox and Wolf 2006; Forester et al. 2016).
All genetic variation is influenced by mutation, gene flow, and genetic drift, but
only adaptive variation is also influenced by selection (Holderegger et al. 2006). The
study of neutral genetic variation therefore allows us to understand the interplay between
mutation, gene flow, and genetic drift that provides the backdrop against which selection
can then act (Holderegger et al. 2006; Pélabon et al. 2010). Furthermore, the combined
examination of both neutral and adaptive variation is needed to provide a complete
From the 1940s through the 1960s, there was considerable debate among
theoretical population geneticists about both the expected levels of genetic diversity in
populations and the processes that most strongly influence that variation (Crow 2010;
Charlesworth and Charlesworth 2017). A ‘classical’ view of genetic variation suggested
that, through the action of directional selection, most genes in populations would be
represented by a single, favourable allele with alternative, deleterious alleles present only
at very low frequencies (Muller 1950). In contrast, the ‘balanced’ view suggested that
there might be many genes with alternative alleles that occurred at intermediate
frequencies, as a result of balancing selection (Dobzhansky 1955).
Similarly, there was disagreement about the relative importance of selection in
general relative to genetic drift, represented most famously by the arguments of the early
theoreticians, Sir Ronald Fisher and Sewall Wright, respectively (Crow 2010). This
debate continued in the 1960s and early 1970s with the introduction of the ‘neutral
model’, which suggested that high levels of genetic variation within and between species
could be maintained by genetic drift acting on neutral allelic variants (Kimura and Crow
1964; Clarke 1970).
One factor that made it difficult to resolve these debates was limited empirical
data on levels and patterns of genetic variation in natural populations. Through the 1940s,
1950s and much of the 1960s, most available data on genetic variation was in the form of
quantitative trait variation and visible chromosomal variation, along with a few, model
cases of discrete morphological variation, such as banding patterns in the snail, Cepaea
nemoralis (Lamotte 1959; Cain et al. 1960), or the wing-spot patterns of butterflies (Ford
traits and whether those genes had weak or strong effects was not known, making it
difficult to infer levels of underlying genetic variability and examine the processes
responsible for maintaining that diversity.
1.2
A brief history of molecular genetic variation studies
It was not until the mid-1960s that the first molecular-level data on genetic variation in
natural populations became available. Over the next 50 years, the introduction of
increasingly sophisticated yet affordable molecular techniques and tools for studying
genetic variation led to an explosion of empirical data. In turn, there has been rapid
progress in understanding levels of natural genetic variation, both within and among
populations, and the underlying driving processes (Freeland et al. 2011). Technological
innovations that have repeatedly revolutionized genetic data collection, and integration
with theoretical studies and powerful data analysis methods, have allowed researchers to
develop an increasingly accurate and complex understanding of genetic variability, even
in non-model organisms (Manel et al. 2010; Rowan et al. 2011; Charlesworth and
Charlesworth 2017).
The first studies to quantify population variability at a molecular level were by
Lewontin and Hubby (1966) and Harris (1966). These studies used starch gel
electrophoresis to differentiate enzyme variants of different charges, in fruit flies
(Drosophila pseudoobscura) and humans, respectively. Although not measuring variation
natural genetic variation than previous studies based on morphological or chromosomal
traits. These landmark studies opened the door to the use of protein electrophoresis to
assay variation in a large potential set of markers, and researchers began studying levels
of allozyme variability and characterizing genetic variation in a range of species.
Allozyme surveys of wild populations increased rapidly through the 1970s and provided
preliminary estimates of genetic variation in diverse taxa (Hamrick and Allard 1972;
Harris and Hopkinson 1978; Allendorf 2017). They also provided a window into the
processes, such as drift and balancing selection, that maintain genetic variation in nature
(Watt 1997).
By the late 1970s, mapping of restriction enzyme sites was applied for detecting
variation directly at the DNA level in natural populations (Loenen et al. 2014). Studies by
Avise et al. (1979a, b) on restriction site variation in mitochondrial DNA of the pocket
gopher, Geomys pinetis, represent the first studies that interpreted variation at the DNA
level in the context of ecological and historical factors. These classic papers also
represent the birth of the field of phylogeography. The first DNA sequencing study that
characterized variation in a natural population was performed shortly after by Kreitman
(1983), and revealed a large amount of previously hidden polymorphism at the alcohol
dehydrogenase locus of Drosophila melanogaster. This study revealed abundant
diversity, particularly at synonymous sites, as well as small DNA insertions and deletions.
The development of microsatellite DNA loci, tandemly repeated short DNA
sequences, as genetic markers in the 1990s represented another major step in studies of
genetic variation. Because of high mutation rates that occur through a process of slipped
genetic markers had the resolution to uncover previously undetected genetic structure
within and among natural populations, as well as the power to uniquely identify
individuals and estimate relatedness among even close relatives (Blouin et al. 1996;
Wagner et al. 2006; Lowe et al. 2010).
In the 1990s and 2000s, researchers also became increasingly interested in
describing patterns of variation not just at a select few markers, but more widely across
genomes. A large number of studies characterized genome-wide variation with hundreds
to a few thousand markers using amplified fragment length polymorphism (AFLP), and
related methods (Meudt and Clarke 2007; Bensch et al. 2008). In the mid-2000s, with the
advent of DNA microarray and next generation sequencing technology, it became
possible to characterize variation in non-model organisms at many thousand,
genome-wide single nucleotide polymorphisms (SNPs; Davey and Blaxter 2010; Narum and Hess
2011; Schmitt et al. 2012). Today, whole genome sequencing is becoming more
accessible to researchers working on natural populations, while next-generation
sequencing of reduced representation libraries, through methods such as Restriction Site
Associated DNA Sequencing (RADSeq; Davey and Blaxter 2010) and Genotyping by
Sequencing (GBS: Elshire et al. 2011) are allowing genome-wide surveys of variability
1.3
The ecological context of genetic variation
As much as the ability to describe genetic variation in natural populations has been
important, the ability to interpret the observed patterns within an ecological context has
also been critical for improving our understanding of how those patterns arise and are
maintained. We have, since the first characterizations of molecular-level variation in the
1960s (Harris 1966; Lewontin and Hubby 1966), developed a much stronger
understanding of the balance of evolutionary forces that determine genetic variation,
including the importance of drift (Crow 2010; Charlesworth and Charlesworth 2017).
Studies in ecological genetics (Ford 1975; Conner and Hartl 2004), in turn, have revealed
the detailed ecological basis of those evolutionary processes. Many studies have explored
the complex links between dispersal and gene flow (Bohonak 1999; Keyghobadi et al.
2005; Derycke et al. 2013), population dynamics and genetic drift (Caplins et al. 2014)
and individual survival and reproduction and selection (Wheat et al. 2006; Orsini et al.
2009).
Studies of the ecological basis of genetic variation patterns have themselves been
spurred on over the past few decades by important technological advances in other areas.
In particular, advances in remote sensing of the environment, and the analysis of spatial
and geographic data, have allowed the use of spatial landscape data to flourish in diverse
areas of ecology (Turner 1990). In the context of understanding genetic variation, these
advances have allowed for in-depth analysis of the links among landscape structure,
movement, and patterns of genetic variation. Thus, the field of ‘landscape genetics’
(Manel et al. 2003) has seen dramatic growth since the mid-2000s (Manel and
Today, researchers are able to investigate genetic variation within natural
populations using a variety of different tools and approaches. Researchers can target
specific candidate genes that are known to code for a trait of interest (Mahamdallie and
Ready 2012; Du et al. 2016) or whose dynamics are well understood in other systems
(Wheat 2010). Researchers can also specifically target neutral loci, such as microsatellites
(Keyghobadi et al. 1999; Lowe et al. 2010), or chose to study both neutral and adaptive
variation in genome-wide studies (Whitehead and Crawford 2006; Candy et al. 2015).
Researchers are also increasingly able to link the observed patterns of genetic variation to
underlying ecological processes (Hughes et al. 2008).
1.4
Global change factors affecting genetic diversity
Biodiversity, including genetic diversity, is currently threatened by various global change
factors. These include habitat loss and fragmentation, overexploitation of species, spread
of invasive species, pollution, and climate change (Sala et al. 2000; Debinski and Holt
2000; Bax et al. 2003; Crow 2010). With respect to genetic diversity, the effects of habitat
loss and fragmentation have probably been the most extensively studied (Takami et al.
2004; Keyghobadi 2007; Ortego et al. 2015). Researchers are also urgently attempting to
understand the effects of climate change on genetic diversity (Pauls et al. 2013;
Effects of habitat loss and fragmentation on genetic diversity
Urban, industrial, and agricultural expansion result in loss of natural habitats and
decreases in the size of habitat patches (i.e., habitat loss), as well as greater isolation of
habitat patches by unfavorable intervening land covers (i.e., habitat fragmentation)
(Fahrig et al. 2011). Because of reduced availability of resources and smaller patch sizes,
habitat loss leads to lower local effective population sizes, which enhances genetic drift
(Young et al. 1996; Keyghobadi 2007). Loss and fragmentation of habitat both lead to a
loss of connectivity among populations (Keyghobadi et al. 2005).
Connectivity, in a general sense, is the extent to which energy and material can
move among populations, communities and ecosystems (Bishop et al. 2017).
Connectivity depends on landscape structure, which is the relative abundance
(‘composition’) and spatial arrangement (‘configuration’’) of different types of land cover
and other geographic features (Turner 1989). However, connectivity among populations
of organisms is ultimately a function of the interaction of those structural elements of the
landscape (i.e., structural connectivity) with the movement behavior of individual species
(i.e., functional connectivity) (Hanski 1994; Tischendorf and Fahrig 2000). Connectivity
can be defined and studied at the level of the entire landscape (i.e., ‘landscape
connectivity’) or individual habitat patches (‘patch connectivity’).
Connectivity among populations is necessary for gene flow (Keyghobadi 2007).
Because gene flow introduces potentially novel alleles into populations, it is a process
that tends to increase genetic variation within populations and counters the loss of
diversity due to drift. Loss of connectivity is therefore predicted to be accompanied by
populations (Witkowski et al. 1997). These processes will be further accelerated if
populations are experiencing greater levels of drift as a result of smaller population sizes.
Therefore, habitat loss and fragmentation are expected to result in an erosion of genetic
diversity from many populations (Keyghobadi 2007).
Effects of climate change on genetic diversity
Climate change as a result of increased atmospheric concentrations of greenhouse gases is
driving increases in mean global temperature, and is also creating more variable local
weather patterns (precipitation and temperature) worldwide (IPCC 2014). Climate change
and associated climatic instability may result in unstable population dynamics and more
frequent and severe fluctuations in population size, including demographic bottlenecks
(i.e. severe but temporary reductions in population size) (Parmesan et al. 2000; Roland
and Matter 2013). These unstable population dynamics could arise in response to greater
variability in availability of resources or, particularly in ectotherms, direct effects of
extreme weather conditions on individual survival (Roland and Matter 2016).
Population size is a key determinant of the rate of genetic drift, with smaller
populations experiencing higher levels of drift (Slatkin 1987; Gauffre et al. 2008). In
populations that fluctuate in size, the lowest population sizes experienced have the
strongest influence on drift (Rich et al. 1979; Bouzat et al. 1998). As a result, when
populations experience demographic bottlenecks, a considerable amount of genetic
diversity can be lost due to drift (Bouzat et al. 1998; Spielman et al. 2004). The increased
lead to lower genetic diversity in populations. At the same time, strong selective forces
associated with a changing climate may arise and lead to directional selection on adaptive
variation for traits such as body size (Gardner et al. 2011), dispersal (Thomas et al. 2001;
Hill et al. 2011), and reproductive timing (Franks et al. 2007). These selective forces will
undoubtedly affect patterns of adaptive genetic variation, although we still have a very
limited understanding of the actual genes likely to be important for climate change
adaptation (Franks and Hoffmann 2012).
Synergistic effects of global change factors
In general, most studies examining effects of global change factors on biodiversity have
focused on the effects of a single factor, such as habitat loss or climate change.
Potentially important interactions and synergies between different global change factors
have been recognized however. Brook et al. (2008) suggested that extinction risk for
many species has been underestimated because of failure to account for such synergies.
They emphasized that better understanding of potential interactions between climate
change and the other global change factors was needed, and that conservation actions
focused on a single factor would be insufficient to prevent biodiversity loss (Brook et al.
2008; Metcalf et al. 2016; Davidson et al. 2018).
In recent years, more effort has been devoted to understanding how interactions
and synergies among different causes of population decline affect biodiversity. Using an
example of historical biodiversity loss, Metcalf et al. (2016) demonstrated that the
alone, drove the extinction of South American megafauna during the late Pleistocene.
More recently, ecologists have explored combined effects of climate change and nutrient
loading on terrestrial and aquatic ecosystems (Davidson et al. 2018). Despite the potential
importance of such synergies, their effects on genetic diversity have not been studied as
extensively as the effects of single factors acting in isolation.
Both habitat fragmentation and climate change may cause losses of genetic
diversity in natural populations. However, the process by which this will occur is
different in each case. The effects of habitat fragmentation are likely to be driven
primarily by loss of connectivity and gene flow among populations, while the effects of
climate change are more likely to be driven by lower effective population sizes and
increased drift. Given that these two factors will affect genetic diversity through different
mechanisms, there is a strong potential for synergies that will accelerate loss of diversity.
That is, lack of connectivity due to fragmentation could exacerbate the effects of climate
change, and vice versa.
In this thesis I examine neutral and adaptive genetic variation in a network of
interconnected populations (a ‘metapopulation’; Levins 1969). I integrate data on neutral
and putatively adaptive variation with data on dispersal and population dynamics. In
Chapters 2 and 3 I focus explicitly on the effects of connectivity among habitat patches,
the effects of fluctuations in population size (specifically, demographic bottlenecks), and
their interaction, on genetic diversity. In doing so I address the first objective of my
thesis, which is to examine potential synergies between habitat fragmentation (which
reduces connectivity) and climate change (which increases demographic variability) on
1.5
Genetic variation and dispersal
Dispersal, through its effect on gene flow, plays an important role in determining levels of
genetic diversity within and among populations (Keyghobadi et al. 2005). However, the
converse relationship, the effect of genetic variation on dispersal ability or tendency, is
also of considerable interest to researchers (Niitepõld 2010; Edelsparre et al. 2014).
In many organisms, individuals display variation in dispersal ability or tendency.
In some cases, differences in dispersal ability among individuals are a result of obvious,
external morphological differences, such as winged and wingless forms (Roff 1986;
Schwander and Leimar 2011). In other cases, the source of dispersal variation is more
subtle and may include less obvious morphological differences (e.g., size of underlying
muscle or relative wing size), behavior, or physiology (Bonte et al. 2012). There has been
considerable interest in understanding the basis of variation in dispersal ability, including
the underlying genetics (Saastamoinen et al. 2018).
Dispersal traits (i.e. morphological, physiological and behavioral aspects of
dispersal) are often quantitative traits showing continuous variation within populations
and potentially under polygenic control (Saastamoinen et al. 2018). The heritability of
dispersal and associated traits (i.e., the proportion of phenotypic variation that is due to
genetic variation) has been estimated in a variety of taxa using quantitative genetic
approaches (reviewed in Zera and Brisson 2012, and Saastamoinen et al. 2018). These
studies demonstrated a significant heritability of dispersal-related traits across many
species, with a moderate average value of 0.35 in insects (Saastamoinen et al. 2018).
determining dispersal, they also highlight that environmental variation and epigenetic
effects, which modify gene expression patterns, can also explain much of the phenotypic
variation in dispersal (Saastamoinen et al. 2018).
Some studies have incorporated genetic markers and mapping to assess the
genetic architecture of dispersal (i.e., number of genes, their location, and relative effect),
in particular using quantitative trait loci (QTL) approaches. This kind of genetic mapping
approach has revealed that the genetic architecture underlying dispersal varies
considerably among species, such that dispersal variation can be controlled by a single
gene, a few genes (each of large effect), or by additive and interactive effects of many
genes (Roff and Fairbairn 2001, 2007; Caillaud et al. 2002).
More recently, researchers have used transcriptome profiling, which reveals gene
expression patterns at the RNA level, to evaluate gene expression differences associated
with dispersal-related behaviours (e.g., long-distance flight) and have thereby identified
large numbers of genes potentially important for dispersal (Margotta et al. 2012;
Somervuo et al. 2014; Jones et al. 2015; Kvist et al. 2015). For example, in thecotton
bollworm (Helicoverpa armigera), flight performance was linked to the differential
expression of a suite of candidate genes involved in flight muscle structure and lipid
metabolism (Jones et al. 2015). In the Glanville fritillary butterfly, Melitaeacinxia, long
distance flight resulted in differential expression of over 1500 genes, including genes
involved in energy metabolism, ribosome biogenesis and RNA processing, stress
responses, and immunity (Kvist et al. 2015).
Finally, in a relatively small number of cases, individual genes and nucleotide
gene with rover and sitter alleles in Drosophilamelanogaster (Sokolowski 1980;
Edelsparre et al. 2014), the G-protein coupled receptor gene neuropeptide receptor-1
(npr-1) in Caenorhabditis elegans (de Bono and Bargmann 1998), and the
phosphoglucose isomerase gene (Pgi) in the Glanville fritillary butterfly, M.cinxia
(Saastamoinen et al. 2018). Allelic variation at the for gene in D. melanogaster influences
larval foraging behaviour, as well as adult dispersal propensity and the probability of
long-distance dispersal (Edelsparre et al. 2014). Likewise, variation at the G-protein
coupled receptor npr-1 leads to a behavioural polymorphism in C. elegans that is in
analogous to the rover and sitter phenotypes associated with the Drosophilafor gene (de
Bono and Bargmann 1998).In the Glanville fritillary, Pgi allelic variation has been linked
directly to movement, dispersal and flight metabolic rate in the field (Haag et al. 2005;
Niitepõld et al. 2009).
Dispersal is critically important to the ecology and evolution of spatially
structured populations and communities (Clobert et al. 2012; Travis et al. 2013). The
second objective of my thesis is to explore the genetic basis of dispersal using
transcriptomics (Chapter 4) and using Pgi as a candidate locus (Chapter 5). By
developing a better understanding of not just how dispersal affects genetic variation
(Chapters 2 and 3), but also how genetic variation influences dispersal (Chapters 4 and 5),
we can develop a more complete and rich appreciation of the dynamics of genetic
1.6
Pgi
as a candidate gene in ecology and evolution
The gene Pgi encodes the enzyme phosphoglucose isomerase (PGI), which catalyzes the
second step in glycolysis, converting glucose-6-phosphate (G6P) into fructose-6-phosphate
(F6P) (Berg et al. 2002). Because this reaction is reversible, and since G6P can enter
alternative pathways of the pentose phosphate shunt or glycogen biosynthesis, PGI is
considered a branch-point enzyme (Wheat and Hill 2014), However, F6P is normally
rapidly consumed in the next step of glycolysis so that it is unlikely to undergo the reverse
reaction in most circumstances (Berg et al. 2002). Through the process of glycolysis, the
high-energy compounds adenosine triphosphate (ATP) and reduced nicotinamide adenine
dinucleotide (NADH) are produced, providing energy to sustain cellular activities.
The gene Pgi has been well-studied in ecological and evolutionary contexts
(Wheat 2010). Many studies have demonstrated polymorphism in Pgi sequences (Haag et
al. 2005; Hoffman 1981; Filatov and Charlesworth 1999; Wheat 2010), evidence for
selection on Pgi (Watt 2003; Orsini et al. 2009), and effects of Pgi alleles on diverse aspects
of performance and fitness (Watt 1983; Watt et al. 1983; Haag et al. 2005). In addition to
effects on flight and dispersal, Pgi variants have also been shown to influence mating
success, oviposition, running speed, thermal performance, and even population growth rate,
across a wide range of taxa (Filatov and Charlesworth 1999; Dahlhoff and Rank 2000;
Orsini et al. 2009; Wheat et al. 2010). Because of extensive evidence for selection on Pgi,
as well as documented effects on ecologically relevant performance traits, this gene is
considered by many to be a candidate adaptive locus for ecologically important traits,
including movement and dispersal, particularly in arthropods (Wheat and Hill 2014).
candidate locus for arthropods is somewhat analogous to the role of the major
histocompatibility (MHC) genes in vertebrates (Wheat 2010).
1.7
Introduction to study species and a model system
The Rocky Mountain apollo butterfly, Parnassius smintheus, occupies high-altitude
alpine meadows (above ca. 2100 m) separated to varying degrees by montane forests in
the North American Rocky Mountains (Fownes and Roland 2002; Ross et al. 2005).
Parnassius smintheus has one generation per year. Adults have a single annual flight in
July–August, during which they mate, and the females lay eggs. Individuals overwinter as
a pharate larva inside the egg. The aposomatic larvae hatch the following year in May and
feed on the main host plant, lanceleaf stonecrop (Sedum lanceolatum), and to a lesser
degree, ledge stonecrop (Rhodiola integrifolia) (Fownes and Roland 2002; Matter et al.
2011). Adults do not disperse more than a few kilometers during their adult lifespan
(Matter et al. 2011), and movement is hindered through forested areas (Roland et al.
2000). Parnassius smintheus is an ideal subject to study spatially-structured populations,
dispersal, and gene flow because of its patchy distribution in mountain landscapes.
My thesis research was conducted on a network of populations of P. smintheus
that occupy patches of alpine meadow habitat along Jumpingpound Ridge, and the
adjacent Cox Hill and Lusk Ridge, in the Kananaskis region of Alberta, Canada (50°
57'N, 114° 54'W; Figure 1.1). The meadow patches are located above treeline,
meadow patches are separated to varying degrees by intervening forest (Roland and
Matter 2007). The total distance between pairs of patches, measured along ridge-tops and
between the centroids of butterfly captures within each patch, range from ~ 150 m to
~11.18 km. This particular network of populations of P. smintheus has been studied
continuously since 1995 through yearly mark-recapture studies and long-term collection
of tissue samples for genetic analysis. The effects of both landscape structure and climate
variation on population dynamics and dispersal in this system have been studied in detail
Figure 1.1 Map of the study patches occupied by a network of Parnassius smintheus populations, in Kananaskis, Alberta,
Canada (50° 57'N, 114° 54'W). Black circles with letter labels show the location of 16 habitat patches sampled along
The size of the adult population in P. smintheus varies from year to year (Roland
et al. 2000; Matter et al. 2014). In the Jumpingpound network, Roland and Matter (2016)
have shown that population dynamics of P. smintheus is largely driven by early winter
weather, which they found was a strong descriptor of annual population growth.
Specifically, increased mortality of overwintering, pharate larvae is associated with
extreme weather, including both cold and warm temperatures, and reduced snowfall in
November. In my study site, two severe network-wide demographic bottlenecks have
been documented (starting in 2003 and 2010, respectively) and these were likely driven
by low overwinter survival of larvae as a result of reduced early winter snow cover. In
general, such bottlenecks are predicted to occur regularly in this system, on the order of
every decade, as a result of year-to-year variation in winter weather conditions (Roland
and Matter 2016).
Basic aspects of the dispersal of adult P. smintheus have been described in my
study system (Roland et al. 2000; Matter et al. 2004). Mark-recapture data suggest most
movements occur within habitat patches and indicate that within a flight season the mean
net displacement is ~ 150 m and the maximum net displacement is ~ 2 km (Roland et al.
2000). Movement and dispersal decline exponentially with distance, but at a more rapid
rate over forested areas than over open meadows (Roland et al. 2000; Matter et al. 2004;
Keyghobadi et al. 2005). Thus, in this system, forest represents a barrier to movement and
the amount of forest in the landscape determines functional connectivity (Roland et al.
2000; Roland and Matter 2007) with important implications for the level of synchrony in
population dynamics (Roland and Matter 2007; Matter et al. 2014) and for gene flow and
capture than males, such that mark-recapture datasets are typically dominated by data
from males. However, using data collected over multiple years, Goff et al. (2018) showed
that although the sexes display similar mean dispersal distances, females are less sensitive
to the effects of intervening forest than males. Population size and density also influence
dispersal, as butterflies are more likely to leave lower density populations and immigrate
to higher density populations (Roland et al. 2000; Matter et al. 2004).
1.8
Overview of thesis
In this thesis, I explore the dynamics of genetic variation in a network of interconnected
populations that experience regular fluctuations in size. I take advantage of, and
contribute to, a unique, long-term dataset comprising demographic, genetic, and
movement data from the spatial population network of P. smintheus. My thesis consists of
four data chapters, which were designed as separate studies for independent publication.
Chapter 2 has been published (Jangjoo et al. 2016), Chapter 3 is under review (Jangjoo et
al. submitted), and Chapters 4 and 5 will soon be submitted for publication.
In Chapters 2 and 3 I focus on the consequences of demographic bottlenecks for
neutral genetic variation (assessed using microsatellite markers), taking into account the
effects of landscape structure. In Chapter 2, I test the hypothesis that habitat patch
connectivity contributes to the rescue of genetic diversity after a demographic bottleneck
by facilitating immigration and gene flow. In Chapter 3, I investigate how patterns of
Specifically, I document changes in neutral genetic structure associated with two cycles
of population size collapse and recovery across the entire network.
In Chapters 4 and 5 I focus on developing a better understanding of the genetics
underlying dispersal in this species. In Chapter 4 I determine if there are differences in
gene expression between individuals that moved between habitat patches (dispersers) and
those that remained in the same habitat patch (non-dispersers). More specifically, I use
RNA-Seq technology to assemble a transcriptome for P. smintheus thoracic muscle tissue
and to compare gene expression patterns among individuals with differing dispersal
histories and caught flying under different temperature conditions. In Chapter 5 I
describe, for the first time, the coding sequence of the candidate gene Pgi in P. smintheus.
I also develop assays for variation at SNPs in Pgi and assess whether Pgi genotype
predicts variation in movement and dispersal among individuals.
Overall, I aim to contribute to the rich literature on the genetics of spatially
structured populations, as well as to the literature exploring effects of habitat
1.9
Literature cited
Allendorf FW (2017). Genetics and the conservation of natural populations: allozymes to genomes. Molecular Ecology 26: 420–430.
Avise JC, Giblin-Davidson C, Laerm J, Patton JC, Lansman RA (1979a). Mitochondrial DNA clones and matriarchal phylogeny within and among geographic populations of the pocket gopher, Geomys pinetis. Proceedings of the National Academy of Sciences of the United States of America 76: 6694–6698.
Avise JC, Lansman RA, Shade RA (1979b). The use of restriction endonucleases to measure mitochondrial DNA sequence relatedness in natural populations. I.
Population structure and evolution in the genus Peromyscus. Genetics 92: 279–295.
Bax N, Williamson A, Aguero M, Gonzalez E, Geeves W (2003). Marine invasive alien species: a threat to global biodiversity. Marine Policy 27: 313–323.
Bensch S, Åkesson S, Irwin DE (2008). The use of AFLP to find an informative SNP: genetic differences across a migratory divide in willow warblers. Molecular Ecology 11: 2359–2366.
Benton MJ (2016). Origins of biodiversity. PLOS Biology 14:e2000724.
Berg J., Tymoczko J., Stryer L (2002). Biochemistry, 5th edition. W H Freeman, New York.
Bishop MJ, Mayer-Pinto M, Airoldi L, Firth LB, Morris RL, Loke LHL, et al. (2017). Effects of ocean sprawl on ecological connectivity: impacts and solutions. Journal of Experimental Marine Biology and Ecology 492: 7–30.
Blouin MS, Parsons M, Lacaille V, Lotz S. (1996). Use of microsatellite loci to classify individuals by relatedness. Molecular Ecology 5: 393–401.
Bohonak AJ (1999). Dispersal, gene flow, and population structure. Quarterly Review of Biology74: 21–45.
Bonte D, Van Dyck H, Bullock JM, Coulon A, Delgado M, Gibbs M, et al. (2012). Costs of dispersal. Biological Reviews 87: 290–312.
Bouzat JL, Cheng HH, Lewin HA, Westemeier RL, Brawn JD, Paige KN (1998). Genetic evaluation of a demographic bottleneck in the greater prairie chicken. Conservation Biology 12: 836–843.
Brook B, Sodhi N, Bradshaw C (2008). Synergies among extinction drivers under global change. Trends in Ecology & Evolution 23: 453–460.
Cain A, King M, Sheppard P (1960). New data on the genetics of polymorphism in the snail Cepaea nemoralis L. Genetics 45: 393-411.
Candy JR, Campbell NR, Grinnell MH, Beacham TD, Larson WA, Narum SR (2015). Population differentiation determined from putative neutral and divergent adaptive genetic markers in Eulachon (Thaleichthys pacificus, Osmeridae), an anadromous Pacific smelt. Molecular Ecology Resources 15: 1421–1434.
Caplins SA, Gilbert KJ, Ciotir C, Roland J, Matter SF, Keyghobadi N (2014). Landscape structure and the genetic effects of a population collapse. Proceedings of the Royal Society B 281: 20141798.
Charlesworth B, Charlesworth D (2017). Population genetics from 1966 to 2016. Heredity 118: 2–9.
Chevin L-M, Billiard S, Hospital F (2008). Hitchhiking both ways: effect of two interfering selective sweeps on linked neutral variation. Genetics 180: 301–316.
Clarke B (1970). Darwinian evolution of proteins. Science 168: 1009–1011.
Clobert J, Baguette M, Benton TG, Bullock JM (2012). Dispersal ecology and evolution. Oxford University Press, Oxford, UK.
Conner JK, Hartl DL (2004). A primer of ecological genetics. Sinauer Associates, Sunderland, USA.
Crow JF (2010). Wright and Fisher on inbreeding and random drift. Genetics 184: 609– 611.
Dahlhoff EP, Rank NE (2000). Functional and physiological consequences of genetic variation at phosphoglucose isomerase: Heat shock protein expression is related to enzyme genotype in a montane beetle. Proceedings of the National Academy of Sciences of the United States of America 97: 10056–10061.
Davey JW, Blaxter ML (2010). RADSeq: next-generation population genetics. Briefings in Functional Genomics 9: 416–423.
Davidson TA, Audet J, Jeppesen E, Landkildehus F, Lauridsen TL, Søndergaard M, et al. (2018). Synergy between nutrients and warming enhances methane ebullition from experimental lakes. Nature Climate Change 8: 156–160.
de Bono M, Bargmann CI (1998). Natural variation in a neuropeptide y receptor homolog modifies social behavior and food response in C. elegans. Cell 94: 679–689.
Debinski DM, Holt RD (2000). A survey and overview of habitat fragmentation experiments. Conservation Biology 14: 342–355.
Derycke S, Backeljau T, Moens T (2013). Dispersal and gene flow in free-living marine nematodes. Frontiers in Zoology 10: 1.
Dobzhansky T (1955). A review of some fundamental concepts and problems of
population genetics. Cold Spring Harbor Symposia on Quantitative Biology 20: 1– 15.
Du Q, Gong C, Wang Q, Zhou D, Yang H, Pan W, et al. (2016). Genetic architecture of growth traits in Populus revealed by integrated quantitative trait locus (QTL) analysis and association studies. New Phytologist 209: 1067–1082.
Edelsparre AH, Vesterberg A, Lim JH, Anwari M, Fitzpatrick MJ (2014). Alleles underlying larval foraging behaviour influence adult dispersal in nature. Ecology Letters 17: 333–339.
Elshire RJ, Glaubitz JC, Sun Q, Poland JA, Kawamoto K, Buckler ES, et al. (2011). A robust, simple genotyping-by-sequencing (GBS) approach for high diversity species. PLoS ONE 6: e19379.
Fahrig L, Baudry J, Brotons L, Burel FG, Crist TO, Fuller RJ, et al. (2011). Functional landscape heterogeneity and animal biodiversity in agricultural landscapes: Heterogeneity and biodiversity. Ecology Letters 14: 101–112.
Filatov DA, Charlesworth D (1999). DNA polymorphism, haplotype structure and balancing selection in the Leavenworthia PgiC Locus. Genetics 153: 1423–1434.
Ford EB (1975). Ecological genetics. Chapman and Hall, New York, US.
Forester BR, Jones MR, Joost S, Landguth EL, Lasky JR (2016). Detecting spatial genetic signatures of local adaptation in heterogeneous landscapes. Molecular Ecology 25: 104–120.
Fownes S, Roland J (2002). Effects of meadow suitability on female behaviour in the alpine butterfly Parnassius smintheus. Ecological Entomology 27: 457–466.
Fox C, Wolf J (2006). In: Evolutionary genetics: concepts and case studies, Oxford University Press. Oxford, NY, USA.
Frankham R, Briscoe DA, Ballou JD (2010). Introduction to conservation genetics. Cambridge University Press,Cambridge.
Franks SJ, Hoffmann AA (2012). Genetics of climate change adaptation. Annual Review of Genetics 46: 185–208.
Franks SJ, Sim S, Weis AE (2007). Rapid evolution of flowering time by an annual plant in response to a climate fluctuation. Proceedings of the National Academy of Sciences of the United States of America 104: 1278–1282.
Freeland JR, Heather K, Petersen S (2011). Molecular ecology. Wiley-Blackwell, UK.
Gauffre B, Estoup A, Bretagnolle V, Cosson JF (2008). Spatial genetic structure of a small rodent in a heterogeneous landscape. Molecular Ecology 17: 4619–4629.
Goff J, Yerke C, Keyghobadi N, Matter SF (2018). Dispersing male Parnassius
smintheus butterflies are more strongly affected by forest matrix than are females. Insect Science.doi: 10.1111/1744-7917.12592.
Haag CR, Saastamoinen M, Marden JH, Hanski I (2005). A candidate locus for variation in dispersal rate in a butterfly metapopulation. Proceedings of the Royal Society B 272: 2449–2456.
Hamrick JL, Allard RW (1972). Microgeographical variation in allozyme frequencies in Avena barbata. Proceedings of the National Academy of Sciences 69: 2100–2104.
Hanski I (1994). A practical model of metapopulation dynamics. Journal of Animal Ecology 63: 151–162.
Harris H (1966). Genetics of man enzyme polymorphisms in man. Proceedings of the Royal Society B 164: 298–310.
Harris H, Hopkinson DA (1978). Handbook of enzyme electrophoresis in human genetics[M]. North-Holland Publishing Company, Amsterdam.
Hartl DL, Clark AG (1989). Principles of population genetics, Fourth Edition. Sinauer Associate. Sunderland, Massachusetts, USA.
Hill JK, Griffiths HM, Thomas CD (2011). Climate change and evolutionary adaptations at species’ range margins. Annual Review of Entomology 56: 143–159.
Hoffman R. (1981). Evolutionary genetics of Metridium senile. I. Kinetic differences in phosphoglucose isomerase allozymes. Biochemical Genetics 19: 129–144.
Holderegger R, Kamm U, Gugerli F (2006). Adaptive vs. neutral genetic diversity: implications for landscape genetics. Landscape Ecology 21: 797–807.
Hughes AR, Inouye BD, Johnson MTJ, Underwood N, Vellend M (2008). Ecological consequences of genetic diversity. Ecology Letters 11: 609–623.
IPCC (2014). Climate Change 2013: The Physical science basis: Working group I contribution to the fifth assessment report of the international panel on climate change. Cambridge University Press, London.
Jangjoo M, Matter SF, Roland J, Keyghobadi N (2016). Connectivity rescues genetic diversity after a demographic bottleneck in a butterfly population network. Proceedings of the National Academy of Sciences of the United States of America 113: 10914–10919.
Jones CM, Papanicolaou A, Mironidis GK, Vontas J, Yang Y, Lim KS, et al. (2015). Genomewide transcriptional signatures of migratory flight activity in a globally invasive insect pest. Molecular Ecology 24: 4901–4911.
Keyghobadi N (2007). The genetic implications of habitat fragmentation for animals. Canadian Journal of Zoology 85: 1049–1064.
Keyghobadi N, Roland J, Strobeck C (1999). Influence of landscape on the population genetic structure of the alpine butterfly Parnassius smintheus (Papilionidae). Molecular Ecology 8: 1481–1495.
Keyghobadi N, Roland J, Strobeck C (2005). Genetic differentiation and gene flow among populations of the alpine butterfly, Parnassius smintheus, vary with landscape connectivity. Molecular Ecology 14: 1897–1909.
Kimura M, Crow JF (1964). The number of alleles that can be maintained in a finite population. Genetics 49: 725–738.
Kliman, R, Sheehy B, Schultz J (2008). Genetic drift and effective population size. Nature Education 1: 3.
Kreitman M (1983). Nucleotide polymorphism at the alcohol dehydrogenase locus of Drosophila melanogaster. Nature 304: 412–417.
Kvist J, Mattila ALK, Somervuo P, Ahola V, Koskinen P, Paulin L, et al. (2015). Flight-induced changes in gene expression in the Glanville fritillary butterfly. Molecular Ecology 24: 4886–4900.
Lamotte M (1959). Polymorphism of natural populations of Cepaea nemoralis. Cold Spring Harbor Symposia on Quantitative Biology 24: 65–86.
Lande R, Shannon S (1996). The role of genetic variation in adaptation and population persistence in a changing environment. Evolution 50: 434–437.
Levins R (1969). Some demographic and genetic consequences of environmental heterogeneity for biological control. Bulletin of the Entomological Society of America 15: 237–240.
Lewontin, RC, Hubby JL (1966). A molecular approach to the study of genic heterozygosity in natural populations. II. Amount of variation and degree of heterozygosity in natural populations of Drosophzla pseudoobscura. Genetics 54: 595–609.
Li YC, Korol AB, Fahima T, Beiles A, Nevo E (2002). Microsatellites: genomic
distribution, putative functions and mutational mechanisms: a review: Microsatellite evolution. Molecular Ecology 11: 2453–2465.