New Classification of Collective Animal Behaviour as
an Autonomous System
Takayuki Niizato1,†,‡ , Kotaro Sakamoto2,‡and Yoh-ichi Mototake3,*, Hisashi Murakami4, Takenori Tomaru5, Tomotaro Hoshika1, Toshiki Fukushima1
1 Faculty of Engineering, Information and Systems University of Tsukuba, Japan
2 University of Tsukuba, Leading Graduate School Doctoral Program in Human Biology, Japan
3 University of Tokyo, Graduate School of Frontier Sciences, Japan
4 University of Tokyo, Research Center for Advanced Science and Technology, Japan
5 Toyohashi University of Technology, Department of Computer Science and Engineering, Japan
* Correspondence: [email protected], [email protected]
† Current address: Faculty of Engineering, Information and Systems University of Tsukuba, Japan ‡ These authors contributed equally to this work.
Abstract:Integrated information theory (IIT) was initially proposed to describe human consciousness in terms of intrinsic, causal brain-network structures. This theory has the potential to be useful for conceptualising complex living systems. In a previous study, we analysed collective behaviour in Plecoglossus altivelis and found that IIT 3.0 exhibits qualitative discontinuity between three and four fish. Other measures like mutual information did not have such characteristics. In this study, we followed up on our previous findings and examined timescale effects on integrated information of collective behaviour. We found that a long timescale (1 s) causes Boid-like local interactions to dominate over interactions with the whole, but only when the group size is five at a given time scale (i.e. around 0.2 s). Interestingly, the most suitable time scale is roughly equal to fish reaction time. We used these data to propose a new classification for fish schools, with each size group being a unique and autonomous system, despite small group sizes.
Keywords:Integrated Information Theory; Collective Behaviour, Self-Organization; Cause and Effect Structure
1. Introduction
Collective behaviours in nature are emergent properties produced through local interactions of self-organising individuals. Such behaviours include swarming [1–6], fish schooling [7–11], bird flocking [12–17], or high-level cognitive functions arising from ’bottom-up’ neural networks. These systems of many interacting elements can achieve optimal information processing capabilities when poised at the critical boundary separating chaos from order. Several analyses have demonstrated individuals responding swiftly as a collective to changing environments [14–16] and that a group can achieve relatively good decision-making [18–20]. Conflicts among individuals do not necessarily lead to group disruption and can instead provide valuable insight into what collective responses are effective [21,22]. The unity of collective behaviours remains a natural mystery of nature [23], because interactions are hidden, while the resultant actions are observable.
Self-organised criticality (SOC) is a valuable concept for interpreting complex collective behaviours. Flexibility and robustness can be achieved collectively when the group is in the intermediate state between order and disorder [24–29]. For instance, external perturbations of collective systems in SOC models optimise the effective correlation range of each individual to accomplish efficient information transfer [13–16]. However, the SOC models are unreliable with small groups, because individual interactions are less likely to be homogeneous [30,31]. In fish, for example, groups of two and three appear to exhibit differential between-individual interactions [32,33]. Therefore, many researchers have examined information transfer (or causal relationships) among
individuals in small groups [34–36], often employing local transfer entropy [37–42]. For example, transfer of misinformation happens in schools with five fish when the whole group changes direction [36]. Animals could potentially use active information storage to predict the timing of nontrivial information transfer [43,44]. Despite capturing some aspects of collective behaviour systems, however, SOC models provide little insight on the causal structures within groups [45].
In contrast, integrated information theory (IIT) may be a good metric for group interactions [46] because it has the potential to model intrinsic causal structures. Proposed by Balduzzi and Tononi [47] in 2009, IIT was originally developed to quantify consciousness from brain activity [47,48]. In principle, the core concept of IIT is to define integrated information (Φ) as degree of information loss (or increase in uncertainty [49]) caused by a given partition of the system [48,50]. The versatility of this concept has led to widespread application in multiple fields [48–53]. Recent studies have indicated that IIT can discriminate between various states of lost consciousness, such as dreamless sleep [54], general anaesthesia [55], or vegetative states [56]. Some studies have suggested that integrated information could act as an order parameter of complex systems, similar to the generalised Ising model [57], coupled oscillators [58], and coupled mapping [59]. In these order parameters,Φpeaks indicate critical points. Assuming that biological systems such as schools of fish evolved to reside in a critical state for advantages such as fast information transfer, having highΦvalues may provide meaningful insight into collective animal behaviour, especially if we understand the universal features ofΦnear critical points.
Integrated information theory is also resonant with complex systems because it posits that the whole cannot be reduced into its parts; the components produce synergetic information that would be lost upon separation [60,61]. Complex biological systems are also irreducible owing to their intrinsic causal structures [62]. When applying IIT to these systems,Φcan be a measure of an autonomous system’s wholeness [60], capturing intrinsic causal structures [63] while also acting as its order parameter. As an initial step to modelling collective animal behaviour, some researchers have applied IIT to interpret classifications of cellular automatons [45], animats [64] and Boolean networks [65]. For instance, averageΦvalues for five to six automata cells correlated well with their complexity (e.g. class III and IV rules), despite the small cell-set number [45]. This finding suggests thatΦcan be used to distinguish between even groups of small sizes.
Existing studies applying IIT as an order parameter employed IIT 2.0, among the different variants of this theory [66]. In the present work, we instead chose to use IIT 3.0 because its modelling of integrated-information variance (or susceptibility) is more similar to an order parameter. In our previous study [67], we applied IIT 3.0 to schools of two to five fish (Plecoglossus altivelis) and found that Phi was discontinuity between three- and four-fish schools in Phi. In the present work, we extended our approach further to examine how integrated information changed under different timescales. We aimed to determine whether group size could distinguish between fish schools as distinct autonomous systems.
2. Results
2.1. Definition of the local and the global parameter settings
Because collective behaviours do not have specific ON/OFF firing states, we first defined binary states among fish schools so that IIT 3.0 could be applicable. We followed our proposal in the previous study of using local and global parameters as a threshold for ON states.
There are clear conceptual differences between local and global parameters. The latter assumes that each individual knows the state of the entire group and thus can refer to the global state for determining subsequent behaviour. This assumption allows us compare individual state with average group values. In contrast, local parameters do not have such an assumption.
1
2
3
4 1
2
3
4
ON-OFF states for local parameter settings
Distance Field of View Turning Rate
1 2 3 4
State of Distance Parameter
State of Field of View Parameter State of Turning Rate Parameter
1 2 3 4
…
…
Time series of states
Apply Conjunction
1
2
3
4
ON-OFF states for global parameter settings
1 2 3 4
State for Centre of Mass
State for Average Direction
Apply Conjunction
1 2 3 4
…
…
Time series of states CM
CM Centre of Mass AD Average Direction
AD
1
2
3
4 1
2
3
4
Figure 1.(a) ON and OFF states for local parameter settings. Three parameters determine a school’s
state (yellow: distance, blue: field of view, purple: turning rate). Coloured fish are in the ON state. (b) ON and OFF states for global parameter settings. Two parameters determine a school’s state (yellow: centre of mass, blue: average direction). Coloured fish are in the ON state. For both local and global parameters, we applied a conjunction of all school states to obtain the final school state at time t. We then computedΦfrom a time series of these states in PyPhi.
sensitive to parameter or timescale (length of time step) selection. In contrast to our previous study, we examined a timescale range:∆= 5/120 s,∆= 10/120 s,∆= 20/120 s,∆=40/120 s,∆= 80/120 s, and∆=120/120 s.
To clarify our definitions of local and global parameters, consider a situation where each parameter is given asζ= 200 mm,η= 3/2πrad, andδ= 0.1 rad. The first two parameters are metric distance
(i.e. ζ) with blind sight (i.e. η), variables that have been used in other flocking models. Combined,
they determine a fish’s interaction radius in the group, a necessary condition for agent interactions. Specifically, the outside of this radius generates immediate interactions. The third parameter (δ)
is turning rate. If the value is >0.1 rad, some environmental factors are involved in generating individual movement. In flocking models, this environmental effect always stems from neighbours (after excluding noise).
In summary, the combination of these three parameters models a situation where information transfer occurs only when the individual changes direction within their interaction radius, similar to existing flocking models [69,70]. Notably, using ‘OR’ to connect the parameters is illogical. For example, if distance and field of view are connected by ‘AND’, while turning rate is connected to them by ‘OR’, that essentially signifies information transfer occurring irrespective of interaction status when some agents change direction. The same logic applies to other connective relations. Therefore, combining the three parameters with ‘AND’ is the most reasonable setting to capture information transfer in collective behaviour.
Conceptualisation of the global parameters differs from the local parameters. For example, if a fish’s distance from the centre of mass is always above its threshold, this fish never reaches the core of the school. If a fish’s direction almost always differs from the average group direction, this fish changes its direction irrespective of group direction. Overall, global parameter settings depict feedback information from the whole school. Such feedback is often observed in complex systems because they contain several nested scale events [6]. All parameter settings include one parameter dependence: (effect of distance parameter alone. The latter can be obtained withδ= 0 andη= 2π, resulting in
an always ‘ON’ conjunction between the two variables. The setting of these two parameters does not influence ‘ON’ and ‘OFF’ states generated by the distance parameter alone. Such parametric tuning allows for separating the effects of any parameter settings. As in our previous study, we set the network structure of fish schools to be entirely connected, without self-loops. This assumption stemmed from the observation that the minimum distance between any pair of fishes was <5 mm in our experiments. Such a distance suggests that some interactions must happen among all fishes after about 10-15 min of free swimming.
2.2.Φvalues for local parameter settings across timescales
0.05 0.10 0.15 0.20 0.025 0.050 0.075 0.100 0.125 0.150 0.175 0.200 0.1 0.2 0.3 0.4 0.5 0.6 0.7 0.25 0.50 0.75 1.00 1.25 1.50 1.75 0.025 0.050 0.075 0.100 0.125 0.150 0.175 0.200 0.05 0.10 0.15 0.20 0.2 0.4 0.6 0.8 1.0 0.5 1.0 1.5 2.0 2.5 3.0 0.02 0.04 0.06 0.08 0.10 0.12 0.14 0.16 0.1 0.2 0.3 0.4 0.5 0.2 0.4 0.6 0.8 1.0 1.2 1.4 1 2 3 4 5 0.05 0.10 0.15 0.20 0.1 0.2 0.3 0.4 0.5 0.2 0.4 0.6 0.8 1.0 1.2 1.4 1.6 0.5 1.0 1.5 2.0 2.5 3.0 3.5 4.0 0.05 0.10 0.15 0.20 0.25 0.1 0.2 0.3 0.4 0.5 0.2 0.4 0.6 0.8 1.0 1.2 1.4 1.6 0.5 1.0 1.5 2.0 2.5 3.0 3.5 0.05 0.10 0.15 0.20 0.25 0.1 0.2 0.3 0.4 0.5 0.6 0.2 0.4 0.6 0.8 1.0 1.2 0.5 1.0 1.5 2.0 2.5 3.0 3.5
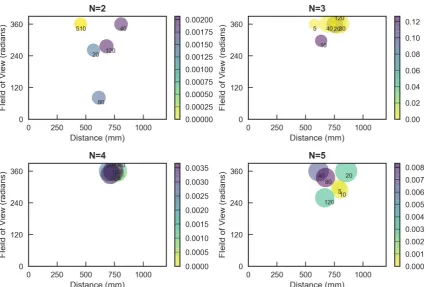
Figure 2. The heat map shows meanΦvalues, represented by circle colour and size. Each axis
corresponds to a different parameter (Field of View (πrad), Distance (mm) and Turning Rate (πrad)). MeanΦvalues peak around 20/120 and 40/120 s. After passing peak values,Φgradually decreases. Standard deviation ofΦhighly correlates with the mean (see SI.1).
to its neighbours through changing direction. Our results thus reflect the tendency of long timescales to become increasingly important for direction changing in a group. However, our analysis has some major differences from simple flocking models. In our parameter settings, OFF states of fish are rare compared with ON states. These differences imply that changing directions is not informative or does not have much causal power for fish schools, a possibility that might provide new insight into the collective behaviour as autonomous systems.
Variance ofΦvalues (SI.1) reveal completely different information from mean values. Because IIT 3.0 computesΦfor every group state (2nstates for n fish schools), we can calculate standard deviations (SD) ofΦfrom all states in addition to meanΦ. In IIT 3.0,Φrefers to the causal structure’s degree of irreducibility to specific parts (i.e. minimum information partition) [45,51,65]. The irreducible system will lose much cause-effect power if removing a group member results in two different systems.
A highly integrated information group means each fish uniquely contributes to establishing densely connected autonomous systems. In our study, all fish schools experienced a cut of only one fish from the remaining group members. The lack of that single element results in loss of intrinsic causal power among a highly integrated group. In contrast, a less integrated information group has two situations upon the loss of a group member. One is that the original conceptual information (before cutting) is low. The other is that the original conceptual information (before-cutting intrinsic causal structure) is high, but post-cutting information loss is low. Both cases indicate that removing one element does not strongly affect the system. Lowly integrated systems contain relatively independent small clusters because remaining fish can cover the loss of information.
Fish schools can have with high SD in both highly integrated and lowly integrated systems, the former exhibiting well-coordinated group activities and the latter having relatively independent elements. Compared with the distribution of SD ofΦvalues in SI.1, SD is strongly correlated with meanΦ. This observation suggests that raising meanΦalso increases SD ofΦvalues. Having both highly integrated and lowly integrated groups may contribute to boosting fitness.
2.3. Peak shifting across each parametric space
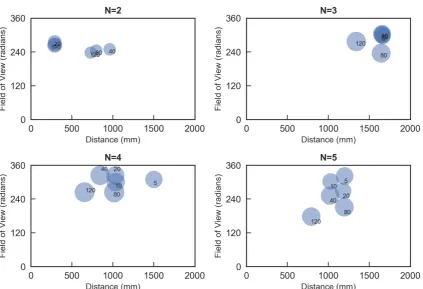
Based on our hypothesis that living systems evolve to increaseΦ, we selected the top fiveΦvalues from each data series and averaged them (Fig.3). All groups tended to increaseΦwith increasing timescales, with the most values around 20/120 or 40/120 s.
Notably,Φvalues of N= 2 exhibits the most change all over the parameter space along with timescale. This movement is generated by followership characteristics observed mainly in the two-fish school. Specifically,Φincreases in the two-fish group when either fish traces the other’s trajectory (i.e. the narrow threshold of the visual field). In contrast, three- and four-fish schools never radically changed parametric values except turning rate. However, followership and not leadership explains a one point decrease on the field of view axis at 10/120 s inN=3. In contrast, the field of view axis drops slightly for short timescales below 10/120 s inN=4. This drop is due to leadership, which was more conspicuous in the five-fish group. These differences suggest that the four- and five-fish schools are fundamentally different autonomous systems in terms of timescales.
Figure 4.Transition of averaged top fiveΦvalues and other parameters per group size. There is a general tendency to move leftward and downward in the parametric space. More distribution data can be seen in SI.2.
2.4.ΦlocalversusΦglobal
Local parameter settings and global parameter settings yield qualitatively differentΦvalues. We therefore denotedΦlocalfor the local parameters andΦglobalfor global parameters.Φlocalis an intrinsic
causal power generated by Boid-like local interactions, whileΦglobalis generated by interactions with
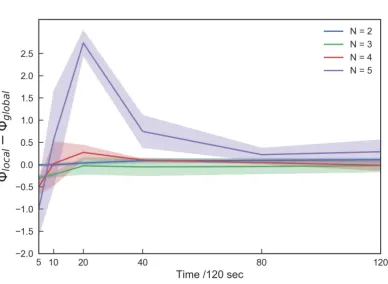
Figure 5.The difference inΦlocalandΦglobalalong timescales per group size. Positive values indicate that causal power generated by local interactions is greater than its global reference. The difference increases over a long timescale when the group size is five. Under a short timescale (<0.10 s), causal power generated by the global reference tends to be higher than what is generated by local references except in the two-fish school.
The difference betweenΦlocalandΦglobalindicates which is the dominant process for a group at
a given timescale. The dominant process in a short timescale (5/120 s) is highΦglobal, or interaction
with the global reference (Fig.5). However, in relatively long timescales above 20/120 s, the apparent high peak emerges in N = 5. This positive peak at 20/120 s suggests that the dominant process at this timescale is the Boid-like local interaction. Interestingly, this timescale approximately corresponds to fish reaction times [36].
Our data, therefore, suggest that local interactions dominate in schools with over five fish. Thus, four and five-fish schools appear to be clearly distinct.
2.5. New classification of fish schools as a different autonomous systems
dominate this group for long timescales. The intrinsic causal power of local interactions overwhelms global interactions.
Short time scale Long time scale
Leader/ Follower
View/ Distance
Local/ Global
Leader/ Follower
View/ Distance
Local/ Global
N=2 N D N F V and D N
N=3 N D N N D N
N=4 L V and D G N D N
N=5 L V and D G L V and D L
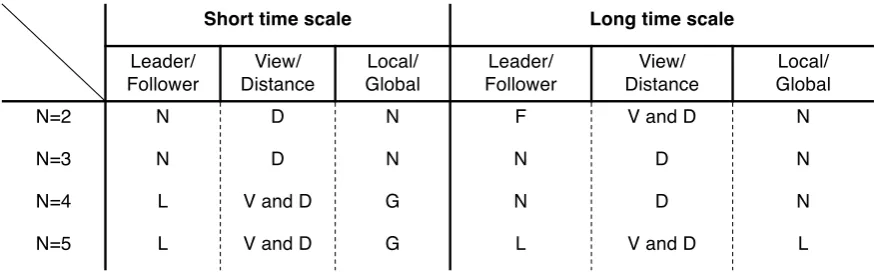
Figure 6.Classification of fish schools. The first column classifies the existence of leader (L), follower
(F), or neither (N). The second column classifies the most influential parameter pair of distance (D) or field of view (V). The third column classifies the dominant interaction mode: local interaction (L), global interaction (G), or neither (N). The same classification applies for short and long timescales.
3. Discussion
Studies on collective behaviour have long focused solely on within-group interactions, such as transfer entropy among individuals and collective information transfer seen in scale-free correlations or shock-waves[13,69]. In this study, we shed light on an overlooked aspect of collective behaviour through our focus on how group size affects collective behaviour.
Continuous small changes make a qualitative difference, but it can be difficult to determine the tipping point or the one change that triggers the difference. This sorites paradox (adding individual grains eventually becomes a heap) can be observed all over the domain of complex systems (ex. neurons build consciousness, individuals build group behaviour). From this perspective, the emergence of collective behaviour is about identifying the number of individuals that trigger collective behaviour. Therefore, the distinction for a small number of groups as an autonomous system does not seem crucial for understanding collective behaviour.
In terms of applying the sorites paradox to actual living systems, consider the following. If we construct a heap for a given environment, we need to keep the area around the heap clean and indicate the correct place to place grains. The former refers to environmental factors that may destroy the heap, while the latter suggests that disorganisation results in the complete lack of a heap. To build the heap, the external observer must intervene in each process since the heap image exists in his head.
This ceaseless intervention to the system is vital for the sorites paradox. However, what are the relations of this argument and collective behaviour?
Forming groups is not an easy task for individuals because no one has a rigorous blueprint of aggregations. Each individual attempts to maintain tight relations with each other and sometimes may deviate from the group for individual needs. Most collective behaviour in nature is unstable, with group fission being just as essential for improving fitness as group fusion. Thus, individual animals are constantly intervening in the process of forming aggregations, similar to the external observer in the sorites paradox.
The manipulativist view [70] helps explain why IIT 3.0 is the best candidate for analysing those requirements. The causal-effect structure of an autonomous system represents ‘what causes what’, considering all counterfactual states [63]. Lombardi et al. correctly pointed out that the central idea of ‘differences that make differences’ represents intervention in the cause-effect structure of a system [70].
We can also apply this argument to collective behaviour. The intrinsic causal structure in fish schools represents how each fish effects each other to maintain an aggregation. Since the cause-effect structure in fish schools represents virtual interventions inside the group, the sorites tipping point becomes invalid in IIT 3.0. Instead, we can confirm the existence of various tipping points in collective behaviour, supporting our hypothesis of living systems evolving to raiseΦ. We have already seen one of tipping points as discontinuity between schools of different sizes in this and previous studies [29]. Furthermore, high meanΦstrongly correlated with high SD ofΦ. This pattern indicates that the group forms a well-organised causal structure as an autonomous system and contains relatively independent groups in the same system. Plecoglossus altivelis may solve the paradox of balancing between forming a grain heap (highΦ values) while also containing independent grains (lowΦ values). This is possible because ceaseless intervention from the outside (extrinsic perspective) turns into ceaseless intervention inside the group (intrinsic perspective).
We provide a new list of classifications as a different autonomous system for a small number of fish schools. The list is not decisive, as other suitable parameter settings are, of course, possible. However, we believe that our parameter settings fit well with present theories of collective behaviour. The local parameter setting is based on a Boid-like interaction model, and the global parameter setting is based on the feedback from the whole system. Using our parameter settings, IIT 3.0 can discriminate between two- to five-fish school as distinct systems.
IIT 3.0 showed that local interactions dominate in five-fish schools. The difference between ΦlocalandΦglobal;becomes a positive maximum near fish reaction times. This finding suggests thatΦ generated by the local interaction scheme defeats global interaction when group size is over five. Two-and three-fish schools show little difference between local Two-and global interactions. Even if the global dominance emerges above the four-fish school, this difference soon disappears for long timescales. Only the five-fish school retains their difference for long timescales. This outcome strictly distinguishes the five-fish school from schools with fewer fish.
4. Materials and Methods
4.1. Ethics statement
This study was carried out in strict accordance with the recommendations in the Guide for the Care and Use of Laboratory Animals of the National Institutes of Health. The protocol was approved by the Committee on the Ethics of Animal Experiments of the University of Tsukuba (Permit Number: 14-386). All efforts were made to minimise suffering.
4.2.Φcomputation
All computations, in this paper, were performed using the PyPhi software package with the CUT_ONE_APPROXIMATION toΦ.
4.3. Experimental Settings
We studiedayus(Plecoglossus altivelis), also known as sweetfish, which live throughout Japan and are widely farmed in Japan. Juvenileayus(approximately 7-14cmin body length) display typical schooling behaviour, though adultayustend to show territorial behaviour in environments where fish density is low. We purchased juveniles from Tarumiyoushoku (Kasumigaura, Ibaraki, Japan) and housed them in a controlled laboratory. Approximately 150 fish lived in a 0.8m3tank of continuously filtered and recycled fresh water with a temperature maintained at 16.4◦C, and were fed commercial food pellets. Immediately before each experiment was conducted, randomly chosen fish were separated to form a school of each size and were moved to an experimental arena without pre-training. The experimental arena consisted of a 3×3m2shallow white tank. The water depth was approximately 15
video camera (Library GE 60; Library Co. Ltd., Tokyo, Japan) at a spatial resolution of 640×480 pixels and a temporal resolution of 120 frames per second.
4.4. Data Summary
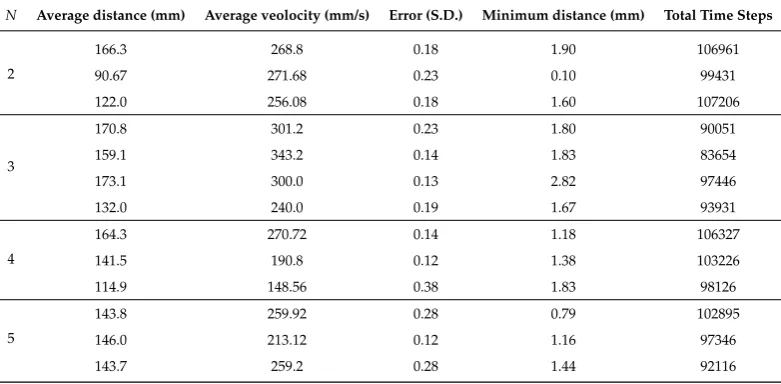
Table 1.Data Summary.N: Number of individuals (Unit: None),x: Average distance (Unit: (mm)),v:
Average veolocity (Unit: (mm) per second), Error (S.D.) (Unit: Degrees (rad)),dmin: Minimum distance (Unit: (mm)), Total Time Steps (steps)
N Average distance (mm) Average veolocity (mm/s) Error (S.D.) Minimum distance (mm) Total Time Steps
2
166.3 268.8 0.18 1.90 106961
90.67 271.68 0.23 0.10 99431
122.0 256.08 0.18 1.60 107206
3
170.8 301.2 0.23 1.80 90051
159.1 343.2 0.14 1.83 83654
173.1 300.0 0.13 2.82 97446
132.0 240.0 0.19 1.67 93931
4
164.3 270.72 0.14 1.18 106327
141.5 190.8 0.12 1.38 103226
114.9 148.56 0.38 1.83 98126
5
143.8 259.92 0.28 0.79 102895
146.0 213.12 0.12 1.16 97346
143.7 259.2 0.28 1.44 92116
4.5. Timescales
We prepared the trajectory data in different time intervals (In Python X[:;δt]) and applied
smoothing by convolving three data points to reduce noise.δtis a timescale inδt/120.
4.6. The definition of ON and OFF state for each parameter
We define a function for each parameter that returns either 0 (OFF) or 1 (ON) for given input values. Generally, we denote a function asFit(·), whereFis the name of the function,iis the index of the individual andtis the time. The arguments of the function can be either in the position vectors xi(t)or the velocity vectorsvi(t)of each individual at time t. In general, the dimensions of these
vectors ared≤3; the experimental setup used here givesd=2. The number of individuals isN. 4.6.1. Local parameters
• Distance functionDit(x1(t),x2(t),· · ·,xn(t)):Rd×Rd× · · · ×Rd−→ {0, 1}
For each individualiwe obtain a setSti = {j|d(xi(t),xj(t))< ζ,j6=i}of all other individuals
within a specified distanceζ. Hered(x,y)gives the Euclidean distance betweenxandy. Then,
Dit(x1(t),x2(t), . . . ,xn(t)) =1 when|Sti|>0 and is 0 otherwise, where|S|denotes the number
of elements of a setS.
• Blind sight functionBit(v1(t),v2(t),· · ·,vn(t)):Rd×Rd× · · · ×Rd−→ {0, 1}
For each individual we form the set Oti = {j| arg(vi(t), vj(t)) < η, j 6= i} of all other
individuals whose velocity vectors point in a direction within an angle η of that of the
focal individual. The function arg(v1(t),v2(t)) gives the angle between two vectors. Then,
Bti(v1(t),v2(t),· · ·,vn(t)) =1 when|Oit|>0 and is 0 otherwise.
• Turning rate functionTit(vi(t),vi(t−∆t)):Rd×Rd−→ {0, 1}
The turning rate function returns 1 when an individual’s turning rate exceeds a specified thresholdδ. That is,Tit(vi(t),vi(t−∆t)) =1 when arg(vi(t),vi(t−∆t))≥δand is 0 otherwise.
To obtain the states of the fish school, we take a conjunction of these result, that is, Dit(x1(t),x2(t),· · ·,xn(t))∧Bti(v1(t),v2(t),· · ·,vn(t))∧Tit(vi(t),vi(t−∆t))for each individual
i. The conjunction is given as ∧ : {0, 1}2 −→ {0, 1} where 1∧1 = 1 and is 0 otherwise. Thus the state of each individual i at time t is si(t;ζ,η,δ) ∈ {0, 1} which depends on
the triplet of parameter values (ζ,η,δ). The state of the school at time t is then a vector
s(t) = (s1(t),s2(t), . . . ,sn(t)) ∈ {0, 1}n, where the parameter dependence has been omitted
for simplicity.
4.6.2. Global parameters
• Average direction functionAvdti(V(t),vi(t)):Rd×Rd−→ {0, 1}
V(t)is the average of{v1(t),v2(t), ...,vn(t)}. If an individual’s direction of motion deviates from
the average by more than a threshold amountΘthen the individual is in the OFF state: that is, Avdti(V(t),vi(t)) =1 when arg(V(t),vi(t))≤Θ, and is 0 otherwise.
• Centre of mass functionComti(X(t),xi(t)):Rd×Rd−→ {0, 1}
X(t) is the average of {x1(t),x2(t),· · ·,xn(t)}. If an individual is further from X(t) than a
specified thresholdΩthen the individual is in the OFF state: that is,Comti(X(t),xi(t)) =1 when
d(X(t),xi(t))≤Ωand is 0 otherwise.
To obtain the state of the fish school, we take a conjunction of these results to obtain a state for each individual which depends on the pair (Θ,Ω):, si(t;Θ,Ω) = Avdti(V(t),vi(t))∧
Comti(X(t),xi(t)) ∈ {0, 1}. The state of the school at time t is then a vector s(t) =
(s1(t),s2(t), . . . ,sn(t)) ∈ {0, 1}n, where the parameter dependence has been omitted for
simplicity.
Supplementary Materials:Figure S1: Susceptibility ofΦ, Figure S2: Mean values ofΦwith global parameter
settings, Figure S3: Susceptibility ofΦwith global parameter settings.
Author Contributions:Conceptualisation, T.N., K.S. and Y.M; methodology, T.N. and K.S.; software, T.N. and
K.S.; validation, T.N. and K.S. ; formal analysis, T.N. and K.S.; investigation, T.N. and K.S.; resources, T.N., T.H, T.F; data curation, T.N. and K.S.; writing—original draft preparation, T.N., K.S. and Y.M; writing—review and editing, T.N., T.H, Y.,M, H.M, T.T., T.F; visualisation, T.N. and K.S.
Funding:This research received no external funding.
Conflicts of Interest:The authors declare no competing interests.
Abbreviations
The following abbreviations are used in this manuscript:
IIT Integrated Information Theory SOC Self-organising Criticality
References
1. Buhl, J.; Sumpter, D.; Couzin, I.; Hale, J.; Despland, E.; Miller, E.; Simpson, S. From Disorder to Order in Marching Locusts.Science2006,312, 1402–1406. doi:10.1126/science.1125142.
2. Yates, C.; Erban, R.; Escudero, C.; Couzin, I.; Buhl, J. Inherent noise can facilitate coherence in collective swarm motion. PNAS2009,106, 5464–5469. doi:https://doi.org/10.1126/science.1125142.
3. Bazazi, S.; Bartumeus, F.; Hale, J.J.; Couzin, I.D. Intermittent motion in desert locusts: Behavioural complexity in simple environments.PLoS Computational Biology2012. doi:10.1371/journal.pcbi.1002498. 4. Attanasi, A.; Cavagna, A.; Castello, D.; Giardina, I.; Melillo, S.; Parisi, L.; Pohl, O.; Rossaro, R.; Shen, E.;
Silvestri, E.; Viale, M. Finite-size scaling as a way to probe near-criticality in natural swarms. Phys. Rev. Lett2014,113, 238102. doi:https://doi.org/10.1103/PhysRevLett.113.238102.
5. Attanasi, A.; Cavagna, A.; Del Castello, L.; Giardina, I.; Melillo, S.; Parisi, L.; Pohl, O.; Rossaro, B.; Shen, E.; Silvestri, E.; Viale, M. Collective Behaviour without Collective Order in Wild Swarms of Midges. PLoS
6. Murakami, H.; Tomaru, T.; Nishiyama, Y.; Moriyama, T.; Niizato, T.; Gunji, Y.P. Emergent runaway into an avoidance area in a swarm of soldier crabs.PLoS ONE2014. doi:10.1371/journal.pone.0097870.
7. Ioannou, C.C.; Guttal, V.; Couzin, I.D. Predatory fish select for coordinated collective motion in virtual prey. Science2012,[arXiv:arXiv:astro-ph/0005074v1]. doi:10.1126/science.1218919.
8. Strandburg-Peshkin, A.; Twomey, C.R.; Bode, N.W.; Kao, A.B.; Katz, Y.; Ioannou, C.C.; Rosenthal, S.B.; Torney, C.J.; Wu, H.S.; Levin, S.A.; Couzin, I.D. Visual sensory networks and effective information transfer in animal groups.Current Biology2013. doi:10.1016/j.cub.2013.07.059.
9. Berdahl, A.; Torney, C.J.; Ioannou, C.C.; Faria, J.J.; Couzin, I.D. Emergent sensing of complex environments by mobile animal groups. Science2013. doi:10.1126/science.1225883.
10. Murakami, H.; Niizato, T.; Tomaru, T.; Nishiyama, Y.; Gunji, Y.P. Inherent noise appears as a Lévy walk in fish schools. Scientific Reports2015. doi:10.1038/srep10605.
11. Niizato, T.; Murakami, H.; Sangu, K.; Tomaru, T.; Sonoda, K.; Nishiyama, Y.; Gunji, Y.P. Local perspectives of Plecoglossusaltivelis determine searching strategy. AIP Conference Proceedings, 2017. doi:10.1063/1.4992536.
12. Ballerini, M.; Cabibbo, N.; Candelier, R.; Cavagna, A.; Cisbani, E.; Giardina, I.; Orlandi, A.; Parisi, G.; Procaccini, A.; Viale, M.; Zdravkovic, V. Empirical investigation of starling flocks: a benchmark study in collective animal behaviour.Animal Behaviour2008,[0802.1667]. doi:10.1016/j.anbehav.2008.02.004. 13. Cavagna, A.; Cimarelli, A.; Giardina, I.; Parisi, G.; Santagati, R.; Stefanini, F.; Viale, M. Scale-free
correlations in starling flocks. Proceedings of the National Academy of Sciences 2010, [0911.4393]. doi:10.1073/pnas.1005766107.
14. Cavagna, A.; Duarte Queirós, S.M.; Giardina, I.; Stefanini, F.; Viale, M. Diffusion of individual birds in starling flocks. Proceedings of the Royal Society B: Biological Sciences 2013, [1206.4434]. doi:10.1016/S0022-5347(17)41086-X.
15. Bialek, W.; Cavagna, A.; Giardina, I.; Mora, T.; Pohl, O.; Silvestri, E.; Viale, M.; Walczak, A.M. Social interactions dominate speed control in poising natural flocks near criticality. Proceedings of the National
Academy of Sciences2014,[1307.5563]. doi:10.1073/pnas.1324045111.
16. Attanasi, A.; Cavagna, A.; Del Castello, L.; Giardina, I.; Jelic, A.; Melillo, S.; Parisi, L.; Pohl, O.; Shen, E.; Viale, M. Emergence of collective changes in travel direction of starling flocks from individual birds’ fluctuations. Journal of the Royal Society Interface2015,[1410.3330]. doi:10.1098/rsif.2015.0319.
17. Mora, T.; Walczak, A.M.; Del Castello, L.; Ginelli, F.; Melillo, S.; Parisi, L.; Viale, M.; Cavagna, A.; Giardina, I. Local equilibrium in bird flocks. Nature Physics2016,[1511.01958]. doi:10.1038/nphys3846.
18. Franks, N.R.; Dornhaus, A.; Fitzsimmons, J.P.; Stevens, M. Speed versus accuracy in collective decision making.Proceedings of the Royal Society B: Biological Sciences2003. doi:10.1098/rspb.2003.2527.
19. Dyer, J.R.; Johansson, A.; Helbing, D.; Couzin, I.D.; Krause, J. Leadership, consensus decision making and collective behaviour in humans.Philosophical Transactions of the Royal Society B: Biological Sciences2009. doi:10.1098/rstb.2008.0233.
20. Bose, T.; Reina, A.; Marshall, J.A. Collective decision-making, 2017. doi:10.1016/j.cobeha.2017.03.004. 21. Couzin, I.D.; Ioannou, C.C.; Demirel, G.; Gross, T.; Torney, C.J.; Hartnett, A.; Conradt, L.; Levin, S.A.;
Leonard, N.E. Uninformed individuals promote democratic consensus in animal groups. Science2011. doi:10.1126/science.1210280.
22. Pinkoviezky, I.; Couzin, I.D.; Gov, N.S. Collective conflict resolution in groups on the move. Physical
Review E2018. doi:10.1103/PhysRevE.97.032304.
23. Couzin, I. Collective minds.Nature2007. doi:10.1038/445715a.
24. Bak, P.; Tang, C.; Wiesenfeld, K. Self-organized criticality. Physical Review A1988,[arXiv:1011.1669v3]. doi:10.1103/PhysRevA.38.364.
25. Tetzlaff, C.; Okujeni, S.; Egert, U.; Wörgötter, F.; Butz, M. Self-organized criticality in developing neuronal networks. PLoS Computational Biology2010. doi:10.1371/journal.pcbi.1001013.
26. Niizato, T.; Gunji, Y.P. Fluctuation-driven flocking movement in three dimensions and scale-free correlation.
PLoS ONE2012. doi:10.1371/journal.pone.0035615.
27. Gunji, Y.P. Self-organized criticality in asynchronously tuned elementary cellular automata. Complex
Systems2014,[1306.4419]. doi:10.1142/9789814602136_0021.
28. Gunji, Y.P.; Sakiyama, T.; Murakami, H. Punctuated equilibrium based on a locally ambiguous niche.
29. Niizato, T.; Murakami, H. Entangled time in flocking : Multi-time-scale interaction reveals emergence of inherent noise.PLoS ONE2018,13, 1–21. doi:10.1371/journal.pone.0195988.
30. Herbert-Read, J.E.; Krause, S.; Morrell, L.J.; Schaerf, T.M.; Krause, J.; Ward, A.J. The role of individuality in collective group movement. Proceedings of the Royal Society B: Biological Sciences2013. doi:10.1098/rspb.2012.2564.
31. Jolles, J.W.; Boogert, N.J.; Sridhar, V.H.; Couzin, I.D.; Manica, A. Consistent Individual Differences Drive Collective Behavior and Group Functioning of Schooling Fish. Current Biology2017,[1601.08202]. doi:10.1016/j.cub.2017.08.004.
32. Katz, Y.; Tunstrom, K.; Ioannou, C.C.; Huepe, C.; Couzin, I.D. Inferring the structure and dynamics of interactions in schooling fish. Proceedings of the National Academy of Sciences2011,[arXiv:1604.05974v2]. doi:10.1073/pnas.1107583108.
33. Gautrais, J.; Ginelli, F.; Fournier, R.; Blanco, S.; Soria, M.; Chaté, H.; Theraulaz, G. Deciphering Interactions in Moving Animal Groups. PLoS Computational Biology2012. doi:10.1371/journal.pcbi.1002678.
34. Staniek, M.; Lehnertz, K. Symbolic transfer entropy. Physical Review Letters 2008, [1007.0357v1]. doi:10.1103/PhysRevLett.100.158101.
35. Butail, S.; Mwaffo, V.; Porfiri, M. Model-free information-theoretic approach to infer leadership in pairs of zebrafish.Physical Review E2016,[arXiv:1011.1669v3]. doi:10.1103/PhysRevE.93.042411.
36. Crosato, E.; Jiang, L.; Lecheval, V.; Lizier, J.T.; Wang, X.R.; Tichit, P.; Theraulaz, G.; Prokopenko, M. Informative and misinformative interactions in a school of fish, 2018, [1705.01213]. doi:10.1007/s11721-018-0157-x.
37. Lizier, J.T.; Prokopenko, M.; Zomaya, A.Y. Local information transfer as a spatiotemporal filter for complex systems. Physical Review E - Statistical, Nonlinear, and Soft Matter Physics2008, [0809.3275]. doi:10.1103/PhysRevE.77.026110.
38. Lizier, J.T.; Prokopenko, M.; Zomaya, A.Y. Local measures of information storage in complex distributed computation. Information Sciences2012. doi:10.1016/j.ins.2012.04.016.
39. Sun, J.; Bollt, E.M. Causation entropy identifies indirect influences, dominance of neighbors and anticipatory couplings.Physica D: Nonlinear Phenomena2014,[1504.03769]. doi:10.1016/j.physd.2013.07.001. 40. James, R.G.; Barnett, N.; Crutchfield, J.P. Information Flows? A Critique of Transfer Entropies.Physical
Review Letters2016,[1512.06479]. doi:10.1103/PhysRevLett.116.238701.
41. Tomaru, T.; Murakami, H.; Niizato, T.; Nishiyama, Y.; Sonoda, K.; Moriyama, T.; Gunji, Y.P. Information transfer in a swarm of soldier crabs. Artificial Life and Robotics2016. doi:10.1007/s10015-016-0272-y. 42. Yagmur Erten, E.; Lizier, J.T.; Piraveenan, M.; Prokopenko, M. Criticality and information dynamics in
epidemiological models.Entropy2017. doi:10.3390/e19050194.
43. Wang, X.R.; Miller, J.M.; Lizier, J.T.; Prokopenko, M.; Rossi, L.F. Quantifying and tracing information cascades in swarms. PLoS ONE2012. doi:10.1371/journal.pone.0040084.
44. Wang, X.R.; Miller, J.M.; Lizier, J.T.; Prokopenko, M.; Rossi, L.F. Measuring information storage and transfer in swarms. Proceedings of the Eleventh European Conference on the Synthesis and Simulation of Living Systems
(ECAL 2011)2011.
45. Albantakis, L.; Tononi, G. The intrinsic cause-effect power of discrete dynamical systems-from elementary cellular automata to adapting animats.Entropy2015. doi:10.3390/e17085472.
46. Engel, D.; Malone, T.W. Integrated information as a metric for group interaction. PLOS ONE2018,13, 1–19. doi:10.1371/journal.pone.0205335.
47. Balduzzi, D.; Tononi, G. Qualia: The geometry of integrated information. PLoS Computational Biology2009, [NIHMS150003]. doi:10.1371/journal.pcbi.1000462.
48. Tononi, G. An Integrated iNformation Theory of Consciousness. InEncyclopedia of Consciousness; 2010; [1606.06737]. doi:10.1016/B978-012373873-8.00014-1.
49. Barrett, A.B.; Seth, A.K. Practical measures of integrated information for time- series data. PLoS
Computational Biology2011. doi:10.1371/journal.pcbi.1001052.
50. Oizumi, M.; Amari, S.I.; Yanagawa, T.; Fujii, N.; Tsuchiya, N. Measuring Integrated Information from the Decoding Perspective.PLoS Computational Biology2016,[1505.04368]. doi:10.1371/journal.pcbi.1004654. 51. Oizumi, M.; Albantakis, L.; Tononi, G. From the Phenomenology to the Mechanisms of
52. Oizumi, M.; Tsuchiya, N.; Amari, S.i. A unified framework for information integration based on information geometry2015. 113,[1510.04455]. doi:10.1073/pnas.1603583113.
53. Mayner, W.; Marshall, W.; Albantakis, L.; Findlay, G.; Marchman, R.; Tononi, G. PyPhi: A toolbox for integrated information theory. PLoS Computational Biology2018. doi:10.1371/journal.pcbi.1006343. 54. Massimini, M.; Ferrarelli, F.; Huber, R.; Esser, S.K.; Singh, H.; Tononi, G. Neuroscience: Breakdown of
cortical effective connectivity during sleep.Science2005,[20]. doi:10.1126/science.1117256.
55. Alkire, M.T.; Hudetz, A.G.; Tononi, G. Consciousness and anesthesia. Science (New York, N.Y.)2008. doi:10.1126/science.1149213.Consciousness.
56. Gosseries, O.; Di, H.; Laureys, S.; Boly, M. Measuring Consciousness in Severely Damaged Brains. Annual
Review of Neuroscience2014. doi:10.1146/annurev-neuro-062012-170339.
57. Khajehabdollahi, S.; Abeyasinghe, P.; Owen, A.; Soddu, A. The emergence of integrated information, complexity, and consciousness at criticality. bioRxiv 2019, [https://www.biorxiv.org/content/early/2019/01/15/521567.full.pdf]. doi:10.1101/521567.
58. Mediano, Pedro A.M., F.J.C.; Shanahan, M. Integrated Information and Metastability in Systems of Coupled Oscillators2016. [arXiv:1606.08313].
59. Mori, H.; Oizumi, M. Information integration in a globally coupled chaotic system. The 2018 Conference on Artificial Life: A Hybrid of the European Conference on Artificial Life (ECAL) and the
International Conference on the Synthesis and Simulation of Living Systems (ALIFE) 2018, pp. 384–385.
doi:https://doi.org/10.1162/isal_a_00074.
60. Farnsworth, K. How Organisms Gained Causal Independence and How It Might Be Quantified. Biology
2018. doi:10.3390/biology7030038.
61. Hooker, C.Philosophy of Complex Systems (Handbook of the Philosophy of Science, vol. 10); North Holland, 2011. 62. Bertalanffy, L.General system theory: foundations, development, applications (Revised Edition); George Braziller,
1969.
63. Albantakis, L.; Marshall, W.; Hoel, E.; Tononi, G. What caused what? A quantitative account of actual causation using dynamical causal networks2017. [arXiv:1708.06716].
64. Edlund, J.A.; Chaumont, N.; Hintze, A.; Koch, C.; Tononi, G.; Adami, C. Integrated information increases with fitness in the evolution of animats. PLoS Computational Biology 2011, [1103.1791]. doi:10.1371/journal.pcbi.1002236.
65. Marshall, W.; Kim, H.; Walker, S.I.; Tononi, G.; Albantakis, L. How causal analysis can reveal autonomy in models of biological systems. Philosophical Transactions of the Royal Society A: Mathematical, Physical and
Engineering Sciences2017,[1708.07880]. doi:10.1098/rsta.2016.0358.
66. Mediano, P.A.; Seth, A.K.; Barrett, A.B. Measuring Integrated Information: Comparison of Candidate Measures in Theory and Simulation. Entropy2019,21. doi:10.3390/e21010017.
67. Niizato, T.; Sakamoto, K.; Mototake, Y.; Murakami, H.; Tomaru, T.; Hoshika, T.; Fukushima, T. Finding Continuity and Discontinuity in Fish Schools via Integrated Information Theory2018. [arXiv:1812.00718]. 68. Couzin, I.D.; Krause, J.; James, R.; Ruxton, G.D.; Franks, N.R. Collective memory and spatial sorting in
animal groups. Journal of Theoretical Biology2002. doi:10.1007/s00706-014-1213-x.
69. Procaccini, A.; Orlandi, A.; Cavagna, A.; Giardina, I.; Zoratto, F.; Santucci, D.; Chiarotti, F.; Hemelrijk, C.K.; Alleva, E.; Parisi, G.; Carere, C. Propagating waves in starling, Sturnus vulgaris, flocks under predation.
Animal Behaviour2011. doi:10.1016/j.anbehav.2011.07.006.