Original Research Paper
Gene Selection and Classification in Microarray Datasets
using a Hybrid Approach of PCC-BPSO/GA with Multi
Classifiers
1Shilan S. Hameed, 2Fahmi F. Muhammad, 3Rohayanti Hassan and 4,5Faisal Saeed
1
Department of Software Engineering, Faculty of Engineering, Koya University, Koya, Kurdistan Region, Iraq 2
Department of Physics, Faculty of Science & Health, Koya University, Koya, Kurdistan Region, Iraq 3
Department of Software Engineering, Faculty of Computing, Universiti Teknologi Malaysia, Johor Bahru, Malaysia 4
College of Computer Science and Engineering, Taibah University, Medina, Saudi Arabia 5
Information Systems Department, Faculty of Computing,
Universiti Teknologi Malaysia, 81310 Johor Bahru, Johor, Malaysia
Article history
Received: 18-4-2018 Revised: 28-5-2018 Accepted: 19-6-2018 Corresponding Author: Shilan S. Hameed, Department of Software Engineering, Faculty of Engineering, Koya University, Koya, Kurdistan Region, Iraq
Email:
Faisal Saeed,
College of Computer Science and Engineering, Taibah University, Medina, Saudi Arabia
Email: [email protected]
Abstract: In this study, a three-phase hybrid approach is proposed for the selection and classification of high dimensional microarray data. The method uses Pearson’s Correlation Coefficient (PCC) in combination with Binary Particle Swarm Optimization (BPSO) or Genetic Algorithm (GA) along with various classifiers, thereby forming a PCC-BPSO/GA-multi classifiers approach. As such, five various classifiers are employed in the final stage of the classification. It was noticed that the PCC filter showed a remarkable improvement in the classification accuracy when it was combined with BPSO or GA. This positive impact was seen to be varied for different datasets based on the final applied classifier. The performance of various combination of the hybrid technique was compared in terms of accuracy and number of selected genes. In addition to the fact that BPSO is working faster than GA, it was noticed that BPSO has better performance than GA when it is combined with PCC feature selection.
Keywords: Pearson’s Correlation Coefficient, BPSO, GA, Hybrid, Microarray
Introduction
Advances in microarray technology and the need of analyzing gene expression have stimulated a shining road of research in bioinformatics, biotechnology, cancer informatics and similar fields (Bolón-Canedo et al., 2014). The microarray data holds information about how the genes are expressed. By analyzing these data, one can find the altered genes, thereby facilitating easy diagnosis and classification of the genetic-related diseases. Consequently, biologists can perform cost-effective and efficient studies upon the altered genes when few number of selected genes are targeted (Cosma et al., 2017). Prediction and classification of cancer types is a great challenge in the medical sector.
Gene expression profiles play a vital role in this regard. However, because of the existence of small number of samples compared with the large number of genes, many computational methods are failed to identify a small subset of important genes in microarray
data, which ultimately increases the challenge of microarray analysis (Singh and Sivabalakrishnan, 2015). Furthermore, microarray data usually contains redundant and irrelevant features (genes). These features can significantly increase the computational burden (Wang, 2012). The redundant features do not contribute to modeling a better predictor because the information they provide is basically presented by other feature(s) (Song et al., 2013).
2013; Hira and Gillies, 2015; Singh and Sivabalakrishnan, 2015). These methods are categorized based on their criteria of using learning algorithm. The filter selection method chooses variables regardless of the used model and it works by suppressing variables that are least interesting. The non-suppressed variables will be part of a regression or a classification model which is used for the classification or prediction of data (Hira and Gillies, 2015). As filter techniques are not applied to build predictors (Lazar et al., 2012), the classifier accuracy becomes lower if the results of these filters are directly given to the learning algorithm (Hira and Gillies, 2015). Taking the distributed data into consideration, filters are divided among parametric and nonparametric methods (Hameed et al., 2018).
Parametric filters assume equal distribution of samples in different classes, such ANOVA, chi-squared and Bayesian (Saeys et al., 2007). However, this assumption cannot be guaranteed in most datasets. Therefore, the utilization of non-parametric methods might yield a better result when there is uncertainty regarding the dataset distribution. Examples of non-parametric filters are Relief-F, Information gain, Correlation coefficient (Pearson) and Gain ratio. Pearson Correlation Coefficient (PCC) is utilized to determine interrelation between the features and to investigate the correlation between classes (Hall, 1999). In the wrapper-based feature selection, the evaluation is performed on subsets of the variables, through which the possible communications between the variables can be observed. This is achieved by using the classifier accuracy (Saeys et al., 2007). Wrappers choose the best subset of features that gives highest accuracy to the model. The result of this selection usually consists of fewer number of features with robust discriminative power (Xiong et al., 2001). In addition, wrappers are classifier dependent and hence the same result is not guaranteed when another classifier is applied (Lazar et al., 2012; Santana and de Paula Canuto, 2014). Furthermore, the overall performance of wrappers is decreased and may lead to over fitting if they are directly applied on the data without using any pre-processing step (Bolón-Canedo et al., 2014). Hybrid approaches are established based on the useful combination of filter and wrapper algorithms (Alba et al., 2007; Hameed et al., 2017; Lu et al., 2017). Hence, the disadvantages of filters and wrappers can be overcome through using a hybrid technique. Conventional optimization algorithms are not efficiently working in the feature selection of large scale problems (Chen et al., 2012).
Alternatively, different meta-heuristic algorithms have been adapted for feature selection issues. Examples of these algorithms are Genetic Algorithm (GA) (Latkowski and Osowski, 2015), Ant Colony Optimization (Chen et al., 2010), Simulated Annealing (Gonzalez-Navarro and Belanche-Muñoz, 2014) and
Particle Swarm Optimization (PSO) (Ardjani et al., 2010; Tran et al., 2014).
Problems in high-dimensional data analysis have motivated the researchers to search for possible solutions and propose viable algorithms. A novel Markov Blanket-Embedded Genetic Algorithm (MBEGA) was proposed for gene selection problem (Zhu et al., 2007). The embedded Markov blanket-based memetic operators add or delete features (genes) from a Genetic Algorithm (GA) solution so as to quickly improve the solution and fine-tune the search. A modified Support Vector Machine (SVM) was also suggested to select the minimum possible genes (Ghaddar and aoum-Sawaya, 2018). Multi-objective version of bat algorithm for binary feature selection (Dashtban et al., 2018) and Genetic Bee Colony (GBC) algorithm (Alshamlan et al., 2015) were successfully utilized in high dimensional datasets. Moreover, a hybrid feature selection algorithm was proposed that combines the Mutual Information Maximization (MIM) and the Adaptive Genetic Algorithm (AGA) (Lu et al., 2017). The reduced gene expression dataset presented higher classification accuracy compared with conventional feature selection algorithms. In order to improve classification accuracy, further study has been made to utilize a hybrid form of filter and wrapper, consisting of information gain and standard genetic algorithm (Maldonado et al., 2014). Besides, a binary version of Black Hole Algorithm called BBHA was proposed for solving feature selection problem in biological data. However, the tested classifiers were under tree family and other kinds of classifiers were not assessed (Pashaei and Aydin, 2017). Along this line, the assessment of different classifiers such as Artificial Neural Network (ANN) (Aziz et al., 2017) and fuzzy decision tree algorithm (Ludwig et al., 2018) has been made upon microarray data.
Optimization (iBPSO) using Naive-Bayes as the only classifier. In the current research work, a three-phase hybrid form of filter-wrappers-multi classifiers is proposed aiming at performing effective selection and classification task in the high dimensional microarray data. Pearson Correlation Coefficient (PCC) in combination with binary form of PSO (BPSO) or Genetic Algorithm (GA) are utilized in the feature selection process, while five various classifiers are being employed in the final stage of classification. As such, the proposed PCC-BPSO-multi classifier and PCC-GA- multi classifier are applied to eleven microarray datasets and their results are compared with each other.
Methodology
Datasets
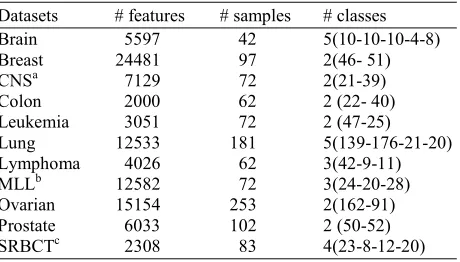
In this study, eleven high dimensional microarray datasets for different types of disease are used. They include Brain cancer, Breast cancer, Central Nervous System cancer, Colon cancer, Leukemia cancer, Lung cancer, Lymphoma cancer, MLL cancer, Ovarian Cancer, Prostate Cancer and SRBCT, as shown in Table 1. Brain cancer microarray dataset has 42 patient samples with tumors consist of 10 medulloblastomas, 5 Central Nervous System (CNS) with Atypical Teratoid (AT)/Rhabdoid Tumors (RT), 5 renal and extrarenal rhabdoid tumors, 8 supratentorial Primitive Neuroectodermal Tumors (PNETs), 10 non-embryonal brain tumors and 4 normal human cerebella. The initial oligonucleotide microarrays contain 6817 genes. They were pre-processed with thresholding (Dettling and Bühlmann, 2002). Hence, the remaining genes are 5597 for the complete dataset with five different sample classes. The Leukemia cancer dataset was generated from a gene expression study in two types of acute leukemia: Acute Myeloid Leukemia (AML) and, Acute Lymphoblastic Leukemia (ALL). The levels of gene expression were measured using Affymetrix high-density oligonucleotide arrays which consist of 6817 genes, although this was reduced to 3051 genes and further analyzed by Golub et al. (1999). The dataset consists of 25 cases of AML and 47 cases of ALL (38 B-cell ALL and 9 T-cell ALL). The dataset was further pre-processed by Dudoit et al. (2002). Lymphoma microarray dataset is achieved from (Dettling and Bühlmann, 2002). It has 4026 genes and 62 samples. The data samples are mainly from 3 different adult lymphoid malignancies, where 42 samples represent the diffuse large B-cell lymphoma (DLBCL), 9 from Follicular Lymphoma (FL) and 11 of Chronic Lymphocytic Leukemia (CLL). The colon cancer microarray dataset was originally analyzed by Alon et al. (1999). The original authors of the dataset performed treatment on the raw data from the Affymetrix oligonucleotide arrays. The dataset is consisting of normal and tumor tissue samples.
Table 1: The detailed characteristics of the utilized datasets Datasets # features # samples # classes Brain 5597 42 5(10-10-10-4-8) Breast 24481 97 2(46- 51) CNSa 7129 72 2(21-39) Colon 2000 62 2 (22- 40) Leukemia 3051 72 2 (47-25) Lung 12533 181 5(139-176-21-20) Lymphoma 4026 62 3(42-9-11) MLLb 12582 72 3(24-20-28) Ovarian 15154 253 2(162-91) Prostate 6033 102 2 (50-52) SRBCTc 2308 83 4(23-8-12-20) a. Central Nervous system
b. Mixed lineage leukemia c. Small-round-blue-cell tumor
The total number of samples are 62 and total gene numbers after pre-processing given by previous authors is 2000. The prostate cancer dataset consists of 102 patterns of gene expression, where 50 of the samples are normal prostate specimens and the other 52 are tumors. This microarray dataset is based on oligonucleotide microarray and consists of approximately 12600 genes. After pre-processing the remaining number of genes in the dataset is 6033 (Díaz-Uriarte and De Andres, 2006). Small Round Blue-Cell Tumor (SRBCT) microarray dataset has four different classes which originally had 6567 genes and 63 samples. Where, 23 samples are from EWS, 20 from RMS, 12 from NB and 8 samples from NHL. After pre-processing the genes are reduced to 2308.This dataset is achieved from (Díaz-Uriarte and De Andres, 2006). The rest of the datasets (Breast, CNS, Lung and MLL) were achieved from (Zhu et al., 2007). The main characteristics of the datasets are given in Table 1.
Pearson Correlation Coefficient (PCC)
The Pearson correlation coefficient, also known as r, R, or Pearson's r, is defined as the strength and direction measure of the linear dependency (correlation) between two features. It can be defined as the covariance of the variables divided by the product of their standard deviations (Benesty et al., 2009). PCC requires all features to be of the same type, hence a discretization pre-processing step is required (Hall, 1999; Huertas and Juárez-Ramírez, 2014). It was originally developed by Karl Pearson based on the idea of Francis Galton who discovered it in 1888 (Stigler, 1989).
Particle Swarm Optimization (PSO)
In PSO, individual particles are moving in the search space and they are communicating with each other via iterations in order to search for optimal solutions (Tran
et al., 2014). If a search space of D-dimensions is
assumed, then the ith swarm particle can have a D-dimensional position vector represented by Xi = [1, 2,...; ]. Therefore, the velocity of the ith particle is denoted by Vi= [1, 2,...; ]. It is considered that the best visited position, which produces the best fitness value for the particle, is PBi= [ 1, 2,...; ], while the best explored position so far is GB = [ 1, 2,...; ]. In this way, the velocity of each particle is updated by the following equation:
(
)
( )
(
)
1 1 2 2 . ( ) new old id idold old old old
id id d i
V wV c rand
x pb x c rand x gb x
= + …
− + … − (1)
Where:
d = 1, 2,………… D
c1 = Cognitive learning factor
c2 = The social learning factor
c1 and c2 = Positive constants with values ranging from
0 to 4
The inertia weight (w) in “Equation 1” acts to gradually reduce the particles velocity and hence controlling the swarms. The value of w is usually located between 0.4 and 0.9, whereas the random variables rand1 and rand2 are uniformly distributed
between 0 and 1 (Tran et al., 2014). As such, the velocities of particles are bounded within [vmin, vmax].
The vector function of velocity is holding by these bounds, that is to avoid the very sharp movement of particles in the search space. The formula which is used to update the particles position is represented by:
new old new
id id id
x = x + v (2)
Where:
d = 1, 2,……… D i = 1, 2, ………. N N = The size of the swarms
A modified version of the standard PSO, known as binary PSO (BPSO), was also introduced by Kennedy and Eberhart (1997) in order to handle discrete variables. When BPSO is applied for feature selection, a feature subset is represented by a string vector of n binary bits Xi = (x1, x2,...xn) comprising of ’0’ and ’1’.
Consequently, if xid is ’0’, then the d th
feature is not selected in this subset, while xid of ’1’ is alternatively
chosen in the subset. In this regard, each binary string vector (Xi) defines the particle position in BPSO. When
GBPSO is utilized for the feature selection purpose, the genes are represented by a binary vector. The selected
gene is denoted by 1, while the non-selected gene is encoded by 0. For instance, a particle with seven features is encoded as ‘0100010’, implying that the second and sixth features are selected. Therefore, initially the length of each particle is the same as the number of genes in the dataset. Moreover, in the traditional BPSO the dimension of each particle is updated using function 3.2 [21, 45];
( )
( )
0,11, 0, new i new i
if sigmoid rand x otherwise ν > = (3)
The fitness function in BPSO is employed as an evaluator to choose the best feature subsets. The subset of particles that are giving best fitness values are recorded to maintain a better solution at given population. Consequently, the best subset of genes which provides better accuracy can be recalled. This process is applied in 10-fold cross validation, such that all the training set is used in the determination of the best genes. The inclusion of each gene in the best set is based on the number of repeatability of that gene out of the whole number of folds. Here, the maximum repeatability number is set to 10, so few number of genes with high accuracy are most probably to be imported into the selected set of genes.
Genetic Algorithm
classification accuracy of SVM. The 10-CV classification accuracy is adopted with the gene subset on the training samples. The higher the 10-CV classification accuracy provides the better gene subset. Ultimately, the gene subset with the highest 10-CV classification accuracy is considered as the optimal gene subset (Huerta et al., 2006).
Classifiers
In this study, a group of well-known classifiers are applied. The choice of various classifiers is due to the fact that there is no any specific algorithm to work perfectly for all datasets and not all algorithms work in the same way on a dataset. The applied classifiers are Bayes Net (BN), K-Nearest Neighbor (KNN), Naïve Bayes (NB), Random Forest (RF) and Support Vector Machine (SVM). The accuracy of all classifiers is measured based on 10-folds cross validation. This is to make sure that each dataset is equally participated in the training and testing process.
Experimental Design
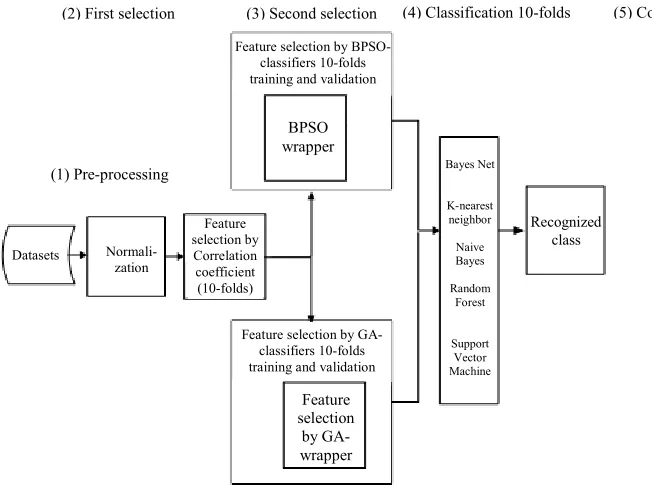
Figure 1 shows the complete methodology that was carried out to implement the current work, while the detailed description of the experimental procedures is given below:
• In the first step of analysis, the datasets were filtered using Pearson Correlation Coefficient
(PCC) method in 10 runs. This is to ensure that the whole dataset is passed through this phase and the reduction result is accurate enough at this stage. Different thresholds were tested for considering the number of the filtered genes. This has been made manually by setting the number of genes to 100 and 200 alternatively and automatically by the method itself based on the most attributed gene. Selection set of 100 genes was considered as it was found that the accuracy and performance of the classifier performed better compared to that of the 200 selected genes • Because of the data filtration, the datasets were
reduced to be tested against the applied classifiers. This was done in order to compare the performance of the dataset with the one before filtration
• The reduced/filtered datasets were again purified by another step of feature selection. BPSO and GA were comparably used as a hybrid method with different classifiers, in which the fitness function was derived from the classification algorithms. This was performed in 10-folds cross validation in order to confirm that the whole dataset is used in the training and testing phases. After the application of this step, the datasets were further reduced to be tested by the same classifiers
• The classification results are compared with each other as well as with the results of the previous step. It is fair to mention that the same fitness function was used for each of the BPSO and GA algorithms
Fig. 1: The experimental design that was used to implement the current work
(3) Second selection
(2) First selection (4) Classification 10-folds (5) Comparison
Feature selection by BPSO-classifiers 10-folds training and validation
BPSO wrapper
Feature selection by Correlation coefficient (10-folds)
Normali-zation Datasets
(1) Pre-processing
Recognized class
Feature selection by GA-classifiers 10-folds training and validation
Feature selection
by GA-wrapper
Bayes Net
K-nearest neighbor
Naive Bayes
Random Forest
Results and Discussion
In the first stage of analysis, the accuracy of the classifiers applied on the original datasets was evaluated. In each classifier, a 10-fold cross validation was applied on the training and testing partitions. Table 2 illustrates the results that were obtained in this stage. It can be seen that Support Vector Machine has presented the highest classification accuracy among all the other classifiers.
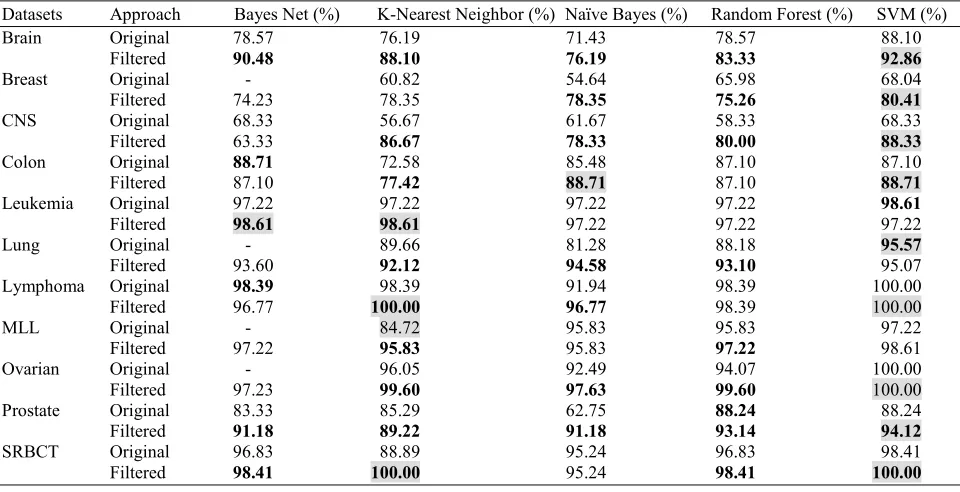
The features of the datasets were ranked using PCC filter feature selection method using 10-fold cross validation. Thus, the features are ordered based on the ranking results. To avoid over fitting in the next steps of feature selections (wrapper), possibly due to having low number of samples, the first 100 important attributes were selected. Subsequently, these features were used by the five classifiers. The results of the classifiers performance are tabulated in Table 3. Results in bold indicate the best performed classifier for each specific dataset. The methods highlighted in grey show the best approach for each dataset. The dashed cells indicate that
the method is not appropriate for application. The results show that generally the accuracy of the classifiers on the filtered dataset performed better results when compared with those applied directly on the original datasets. However, there are some cases with few classifiers in which the accuracy on the original dataset is better. It was noticed that Bayes net classifier was not working on some of the original datasets, while for the filtered datasets did not show problem. This is because those datasets were having some properties that Bayes net is unable to handle them. This shows one of the differences between our proposed method and others. In other works, only one classifier is applied, while in the current work multiple classifiers are utilized to show the quality of each of them and to follow that rule saying (not all classifiers are best for same dataset and not one classifier is best for all datasets). Moreover, in our work, 11 different high dimensional datasets are applied against the method. This is to show the applicability of our proposed methods, which again confirms the viability of the proposed method.
Table 2: Accuracy of Classifiers with Original Dataset
Datasets Bayes Net (%) K-Nearest Neighbor (%) Naïve Bayes (%) Random Forest (%) Support Vector Machine (%) Brain 78.57 76.19 71.43 78.57 88.10
Breast - 60.82 54.64 65.98 68.04
CNS 68.33 56.67 61.67 58.33 68.33
Colon 88.71 72.58 85.49 87.10 87.10 Leukemia 97.22 97.22 97.22 97.22 98.61
Lung - 89.66 81.29 88.18 95.57
Lymphoma 98.39 98.39 91.94 98.39 100.00
MLL - 84.72 95.83 95.83 97.22
Ovarian - 96.05 92.49 94.07 100.00
Prostate 83.33 85.29 62.75 88.24 88.24
SRBCT 96.83 88.89 95.24 96.83 98.41 Table 3: The accuracy of the classifiers against original datasets and after the application of PCC filter
Datasets Approach Bayes Net (%) K-Nearest Neighbor (%) Naïve Bayes (%) Random Forest (%) SVM (%) Brain Original 78.57 76.19 71.43 78.57 88.10
Filtered 90.48 88.10 76.19 83.33 92.86
Breast Original - 60.82 54.64 65.98 68.04 Filtered 74.23 78.35 78.35 75.26 80.41
CNS Original 68.33 56.67 61.67 58.33 68.33 Filtered 63.33 86.67 78.33 80.00 88.33
Colon Original 88.71 72.58 85.48 87.10 87.10 Filtered 87.10 77.42 88.71 87.10 88.71
Leukemia Original 97.22 97.22 97.22 97.22 98.61
Filtered 98.61 98.61 97.22 97.22 97.22 Lung Original - 89.66 81.28 88.18 95.57
Filtered 93.60 92.12 94.58 93.10 95.07 Lymphoma Original 98.39 98.39 91.94 98.39 100.00 Filtered 96.77 100.00 96.77 98.39 100.00 MLL Original - 84.72 95.83 95.83 97.22 Filtered 97.22 95.83 95.83 97.22 98.61 Ovarian Original - 96.05 92.49 94.07 100.00
Filtered 97.23 99.60 97.63 99.60 100.00 Prostate Original 83.33 85.29 62.75 88.24 88.24
Filtered 91.18 89.22 91.18 93.14 94.12
In the next step, wrapper feature selection was applied to all eleven datasets. This was applied on the reduced dataset with 100 attributes that were selected by the PCC filter method, which is considered as a hybrid method (BPSO-Classifier and GA-Classifier). In this step, all the datasets are further reduced by (BPSO-Classifier and GA-(BPSO-Classifier), which is repeated for all classifiers. This is because wrapper is classifier dependent. It is not perfect idea to apply a classifier on a reduced dataset when its features are selected using another classifier. Thus, we considered this fact and feature selection is done using all classifiers separately.
After the feature selection by BPSO-Classifier in this phase, the datasets are further reduced based on the selected genes. Table 4 illustrates the better performance of the hybrid feature selection method (BPSO-Classifier) on the reduced high dimensional datasets. It is noticeable that the accuracy of all classifiers is improved compared with their accuracy on the filtered datasets, as shown in Table 3. This indicates that the feature selection by BPSO not only improved the efficiency of the classification process but also its accuracy is enhanced.
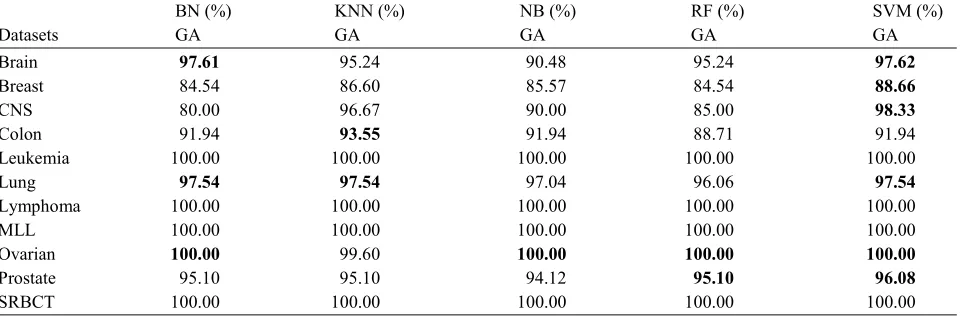
To see how GA is working as a feature selection, it is also applied on the same filtered datasets using the same
fitness function as used for BPSO. The datasets are reduced based on the selected features (genes) by each GA-Classifier. Again, all classifiers are used with GA as feature selection, separately. Then, the classifiers are applied on the reduced datasets to see the effect of this phase. It is clear that the classifier’s accuracy is improved compared with the one of the filtered datasets, as shown in Table 5.
Here, we have clearly noticed that BPSO was generally better than GA in terms of accuracy of the classifiers after selection process, as it is illustrated in Table 6.
This is also in agreement with the results reported previously that PSO can outperform GA when it comes to feature selection (Hameed et al., 2017; Hassan et al., 2005). Bold classification accuracies indicate better performance for same classifier and same dataset but different selection method. Grey highlighted method shows the winner or the best approach of selection.
Furthermore, the number of selected genes by each method is compared. It is worth to mention that in this study more attention is given to achieving high accuracy rather than achieving fewest number of genes. The number of selected genes is tabulated in Table 7. From the table, we can notice in general that BPSO has selected fewer number of genes compared to that of GA.
Table 4: The accuracy of the classifiers after the application of BPSO-Classifier
Datasets Bayes Net (%) K-Nearest Neighbor (%) Naïve Bayes (%) Random Forest (%) Support Vector Machine (%) Brain 97.62 97.62 92.86 85.71 97.62
Breast 86.60 87.63 88.66 85.57 90.72
CNS 78.33 95.00 93.33 86.67 98.33
Colon 93.55 93.55 91.94 91.94 91.94 Leukemia 100.00 100 .00 100.00 100.00 100.00 Lung 97.04 96.06 98.03 96.06 97.04 Lymphoma 100.00 100.00 100.00 100.00 100.00
MLL 100.00 98.61 98.61 100.00 100.00
Ovarian 100.00 100.00 100.00 100.00 100.00 Prostate 95.10 96.08 96.08 95.10 97.06
SRBCT 100.00 100.00 100.00 100.00 100.00
Table 5: The accuracy of the classifiers after the application of GA-Classifier
BN (%) KNN (%) NB (%) RF (%) SVM (%)
Datasets GA GA GA GA GA
Brain 97.61 95.24 90.48 95.24 97.62
Breast 84.54 86.60 85.57 84.54 88.66
CNS 80.00 96.67 90.00 85.00 98.33
Colon 91.94 93.55 91.94 88.71 91.94 Leukemia 100.00 100.00 100.00 100.00 100.00 Lung 97.54 97.54 97.04 96.06 97.54
Lymphoma 100.00 100.00 100.00 100.00 100.00 MLL 100.00 100.00 100.00 100.00 100.00 Ovarian 100.00 99.60 100.00 100.00 100.00
Prostate 95.10 95.10 94.12 95.10 96.08
Table 6: Comparison between BPSO and GA selection methods in terms of the number of selected genes
Bayes K-Nearest Naïve Random Support
Net (%) Neighbor (%) Bayes (%) Forest (%) Vector Machine (%) --- --- --- --- --- Datasets BPSO GA BPSO GA BPSO GA BPSO GA BPSO GA Brain 33 40 36 42 27 33 36 39 13 40 Breast 41 52 33 51 36 34 34 30 41 38
CNS 32 42 46 48 28 38 40 50 39 48 Colon 23 28 36 47 21 23 39 47 25 29 Leukemia 17 19 17 25 27 29 28 26 18 35 Lung 63 39 47 34 39 38 36 29 40 42 Lymphoma 28 29 20 21 19 30 30 34 30 39 MLL 34 40 26 33 26 39 38 44 40 22
Ovarian 21 20 15 11 18 20 19 22 17 22 Prostate 24 40 15 29 22 27 26 35 33 26 SRBCT 25 35 17 24 22 27 19 25 19 20
Table 7: Comparison between BPSO and GA selection methods in terms of accuracy
Bayes K-Nearest Naïve Random Support Vector Net (%) Neighbor (%) Bayes (%) Forest (%) Machine (%) --- --- --- --- --- Datasets BPSO GA BPSO GA BPSO GA BPSO GA BPSO GA Brain 97.62 97.62 97.62 95.24 92.86 90.48 85.71 95.24 97.62 97.62 Breast 86.60 84.54 87.63 86.60 88.66 85.57 85.57 84.54 90.72 88.66 CNS 78.33 80.00 95.00 96.67 93.33 90.00 86.67 85.00 98.33 98.33 Colon 93.55 91.94 93.55 93.55 91.94 91.94 91.94 88.71 91.94 91.94 Leukemia 100.00 100.00 100.00 100.00 100.00 100.00 100.00 100.00 100.00 100.00 Lung 97.04 97.54 96.06 97.54 98.03 97.04 96.06 96.06 97.04 97.54
Lymphoma 100.00 100.00 100.00 100.00 100.00 100.00 100.00 100.00 100.00 100.00 MLL 100.00 100.00 98.61 100.00 98.61 100.00 100.00 100.00 100.00 100.00 Ovarian 100.00 100.00 100.00 99.60 100.00 100.00 100.00 100.00 100.00 100.00 Prostate 95.10 95.10 96.08 95.10 96.08 94.12 95.10 95.098 97.06 96.08 SRBCT 100.00 100.00 100.00 100.00 100.00 100.00 100.00 100.00 100.00 100.00
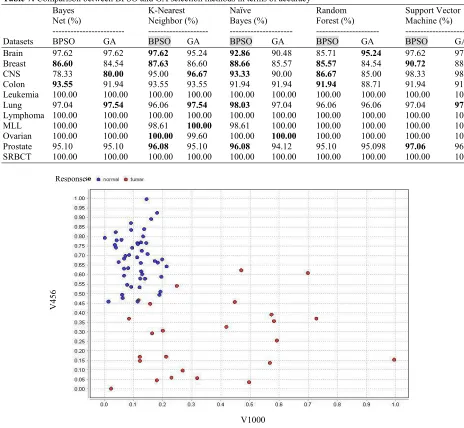
Fig. 2: The Scatter plot for two representative random selected genes of Leukemia dataset after the application of BPSO-SMO
V
4
5
6
V1000
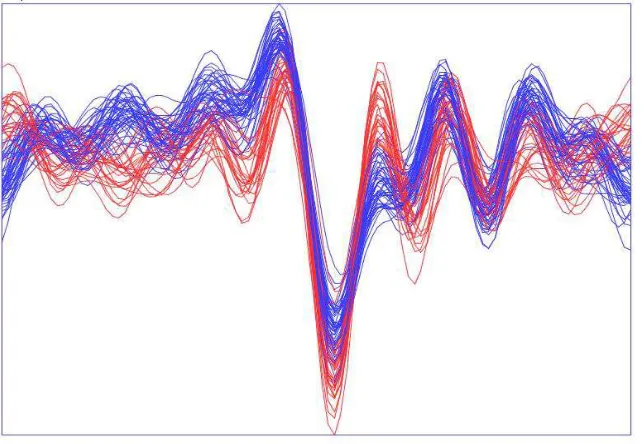
Moreover, it was seen that BPSO is performing faster than GA. The final dataset generated by BPSO and GA are illustrated in scatter plot for two representative random genes for Leukemia dataset in Fig. 2 and 3, respectively. For further demonstration, the Andrews plot is carried out for all selected genes by BPSO and GA, as shown in Fig. 4 and 5. This analysis is performed for worst dataset among them which is Breast dataset. This is
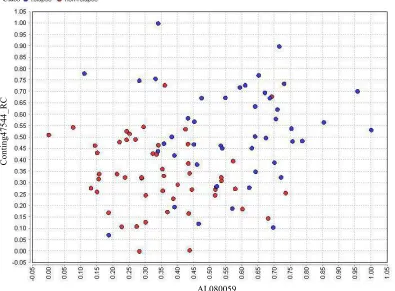
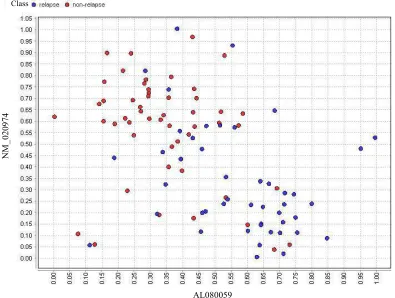
to show the quality of the applied methods even in worst case. The scatter plots for two representative genes of the final Breast dataset, which are selected by BPSO and GA, are illustrated in Fig. 6 and 7, respectively.
It was concluded that the performance of the proposed method, in terms of accuracy and efficiency, is better than other methods reported in literature (Dash, 2018; Gonzalez-Navarro and Belanche-Muñoz, 2014).
Fig. 3: The scatter plot for two representative selected genes of Leukemia dataset after the application of GA-SMO
Fig. 4: The Andrews graph representing the selected genes of Leukemia dataset after the application of BPSO-SMO
V
9
1
8
V1001
Fig. 5: The Andrews graph representing the selected genes of Leukemia dataset after the application of GA-SMO
Fig. 6: The scatter plot for two representative selected genes of Breast dataset after the application of BPSO-SMO
C
o
n
ti
n
g
4
7
5
4
4
_
R
C
AL080059
Fig. 7: The scatter plot for two representative selected genes of Breast dataset after the application of GA-SMO
Conclusion
High dimensional datasets such as gene expression datasets are characterized by high number of genes (aka features) with few number of samples. That means they need special and careful analysis. Bioinspired and evolutionary algorithms such as BPSO and GA are tremendously used in the field of machine learning and data mining in different forms. In this study, these two methods were successfully applied in a hybrid wrapper form after the application of filter feature selection. The proposed method was composed of three-phase hybrid form of filter-wrappers-multi classifiers, in which Pearson correlation coefficient (PCC) in combination with binary form of PSO (BPSO) or Genetic Algorithm (GA) were utilized in the feature selection process, while five various classifiers were employed in the final stage of classification. It was noticed that filter feature selection has a remarkable impact on the classification accuracy. This positive impact was seen to be improved when the filtered datasets are reduced by each of BPSO and GA algorithms with different classifiers. Later on, their performances are compared in terms of accuracy and number of selected genes. In addition to the fact that BPSO is working faster than GA, it was noticed that BPSO has better performance than GA.
Acknowledgement
The authors are thankful to the Ministry of Higher Education (MOHE) and the Research Management Centre (RMC) at the Universiti Teknologi Malaysia (UTM) for their support under the Research University Grant Category (VOT Q.J130000.2528.16H74).
Funding Information
This work is supported by the Ministry of Higher Education (MOHE) and the Research Management Centre (RMC) at the Universiti Teknologi Malaysia (UTM) under the Research University Grant Category (VOT Q.J130000.2528.16H74)
Author’s Contributions
Shilan S. Hameed: Data curation, Formal analysis, writing original draft, Methodology and Software.
Shilan S. Hameed, Fahmi F. Muhammad: Investigation.
Shilan S. Hameed. Fahmi F. Muhammad, Faisal Saeed and Rohayanti Hassan: Validation.
Shilan S. Hameed: Shilan S. Hameed, Fahmi F. Muhammad, Rohayanti Hassan and Faisal Saeed: Writing, review and editing.
N
M
_
0
2
0
9
7
4
AL080059
Ethics
There are no ethical issues that may arise after the publication of this manuscript.
Conflict of Interest
The authors declare that there is no conflict of interest regarding the publication of this work.
References
Alba, E., J. Garcia-Nieto, L. Jourdan and E.G. Talbi, 2007. Gene selection in cancer classification using PSO/SVM and GA/SVM hybrid algorithms. Proceedings of the IEEE Congress on Evolutionary Computation, Sept. 25-28, IEEE Xplore press, Singapore. DOI:10.1109/CEC.2007.4424483 Alon, U., N. Barkai, D.A. Notterman, K. Gish and S.
Ybarra et al., 1999. Broad patterns of gene expression revealed by clustering analysis of tumor and normal colon tissues probed by oligonucleotide arrays. Proce. National Academy Sci., 96: 6745-6750. DOI:10.1073/pnas.96.12.6745
Alshamlan, H.M., G.H. Badr and Y.A. Alohali, 2015. Genetic Bee Colony (GBC) algorithm: A new gene selection method for microarray cancer classification. Computational Biology Chemistry, 56: 49-60.
DOI: 10.1016/j.compbiolchem.2015.03.001
Ardjani, F., K. Sadouni and M. Benyettou, 2010. Optimization of SVM multiclass by particle swarm (PSO-SVM). Proceedings of the 2nd International Workshop on Database Technology and Applications, Nov. 27-28, IEEE Xplore press, Wuhan, China. DOI:10.1109/DBTA.2010.5658994 Aziz, R., C.K. Verma, M. Jha and N. Srivastava, 2017.
Artificial neural network classification of microarray data using new hybrid gene selection method. Int. J. Data Mining Bioinform., 17: 42-65. DOI:10.1504/IJDMB.2017.084026
Benesty, J., J. Chen, Y. Huang and I. Cohen, 2009. Pearson correlation coefficient. In: Noise reduction in speech processing. Springer.
Bolón-Canedo, V., N. Sánchez-Maroño and A. Alonso-Betanzos, 2013. A review of feature selection methods on synthetic data. Knowl. Inform. Syst., 34: 483-519. DOI: 10.1007/s10115-012-0487-8 Bolón-Canedo, V., N. Sánchez-Marono, A.
Alonso-Betanzos, J.M. Benítez and F. Herrera, 2014. A review of microarray datasets and applied feature selection methods. Information Sci., 282: 111-135. DOI: 10.1016/j.ins.2014.05.042
Chandra Sekhara Rao Annavarapu, S.D. and H. Banka, 2016. Cancer microarray data feature selection using multi-objective binary particle swarm optimization algorithm. EXCLI J., 15: 460.
DOI: 10.17179/excli2016-481
Chen, L.F., C.T. Su, K.H. Chen and P.C. Wang, 2012. Particle swarm optimization for feature selection with application in obstructive sleep apnea diagnosis. Neural Computing Applications, 21: 2087-2096. DOI: 10.1007/s00521-011-0632-4 Chen, Y., D. Miao and R. Wang, 2010. A rough set
approach to feature selection based on ant colony optimization. Pattern Recognition Lett., 31: 226-233. DOI:10.1016/j.patrec.2009.10.013
Conilione, P. and D. Wang, 2005. A comparative study on feature selection for E. coli promoter recognition. Int. J. Inf. Technol, 11: 54-66.
DOI: 10.1.1.115.5595
Cosma, G., D. Brown, M. Archer, M. Khan and A.G. Pockley, 2017. A survey on computational intelligence approaches for predictive modeling in prostate cancer. Expert Systems Applications, 70: 1-19.
DOI: 10.1016/j.eswa.2016.11.006
Dash, R., 2018. An adaptive harmony search approach for gene selection and classification of high dimensional medical data. J. King Saud University-Computer and Information Sciences.
Dashtban, M., M. Balafar and P. Suravajhala, 2018. Gene selection for tumor classification using a novel bio-inspired multi-objective approach.
Genomics, 110: 10-17.
DOI:10.1016/j.ygeno.2017.07.010
Dettling, M. and P. Bühlmann, 2002. Supervised clustering of genes. Genome Biology.
DOI: 10.1186/gb-2002-3-12-research0069
Díaz-Uriarte, R. and S.A. De Andres, 2006. Gene selection and classification of microarray data using random forest. BMC Bioinformatics, 7: 3.
DOI: 10.1186/1471-2105-7-3
Dudoit, S., J. Fridlyand and T.P. Speed, 2002. Comparison of discrimination methods for the classification of tumors using gene expression data. J. Am. Statistical Association, 97: 77-87.
DOI: 10.1198/016214502753479248
Ghaddar, B. and J. Naoum-Sawaya, 2018. High dimensional data classification and feature selection using support vector machines. Eur. J. Operational Res., 265: 993-1004.
DOI: 10.1016/j.ejor.2017.08.040
Goldberg, D.E. and J.H. Holland, 1988. Genetic algorithms and machine learning. Machine Learning, 3: 95-99.
DOI: 10.1023/A:1022602019183
Golub, T.R., D.K. Slonim, P. Tamayo, C. Huard and M. Gaasenbeek et al., 1999. Molecular classification of cancer: Class discovery and class prediction by gene expression monitoring. Science, 286: 531-537. DOI: 10.1126/science.286.5439.531
Hall, M.A., 1999. Correlation-based feature selection for machine learning. Citeseerx.
Hameed, S.S., O.O. Petinrin and A. Osman, 2018. Filter-wrapper combination and embedded feature selection for gene expression data. Int. J. Advance Soft Compu. Appl.
Hameed, S.S., R. Hassan and F.F. Muhammad, 2017. Selection and classification of gene expression in autism disorder: Use of a combination of statistical filters and a GBPSO-SVM algorithm. PLOS ONE, 12: e0187371. DOI: 10.1371/journal.pone.0187371 Hira, Z.M. and D.F. Gillies, 2015. A review of feature
selection and feature extraction methods applied on microarray data. Advances Bioinformatics.
DOI: 10.1155/2015/198363
Huerta, E.B., B. Duval and J.K. Hao, 2006. A hybrid GA/SVM approach for gene selection and classification of microarray data. Applications of Evolutionary Computing.
Huerta, E.B., B. Duval and J.K. Hao, 2006. A Hybrid GA/SVM Approach for Gene Selection and Classification of Microarray Data. In: Applications of Evolutionary Computing, Rothlauf, F. (Ed.), Springer, Berlin, Heidelberg.
Huertas, C. and R. Juárez-Ramírez, 2014. Filter feature selection performance comparison in high-dimensional data: A theoretical and empirical analysis of most popular algorithms. Proceedings of the 17th International Conference on Information Fusion, July 7-10, IEEE Xplore press, Salamanca, Spain.
Jain, I., V.K. Jain and R. Jain, 2018. Correlation feature selection based improved-Binary Particle Swarm Optimization for gene selection and cancer classification. Applied Soft Computing, 62: 203-215. DOI: 10.1016/j.asoc.2017.09.038
Kar, S., K. Das Sharma and M. Maitra, 2015. Gene selection from microarray gene expression data for classification of cancer subgroups employing PSO and adaptive K-nearest neighborhood technique. Expert Systems Applications, 42: 612-627.
DOI: 10.1016/j.eswa.2014.08.014
Kennedy, J. and R.C. Eberhart, 1997. A discrete binary version of the particle swarm algorithm. Proceedings of the IEEE International Conference on Systems, Man and Cybernetics, Computational Cybernetics and Simulation, Oct. 12-15, IEEE Xplore press. DOI: 10.1109/ICSMC.1997.637339 Latkowski, T. and S. Osowski, 2015. Data mining for
feature selection in gene expression autism data. Expert Systems Applications, 42: 864-872.
DOI: 10.1016/j.eswa.2014.08.043
Lazar, C., J. Taminau, S. Meganck, D. Steenhoff and A. Coletta et al., 2012. A survey on filter techniques for feature selection in gene expression microarray analysis. IEEE/ACM Trans. Computational Biology Bioinformatics, 9: 1106-1119.
DOI: 10.1109/TCBB.2012.33
Lu, H., J. Chen, K. Yan, Q. Jin and Y. Xue et al., 2017. A hybrid feature selection algorithm for gene expression data classification. Neurocomputing. Ludwig, S.A., S. Picek and D. Jakobovic, 2018.
Classification of Cancer Data: Analyzing Gene Expression Data Using a Fuzzy Decision Tree Algorithm. In: Operations Research Applications in Health Care Management, C. Kahraman and Y.I. Topcu (Eds.), Cham: Springer International Publishing, pp: 327-347.
Pashaei, E. and N. Aydin, 2017. Binary black hole algorithm for feature selection and classification on biological data. Applied Soft Computing, 56: 94-106. DOI: 10.1016/j.asoc.2017.03.002
Saeys, Y., I. Inza and P. Larrañaga, 2007. A review of feature selection techniques in bioinformatics. Bioinformatics, 23: 2507-2517.
DOI: 10.1093/bioinformatics/btm344
Santana, L.E.A.D.S. and A.M. de Paula Canuto, 2014. Filter-based optimization techniques for selection of feature subsets in ensemble systems. Expert Syst. Applications, 41: 1622-1631.
DOI: 10.1016/j.eswa.2013.08.059
Singh, R.K. and M. Sivabalakrishnan, 2015. Feature selection of gene expression data for cancer classification: A review. Procedia Computer Sci., 50: 52-57. DOI: 10.1016/j.procs.2015.04.060 Song, Q., J. Ni and G. Wang, 2013. A fast
clustering-based feature subset selection algorithm for high-dimensional data. IEEE Trans. Knowledge Data Eng., 25: 1-14. DOI: 10.1109/TKDE.2011.181 Stigler, S.M., 1989. Francis Galton's account of the
invention of correlation. Statistical Sci., 2: 73-79. Tran, B., B. Xue and M. Zhang, 2014. Improved PSO
for Feature Selection on High-Dimensional Datasets. In: Simulated Evolution and Learning, Dick, G. (Ed.), Lecture Notes in Computer Science, Springer, Cham.
Wang, L., 2012. Feature selection in bioinformatics. Proceedings of the Independent Component Analyses, Compressive Sampling, Wavelets, Neural Net, Biosystems and Nanoengineering X. May 10, SPIE. DOI: 10.1117/12.921417
Xiong, M., X. Fang and J. Zhao, 2001. Biomarker identification by feature wrappers. Genome Res., 11: 1878-1887. DOI: 10.1101/gr.190001
Zhu, Z., Y.S. Ong and M. Dash, 2007. Markov blanket-embedded genetic algorithm for gene selection. Pattern Recognition, 40: 3236-3248.
DOI: 10.1016/j.patcog.2007.02.007