Abstract--In this paper, a novel readout approach for the Hamiltonian Path Problem (HPP) in DNA computing based on the real-time polymerase chain reaction (PCR) is proposed. Based on this approach, real-time amplification was performed with the TaqMan probes and the TaqMan detection mechanism was exploited for the design and development of the proposed readout approach. The readout approach consists of two phases: real-time amplification in vitro using TaqMan-based real-time PCR, followed by information processing in silico to assess the results of real-time amplification, which in turn, enables the extraction of the Hamiltonian path. In this paper, instead of using manual clustering of two different reactions in real-time PCR, a computer system is developed such that the clustering can be done automatically. This clustering process can be done quickly based on the number of nodes in the HPP problems and the TaqMan reactions and the data obtained previously is used to extract the correct Hamiltonian path.
Keywords:--DNA Computing, Real-Time PCR, DNA Engine Opticon 2 System, TaqMan probes.
I. INTRODUCTION
INCE the discovery of the polymerase chain reaction (PCR) [1], numerous applications have been explored, primarily in the life sciences and medicine, and importantly, in DNA computing as well. The subsequent innovation of real-time PCR has rapidly gained popularity and plays a crucial role in molecular medicine and clinical diagnostics [2]. All real-time amplification instruments require a fluorescence reporter molecule for detection and quantitation, whose signal increase is proportional to the amount of amplified product. Although a number of reporter molecules currently exist, it has been found that the
This work is supported by Fundamental Research Grant Scheme (FRGS) - An Improved Output Visualization of DNA Computation Based on Real-Time Polymerase Chain Reaction from the Ministry of Higher Education (MOHE) and eScienceFund (Vot 79033) from the Ministry of Science, Technology, and Inovation (MOSTI).
Muhammad Faiz Mohamed Saaid is with the Faculty of Electrical Engineering, Universiti Teknologi Malaysia, 81310 UTM Skudai, Johor Darul Takzim, Malaysia (e-mail: [email protected]).
Zuwairie Ibrahim is with the Centre for Artificial Intelligence and Robotics (CAIRO), Universiti Teknologi Malaysia, 81310 UTM Skudai, Johor Darul Takzim, Malaysia (e-mail : [email protected]).
mechanism of the TaqMan hydrolysis probe is very suitable for the design and development of a readout method for DNA computing, and is thus selected for the current study.
A TaqMan DNA probe is a modified, nonextendable dual-labeled oligonucleotides. The 5’ and 3’ ends of the oligonucleotide are terminated with an attached reporter, such as FAM, and quencher fluorophores dyes, such as TAMRA, respectively, as shown in Fig. 1 [3]. Upon laser excitation at 488 nm, the FAM fluorophore, in isolation emits fluorescence at 518 nm. Given proximity of the TAMRA quencher, however, based on the principle of fluorescence resonance energy transfer (FRET), the excitation energy is not emitted by the FAM fluorophore, but rather is transferred to TAMRA via the dipole-dipole interaction between FAM and TAMRA. As TAMRA emits this absorbed energy at significantly wavelengths (580 nm), the resulting fluorescence is not observable in Channel 1 of real-time PCR instruments [4].
The combination of dual-labeled TaqMan DNA probes with forward and reverse primers is a must for a successful real-time PCR. As PCR is a repeated cycle of three steps (denaturation, annealing, and polymerization), a TaqMan DNA probe will anneal to a site within the DNA template in between the forward and reverse primers during the annealing step, if a subsequence of the DNA template is complementary to the sequence of the DNA probe. During polymerization, Thermus aquaticus (Taq) DNA polymerase will extend the primers in a 5’ to 3’ direction. At the same time, the Taq polymerase also acts as a ‘‘scissor’’ to degrade the probe via cleavage, thus separating the reporter from the quencher, as shown in Fig. 2 [5], where R and Q denote the reporter dye and quencher dye, respectively. This separation subsequently allows the reporter to emit its fluorescence [6]. This process occurs in every PCR cycle and does not interfere with the exponential accumulation of PCR product. As a result of PCR, the amount of DNA template increases exponentially, which is accompanied by a proportionate increase in the overall fluorescence intensity emitted by the reporter group of the excised TaqMan probes. Hence, the intensity of the measured fluorescence at the end of each PCR polymerization is correlated to the total amount of PCR product, which can then be detected, using a real-time PCR instrument for visualization.
In Silico
Information Processing for DNA
Computing Readout Method based on DNA
Engine Opticon 2 System
Muhammad Faiz Mohamed Saaid and Zuwairie Ibrahim
S
The 5th Student Conference on Research and Development –SCOReD 2007
Fig. 1. Illustration of the structure of a TaqMan DNA probe. Here, R and Q denote the reporter and quencher fluorophores, respectively
Fig. 2. Degradation of a TaqMan probe, via cleavage by DNA polymerase
In this paper, we analyze the result from the implementation of readout approach of HPP computation, based on DNA computing, which uses real-time PCR. The readout approach consist of in vitro-in silico phases. In the in vitro phase, O(|V|2)
TaqMan-based real-time PCR reactions are performed in parallel, to investigate the ordering of pairs of nodes in the Hamiltonian path of a |V|-node instance graph, in terms of relative distance from the DNA sequence encoding the known start node. The resulting relative orderings are then processed in silico, which efficiently returns the complete Hamiltonian path.
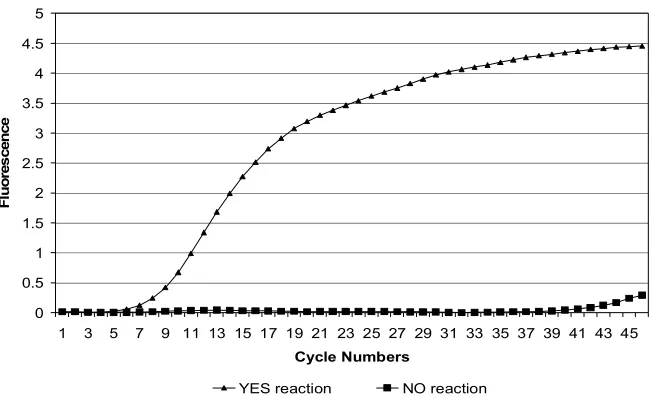
As shown in Fig. 3, the output of the real-time PCR consist of two kinds of reactions, namely ‘‘YES’’ reaction and ‘‘NO’’ reaction. For an effective in silico information processing, the amplification response for the ‘‘YES’’ reactions and ‘‘NO’’ reactions should be distinguished. By using DNA Engine Opticon 2 System, these two reactions are clearly separated. Based on the previous result, a computerized method is developed to cluster the ‘‘YES’’ and ‘‘NO’’ reaction automatically. A software called SilicoIn is developed and able to implement the in silico information processing during the in silico phase of readout approach in order to cluster the ‘‘YES’’ and ‘‘NO’’ reaction, based on the result imported from DNA Engine Opticon 2 System.
II. NOTATION AND BASIC PRONCIPLE
First of all, v1(a)v2(b)v3(c)v4(d) denotes a double-stranded DNA (dsDNA) which contains the base-pairs subsequences, v1, v2, v3, and v4, respectively. Here, the subscripts in parenthesis (a, b, c, and d) indicate the length of each respective base-pair subsequence. For instance, v1(20) indicates that the length of the double-stranded subsequence, v1 is 20 base-pairs (bp). When convenient, a dsDNA may also be represented without indicating segment lengths (e.g.,
v1v2v3v4).
A reaction denoted by TaqMan(v0,vk,vl) indicates that
real-time PCR is performed using forward primer v0, reverse
primer vl, and TaqMan probe vk . Based on the proposed approach, there are two possible reaction conditions regarding the relative locations of the TaqMan probe and reverse primer. In particular, the first condition occurs when the TaqMan probe specifically hybridizes to the template, between the forward and reverse primers, while the second occurs when the reverse primer hybridizes between the forward primer and the TaqMan probe. As shown in Fig. 3, these two conditions would result in different amplification patterns during real-time PCR, given the same DNA template (i.e., assuming that they occurred separately, in two different PCR reactions). The higher fluorescent output of the first condition is a typical amplification plot for real-time PCR. In contrast, the low fluorescent output of the second condition reflects the cleavage of a few of the TaqMan probes via DNA polymerase due to the ‘unfavourable’ hybridization position of the reverse primer. Thus, TaqMan(v0,vk,vl) = YES if an amplification plot similar to
the first condition is observed, while TaqMan(v0,vk,vl) = NO
if an amplification plot similar to the second condition is observed.
III. REAL-TIME PCR-BASED READOUT APPROACH
Let the output of an in vitro computation of an HPP instance of the input graph be represented by a 140-bp dsDNA v0(20)v1(20)v4(20)v2(20)v5(20)v3(20)v6(20), where the Hamiltonian path V0•V1•V4•V2•V5•V3•V6, begins at node V0, ends at node V6, and contains intermediate nodes V1, V4, V2,
V5, and V3, respectively. Note that in practice, only the identities of the starting and ending nodes, and the presence of all intermediate nodes will be known in advance to characterize a solving path. The specific order of the intermediate nodes within such a path is unknown.
The first part of the proposed approach, which is performed in vitro, consists of [(|V|-2)2-(|V|-2)]/2 real-time PCR reactions, each denoted by TaqMan(v0,vk,vl) for all k and l, such that 0 < k < |V|-2, 1 < l < |V|-1 , and k < l. For this example instance, so that the DNA template is dsDNA v0v1v4v2v5v3v6, these 10 reactions, along with the expected output in terms of ‘‘YES’’ or ‘‘NO’’ are as follows:
(1) TaqMan(v0,v1,v2) = YES
(2) TaqMan(v0,v1,v3) = YES
(3) TaqMan(v0,v1,v4) = YES
(4) TaqMan(v0,v1,v5) = YES
(5) TaqMan(v0,v2,v3) = YES
(6) TaqMan(v0,v2,v4) = NO
(7) TaqMan(v0,v2,v5) = YES
(8) TaqMan(v0,v3,v4) = NO
(9) TaqMan(v0,v3,v5) = NO
0 0.5 1 1.5 2 2.5 3 3.5 4 4.5 5
1 3 5 7 9 11 13 15 17 19 21 23 25 27 29 31 33 35 37 39 41 43 45 Cycle Numbers
F
lu
o
res
cen
ce
YES reaction NO reaction
Fig. 3. An example of reaction plots corresponding to TaqMan(v0,vk,vl) = YES (first condition) and TaqMan(v0,vk,vl) = NO (second condition).
Note that the overall process consists of a set of parallel real-time PCR reactions, and thus requires O(1) laboratory steps for in vitro amplification. The accompanying SPACE complexity, in terms of the required number of tubes is
O(|V|2).Clearly, only one forward primer is required for all
real-time PCR reactions, while the number of reverse primers and TaqMan probes required with respect to the size of input graph are each |V|-3.
After all real-time PCR reactions are completed, the in vitro output is subjected to an algorithm for in silico
information processing, producing the satisfying Hamiltonian path of the HPP instance in O(n2) TIME (here, n denotes vertex number) as follows:
Input: A[0…|V|-1]=2 // A[2, 2, 2, 2, 2, 2, 2] A[0]=1, A [|V|-1]=|V| // A[1, 2, 2, 2, 2, 2, 7] for k=1 to |V|-3
for l=2 to |V|-2 while l>k
if TaqMan(v0,vk,vl) = YES A[l] = A[l]+1 else A[k] = A[k]+1 endif
endwhile endfor endfor
It is assumed that a Hamiltonian path is stored in silico, in an array (e.g., A[0…|V|-1]), for storage, information retrieval, and processing, such that A[i]
∈
A returns the exact location of a node, Vi∈
V,in the Hamiltonian path. Based onthe proposed algorithm, and the example instance, the input array A is first initialized to A = {1, 2, 2, 2, 2, 2, 7}. During the loop operations of the algorithm, the elements A[0]
∈
A and A[|V|-1]∈
A, are not involved, as those two elements may conveniently be initialized to the correct values, as the distinguished starting and ending nodes of the Hamiltonianpath are known in advance. The loop operations are thus strictly necessary only for the remaining elements A[1,2,3…, |V|-2]
∈
A. Again, for the example instance, the output of the in silico information processing is A = {1, 2, 4, 6, 3, 5, 7}, which represents the Hamiltonian pathV0
→
V1→
V4→
V2→
V5→
V3→
V6. For instance, in this case, it is indicated that V3 is the sixth node in the Hamiltonian path, since A[3] = 6, etc.IV. EXPERIMENTS
In this study, the experiment consists of two phases: preparation of input molecules and the real time PCR experiment.
A. Preparation of Input Molecules
A pool of 140-bp input molecules
v0(20)v1(20)v4(20)v2(20)v5(20)v3(20)v6(20) is prepared, via standard
protocol of parallel overlap assembly (POA) of single-stranded DNA strands (ssDNAs). For this purpose, 13 ssDNAs are required, including additional ssDNAs, which act as link sequences for self-assembly. These strands are listed in Table 1. After completion, amplification via PCR was performed using the same protocol as POA. The forward primers and reverse primers used for the PCR reaction were 5’-CGTCAAGGCCGTCTCTATAT-3’ and 5’-GTAGATTAAGAAGGTGCGCG-3’, respectively.
Fig. 4. Gel image for the preparation of input molecules. Lane M denotes a 20-bp molecular marker, lane 1 is the product of initial pool generation based on parallel overlap assembly, and lane 2 is the amplified PCR product
B. Real-Time Experiments
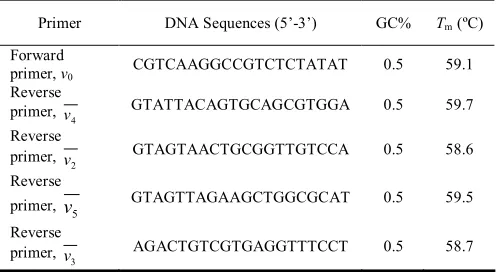
The real-time PCR reaction involves primers (Sigma Genosys, Japan), TaqMan probes (Sigma Genosys, Japan), and QuantiTect Probe PCR Kit (QIAGEN, Japan). The sequences for forward primers, reverse primers, and TaqMan probes are listed in Tables 2 and Table 3. QuantiTect Probe PCR Kit essentially contains 3 vials of 2x Master Mix and 2 vials of RNase-free Water. The master mix contains HotStarTaq® DNA Polymerase, QuantiTect Probe PCR Buffer, dNTP mix including dUTP, ROX™ (passive reference dye), and 8 mM MgCl2.
For real-time PCR, as recommended by the manufacturer, the final concentration of primers should be 0.4 µM, whereas the final concentration of the DNA probes should be between 0.1-0.2 µM. In this study, the maximum final concentration of probe, which is 0.2 µM, was chosen and prepared. The real-time PCR was performed on a DNA Engine Opticon® 2 System (MJ Research, USA) where amplification is carried out in a 50 µl tube. Each tube contains 25 µl 2x PCR Master Mix, 0.4 µl forward primer, 0.4 µl reverse primer, 0.4 µl probe, 2 µl template, and 21.8 µl
RNase-free Ultrapure Water.
Ten separate real-time PCR reactions were performed in parallel, in order to implement the first stage of the proposed HPP readout. After the initial activation step at 95ºC for 15 minutes, the amplification consists of 45 cycles of denaturation and annealing/extension, performed at 94ºC for 15 s and 60ºC for 60 s, respectively. The resulting real-time PCR amplification plots are illustrated in Fig. 5.
V. IN SILICO INFORMATION PROCESSING
The in silico information processing consists of several steps. The results of clustering process were used to identify the Hamiltonian Path. The algorithm for the in silico information processing was implemented in the SilicoIn software to obtain the Hamiltonian path automatically.
A. Exporting Data
The data from DNA Engine Opticon 2 System can be exported by clicking the export data on the software. From the data, only the FAM reading was selected to be exported into the SilicoIn software, since the FAM emission reading is the actual result of TaqMan reaction shown in Fig 5. The exporting process was done after the in vitro phase is already completed. This exported data were written in the text file format, which show the fluorescence intensity from the first to the 46th thermal cycle for all 10 different TaqMan reactions.
TABLE I
THE REQUIRED SINGLE-STRANDED DNAS FOR THE GENERATION OF INPUT MOLECULES.
Name DNA Sequences (5’-3’) Length
v0 CGTCAAGGCCGTCTCTATAT 20
v1 CCACTGGTTCTGCATGTAAC 20
v4 TCCACGCTGCACTGTAATAC 20
v2 TGGACAACCGCAGTTACTAC 20
v5 ATGCGCCAGCTTCTAACTAC 20
v3 AGGAAACCTCACGACAGTCT 20
v6 CGCGCACCTTCTTAATCTAC 20
v0v1 GAACCAGTGGATATAGAGACGGCCTTGACG 30
v1v4 GCAGCGTGGAGTTACATGCA 20
v4v2 CGGTTGTCCAGTATTACAGT 20
v2v5 GCTGGCGCATGTAGTAACTG 20
v5v3 GAGGTTTCCTGTAGTTAGAA 20
v3v6 GTAGATTAAGAAGGTGCGCGAGACTGTCGT 30
TABLE II
SEQUENCES FOR FORWARD PRIMER AND REVERSE PRIMERS EMPLOYED FOR THE REAL-TIME PCR
Primer DNA Sequences (5’-3’) GC% Tm (ºC)
Forward
primer, v0 CGTCAAGGCCGTCTCTATAT 0.5 59.1 Reverse
primer, v4 GTATTACAGTGCAGCGTGGA 0.5 59.7
Reverse primer,
2
v GTAGTAACTGCGGTTGTCCA 0.5 58.6
Reverse
primer, v5 GTAGTTAGAAGCTGGCGCAT 0.5 59.5 Reverse
primer, 3
v AGACTGTCGTGAGGTTTCCT 0.5 58.7
TABLE III
SEQUENCES FOR TAQMAN DUAL-LABELED PROBES
TaqMan Probes Sequences
B. Clustering Algorithm
Based on the several results of the real-time PCR experiments, the algorithm to clustering the TaqMan reactions can be formularized by setting a threshold value to distinguish between “YES” and “NO” reactions. At the end of the real-time PCR, it appears that the reading of “NO” reactions are always below than 1. From these observations, the threshold of 1 seems meaningful as the “YES” reactions and the “NO” reactions can be separated clearly. Note that, the default setting for the DNA Engine Opticon 2 should be used. The result of clustering process can be viewed on the
SilicoIn software that groups the data into two sets of data. Then, the algorithm for the in silico information processing is implemented to determine the Hamiltonian Path automatically.
VI. DISCUSSION
As discussed previously, in the in vitro phase of the readout approach, each real-time PCR reaction is mapped to a binary output (i.e., either ‘‘YES’’ or ‘‘NO’’), based on the occurrence or absence of an exponential amplification. Given the existence of this mapping, the subsequent in silico information processing is capable of determining the
Hamiltonian path of the input instance (e.g., V0•V1•V4•V2•V5•V3•V6, for the example instance).
The amplification responses observed in this study differ from the amplification responses which are typically obtained in the life sciences and medicine. In particular, while in life science and medical applications, the initial copy number of the DNA template is normally very low, in the current study the input molecule is actually a DNA
species extracted from a polyacrylamide gel, which exists at a high concentration. That is the main reason why the amplification signals in the current study appeared more rapidly than normal.
The SilicoIn software was developed to clustering the TaqMan reactions. At the moment, this software is able to analyze only 7 nodes of HPP. As shown in Fig 6, the exported data can be plotted back in this software to visualize the difference betweens the ‘‘YES’’ and ‘‘NO’’ reaction and to cluster the TaqMan reactions. The algorithm to obtain the Hamiltonian Path is also implemented in this software.
VII. CONCLUSION
This research offers an improved in vitro-in silico implementation of real-time PCR-based readout approach for DNA computing, which is implemented on DNA Engine Opticon 2 System. According to the experimental results, the amplification response for ‘‘YES’’ and ‘‘NO’’ reactions can be clearly distinguished. The in silico information of the real-time PCR readout method is computerized in the SilicoIn software to cluster the TaqMan reactions in order to obtain the Hamiltonian path automatically. Improvements in in silico information processing via SilicoIn software for example, are needed to solve various kind of weighted graph problem such as the Traveling Salesman Problem (TSP) and the shortest path problem, implemented based on DNA computing . Study on real-time PCR for applications in DNA computing could increase the performance of output visualization based on the DNA Engine Opticon 2 System.
0 1 2 3 4 5 6
1 3 5 7 9 11 13 15 17 19 21 23 25 27 29 31 33 35 37 39 41 43 45
Cycle Numbers
F
lu
o
re
scen
ce
Reaction 1 Reaction 2 Reaction 3 Reaction 4 Reaction 5 Reaction 6 Reaction 7 Reaction 8 Reaction 9 Reaction 10
Fig. 5. Output of real-time PCR. Reactions 1 to 10 indicate the [(|V|-2)2-(|V|-2)]/2 TaqMan(v
0,vk,vl) reactions of the input instance, as defined in Section 3.
Fig. 6. The clustering process and the Hamiltonian Path computed in SilicoIn
VIII. ACKNOWLEDGMENT
Zuwairie Ibrahim is very grateful to Ritsumeikan Asia Pacific University (APU) for kindly granting a research subsidy to support his expenses during laboratory experimental work at APU.
IX. REFERENCES
[1] K. Mullis (1986),“Specific enzymatic amplification of DNA in vitro: the
polymerase chain reaction”. Cold Spring Harbor Symposium on
Quantitative Biology 51: 263-273
[2] L. Overbergh (2003),“The use of real-time reverse transcriptase PCR for
the quantification of cytokine gene expression.” Journal of
Biomolecular Techniques 14: 33-43
[3] N.J. Walker (2002),”A technique whose time has come.” Science 296:
557-559
[4] J.R. Lakowicz (1999),”Principles of fluorescence spectroscopy”, 2nd Ed., Kluwer Academic/Plenum Publishers, New York
[5] C.A. Heid (1996),”Real-time quantitative PCR.” Genome Research 6:
986-994
[6] P.M. Holland(1991),”Detection of specific polymerase chain reaction product by utilizing the 5’•3’ exonuclease activity of termus aquaticus
DNA polymerase.” Proceedings of the National Academy of Sciences of
the United States of America 88: 7276-7280
[7] Zuwairie Ibrahim, John A. Rose, Yusei Tsuboi, Osamu Ono, and Marzuki Khalid. “A New Readout Approach in DNA Computing Based on Real-Time PCR with TaqMan Probes”, Lecture Notes in Computer Science (LNCS), Springer-Verlag, C. Mao and T. Yokomori (Eds.), Vol. 4287, 2006, pp. 350-359
Muhammad Faiz Mohamed Saaid received the B.Eng (Mechatronics) from Universiti Teknologi Malaysia in 2007. He is currently working towards the M.Eng degree at the Universiti Teknologi Malaysia. His current research interests are DNA computing and real-time PCR. He is a recipient of the Best Instrumentation Paper Award of the International Conference on Control, Instrumentation, and Mechatronics Engineering (CIM2007).
Zuwairie Ibrahim holds PhD (DNA Computing)
from Meiji University, Japan in 2006. He also received the B.Eng (Mechatronics) and M.Eng. (Image Processing) degrees, both from Universiti Teknologi Malaysia, in 2000 and 2002, respectively. He is with the Department of Mechatronics and Robotics, Faculty of Electrical Engineering, Universiti Teknologi Malaysia, as a Lecturer. His research interests include unconventional computation such as molecular or DNA computing as well as image processing, particularly in automated visual inspection for industrial applications. He is an author/co-author of almost 50 publications in national/international journals and conferences. Also, he has contributed his
research work in a book entitled Unconventional Computing 2005: From

![Fig. 5. Output of real-time PCR. Reactions 1 to 10 indicate the [(|V|-2)2-(|V|-2)]/2 TaqMan(v0,vk,vl) reactions of the input instance, as defined in Section 3](https://thumb-us.123doks.com/thumbv2/123dok_us/1292501.1161790/5.612.147.478.437.682/output-reactions-indicate-taqman-reactions-instance-defined-section.webp)

