R E S E A R C H
Open Access
Probabilistic analysis of system outage in
distributed antenna systems with composite
channels
Jie Cai
1*, Xibin Zhao
1, Jinyuan Wang
2and Ming Gu
1Abstract
Distributed antenna systems (DAS) play a key role in future wireless communications. Despite the increasing previous research work, the channel models of DAS lack generality. This paper presents a holistic and generic channel model, which incorporates path loss, lognormal shadowing, and generalized-gamma fast fading into consideration. This overarching composite channel model encompasses well-known composite channel models as special cases. A probabilistic system outage model is attained by selective transmission scheme in terms of the proposed channel model and the distribution of mobile stations in the cell. Experimental results substantiate that the theoretical model provides sufficient precision for evaluating the outage performance of DAS.
Keywords: Distributed antenna system, Generic channel model, Outage probability analysis, Selective transmission scheme
1 Introduction
Due to the limited wireless resources, the transmission distance cannot be too large if the transmission rate is very large. To have a reasonable coverage area, antennas that are centrally attached to the base station in co-located antenna systems should be distributed throughout the cell so that the access distance for mobile stations (MSs) can be shortened. Such a system is called a dis-tributed antenna system (DAS). Extensive studies have shown that DAS can enhance coverage, improve capac-ity, reduce outage, etc. [1-3]. Without any doubt, DAS will become a very promising candidate in future wireless communications.
Recently, the channel modeling and performance anal-ysis of DAS have drawn significant attention. Assuming that the path loss is a constant, both the uplink and downlink capacities of DAS were investigated in [4]. This assumption is not always reasonable because the distances from the MS to each distributed antenna are usually dif-ferent. Therefore, the path loss cannot be ignored. Zhu [5]
*Correspondence: [email protected]
1Key Laboratory for Information System Security of Ministry of Education, School of Software, Tsinghua University, Beijing 100084, China Full list of author information is available at the end of the article
analyzed the spectrum efficiency of DAS, but the shadow-ing was ignored. Due to the large space among distributed antennas, it is not reasonable to assume that all anten-nas experience the same shadowing. Nikolopoulos et al. [6] investigated the narrowband fading in indoor DASs, which only considered the fast fading. However, exper-imental measurements have shown that fast fading and shadowing occur simultaneously in practical systems [7]. Therefore, composite channel models should be consid-ered for performance analysis. Furthermore, [8] investi-gated the channel model which combines the fast fading and lognormal shadowing effects. Then, [9-11] consid-ered channel models which take path loss, lognormal shadowing, and Rayleigh fading into account. Chen et al. [12] and de Lima et al. [13] analyzed the system perfor-mance of DAS over composite shadowed-Nakagami-m fading channels. Although [9-13] considered composite channels, the fast fading was modeled by Rayleigh and Nakagami-m, which are special cases of the generalized-gamma distribution [14], and thus, the derived results lack generality.
In addition to the channel model, the distribution of MS is another important factor that should be consid-ered. As is well known, the distribution of MS has strong
impact on system performance. However, some previous works assumed that the position of MS is pre-given, so they did not consider the impact of the position of MS on system performance [10,12]. The other previous stud-ies assumed that the MS is uniformly distributed in the cell [15-17]. However, for some scenarios, such as dense urban scenario, office building scenario, et al., the dis-tribution of the MS may form a hot zone, and thus, the uniform distribution of MS may not always be a prac-tical situation. Therefore, it is of interest and necessary to study the impact of the distribution of MS on system performance.
Motivated by the aforementioned literatures, we present a new composite channel model for DAS in this paper, which is represented as a mixture of path loss, lognor-mal shadowing, and generalized-gamma fast fading. The channel model in this paper is a generic model that cov-ers many well-known composite channel models, such as Nakagami-lognormal, Rayleigh-lognormal, and Weibull-lognormal. Based on this channel model, the probabil-ity densprobabil-ity function (PDF) of the output signal-to-noise ratio (SNR) is derived. After that, we analyze the out-age probability for the MS over a given position by selective transmission (ST) scheme. Furthermore, consid-ering the distribution of MS in the system, an approxi-mate theoretical expression of system outage probability is derived.
The remainder of this paper is organized as fol-lows. System model is described in Section 2. In Section 3, an approximate expression of system out-age probability is derived. Numerical results are pre-sented in Section 4 before conclusions are drawn in Section 5.
2 System model
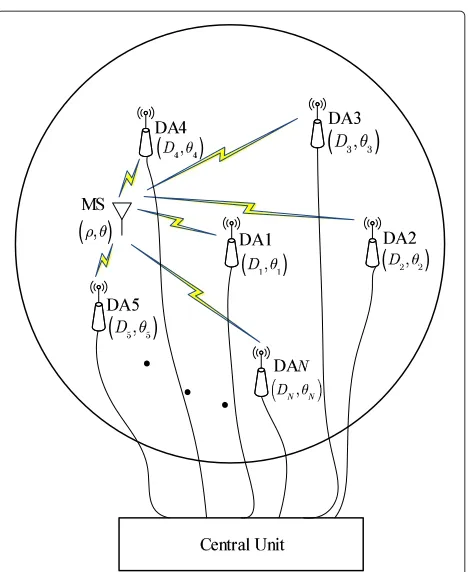
Consider a DAS with a single cell whose covering area is a circle with radius R, as shown in Figure 1. The distributed antennas are arbitrarily distributed in the cov-erage of the cell, denoted as DAi (i = 1, 2,· · ·,N), and are connected to a central unit via fiber optics. Only one antenna is employed at the MS. The positions of the MS and the DAi are denoted by the polar coordinates (ρ,θ )and(Di,θi), respectively. When the reference point is chosen to be the cell center, ρ, Di and θ, θi are the distances and angles of the MS and the DAito the cell center.
Without the loss of generality, this paper focuses on the uplink transmission. Mathematically, for all DAi (i = 1, 2,· · ·,N), the received uplink signals from the MS located at(ρ,θ )can be expressed as
Y=y1,y2,· · ·,yN T
=√E[h1,h2,· · ·,hN]Tx+Z∈CN×1,
(1)
(
)
(
)
(
)
(
)
(
)
(
)
Figure 1Structure of a distributed antenna system.
where theith element ofY,yi, denotes the received sig-nal at the DAi,Eis the transmit signal power of the MS,
hirepresents the channel fading between the MS and the DAi,xis the transmit symbol of the MS with unit energy,
Zis the complex white Gaussian noise vector with zero mean and varianceN0.
Generally, the evaluation for channel fading hi is dis-cussed in [18]. In this paper, we follow their idea and evaluatehiby the following formula:
hi =Gi
Li(ρ,θ )·i, ∀i∈ {1, 2,· · ·,N}, (2)
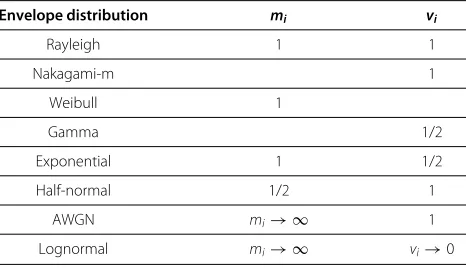
whereGidenotes the fast fading between the DAiand the MS. Assuming that the envelope ofGiundergoes an inde-pendent but not identical generalized-gamma distribution [14]
f|Gi|
g= 2vimi
mig2mivi−1
(mi)
exp−mig2vi
, g ≥0, (3)
Table 1 Some special cases of generalized-gamma distribution
Envelope distribution mi vi
Rayleigh 1 1
in Equation (2) denotes the path loss between DAi and (ρ,θ ), and it can be derived by [19]
where d0 is the reference distance, βi is the path loss exponent, di(ρ,θ ) denotes the distance between DAi and the MS, which can be expressed as di(ρ,θ ) =
ρ2+D2i −2ρDicos(θ−θi).
In addition,i in Equation (2) represents the shadow fading, and it can be modeled by a lognormal distribution [7] and standard deviation of 10log10ω.
From Equations (1) and (2), the output SNR at DAican be obtained as
Based on the definition for γi, its PDF could be com-puted. The following lemma gives the analytic form of
fγi.
Lemma 2.1. Let Si=ELi(ρ,θ ) i/N0in Equation (7), the
PDF ofγican be expressed as
whereμ˜i(ρ,θ )=μi+10log10[ELi(ρ,θ ) /N0].
The proof of Lemma 2.1 can be found in the ‘Appendix’ section.
3 System outage probability analysis
Assuming that the ST scheme is applied, i.e., only one link is selected for transmission to maximize the output SNR
γ =max{γ1,γ2,· · ·,γN}. (8)
Owing to the large space among distributed antennas, it is reasonable to assume all the links between distributed antennas and the MS undergo independent shadowing and fast fading, i.e.,γi in Equation (8) is independent of γj
i=j. Accordingly, the outage probability for the MS located at(ρ,θ )can be obtained as
whereγthis the threshold of SNR. Basically, the formula above states that the value ofδ(ρ,θ )is determined by the probability of each Pr(γi< γth)and the latter one could be estimated as in the following theorem.
Theorem 3.1. The outage probability between the MS and the DAiPr(γi< γth)can be expressed as
where tnand Hnare the base points and weight factors of the Np-order Hermite polynomial, respectively.
The proof of Theorem 3.1 can be found in the ‘Appendix’ section.
Note that the outage probability in Equation (11) is a function of the position of MS. Theoretically, the system outage probability also relates to the distribution of the MS in the cell. Assuming that r(ρ,θ ) (in polar coordi-nates) is the PDF that used to describe the distribution of the MS in the cell, the system outage probability can be expressed as
Pout=Eρ,θ[δ (ρ,θ )]= 2π
0
R
0
δ (ρ,θ )r(ρ,θ ) ρdρdθ.
(12)
Since the distribution of the MS is arbitrary, the expres-sion in Equation (12) is complex and usually has no closed-form solution. By employing the composite Simp-son’s rule [20], the final uplink system outage probability can be derived as
Pout∼=
hk
9 P
p=0 Q
q=0
cp,qρpr
ρp,θq
δρp,θq
, (13)
where the two even number P and Q are chosen to determine the step sizesh=R/Pandk=2π/Q, respec-tively. In addition,ρp = ph,(p=0, 1, 2,· · ·,P)andθq = qk,(q=0, 1, 2,· · ·,Q). The weigh factor cp,q is the ele-ment of matrix C, in the (p+1)th row and (q+1)th column. The matrixCcan be found in [20].
4 Numerical results
In this section, we will verify the accuracy of the approx-imate expression of system outage probability by Monte Carlo simulations. Without the loss of generality, a single-cell DAS with a radius ofRis used as the test system. In the system, one antenna is located in the center of the cell, and other antennas are evenly and symmetrically placed on a circle with a radius of 2R/3. For the sake of simplic-ity, some parameters are assumed to be the same, i.e.,β = βi,σ =σi, m=mi, μ=μi, v=vifori=1, 2,· · ·,N.
Furthermore, to describe the non-uniformity of the MS in the cell, we divide the whole cell into two regions, as shown in Figure 2. Region 1 (denoted as1) is the circular area, which is in the center of the cell and with a radius of
Rh, and the residual annular zone is region 2 (denoted as 2). Therefore, the PDF for describing the distribution of the MS in the cell can be supposed as
r(ρ,θ )=
λ
Sh (ρ,θ )∈1 1−λ
S−Sh (ρ,θ )∈2
, (14)
whereSh = πR2his the area of region 1 whileS = πR2is the area of the whole cell.λ∈[0, 1] is the probability that the MS distributed in region 1. It can be observed that, whenλ = Sh/S, the MS in the cell follows uniform dis-tribution; when λ > Sh/S, region 1 is the hot zone, the probability of the MS which located in region 1 increases;
Figure 2The distribution of MSs in the cell.
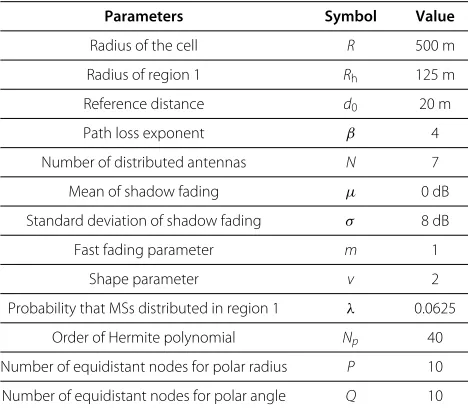
whenλ < Sh/S, the probability of the MS which located in region 2 increases. In addition, the main simulation parameters are listed in Table 2.
Figures 3, 4, 5, 6 and 7 show the system outage prob-ability versus the transmit SNR (E/N0) in different sce-narios. Obviously, with the increase of the transmit SNR, the received SNR will increase, and thus, the system outage probability will decrease. Specifically, Figure 3 shows the system outage probability versus transmit SNR (E/N0) with different numbers of distributed antennas (N). Obviously, the system outage probability drops with the increase ofN. When the value ofNis larger, a higher
Table 2 Main simulation parameters
Parameters Symbol Value
Radius of the cell R 500 m
Radius of region 1 Rh 125 m
Reference distance d0 20 m
Path loss exponent β 4
Number of distributed antennas N 7
Mean of shadow fading μ 0 dB
Standard deviation of shadow fading σ 8 dB
Fast fading parameter m 1
Shape parameter v 2
Probability that MSs distributed in region 1 λ 0.0625
Order of Hermite polynomial Np 40
Number of equidistant nodes for polar radius P 10
Figure 3System outage probability versus transmit SNR with differentN.
diversity gain can be achieved, which will result in a higher output SNR. Therefore, a lower outage probability can be achieved. Furthermore, the gaps between every two neighboringNbecome narrow with the increase ofN. The improvement of outage performance becomes very slight whenNincreases to a certain extent. Therefore, too many distributed antennas in one cell are not necessary.
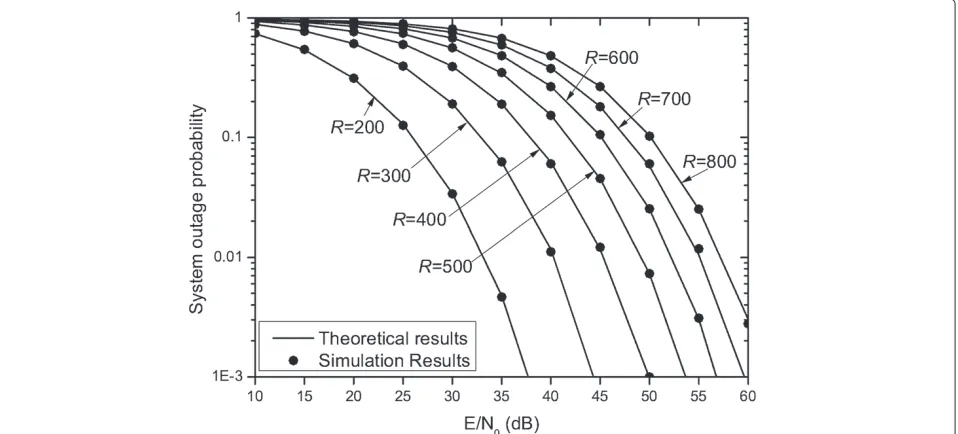
Figure 4 depicts the system outage probability as a func-tion of the radius of the cell (R). This figure indicates that the system outage performance can be improved with the decrease ofR. Just as is expected, the smaller the coverage
of the cell is, the better the system outage performance becomes. Moreover, the performance gaps between every two neighboringRenlarge with the decrease ofR. Gen-erally, we hope the coverage of the cell can be as large as possible, but a large coverage of the cell will reduce the outage performance. Therefore, a tradeoff between cov-erage and outage performance should be considered in practical communication systems.
Figure 5 plots the system outage probability with differ-ent shape parameters (v). In Figure 5, it is depicted that the system outage performance improves with the increase
Figure 5System outage probability versus transmit SNR with differentv.
of the shape parameter v. Moreover, the gaps between every two neighboringvbecome narrow with the increase of v. The improvement of outage performance becomes very slight when the shape parameter increases to a cer-tain extent. Therefore, too large shape parameters are not necessary.
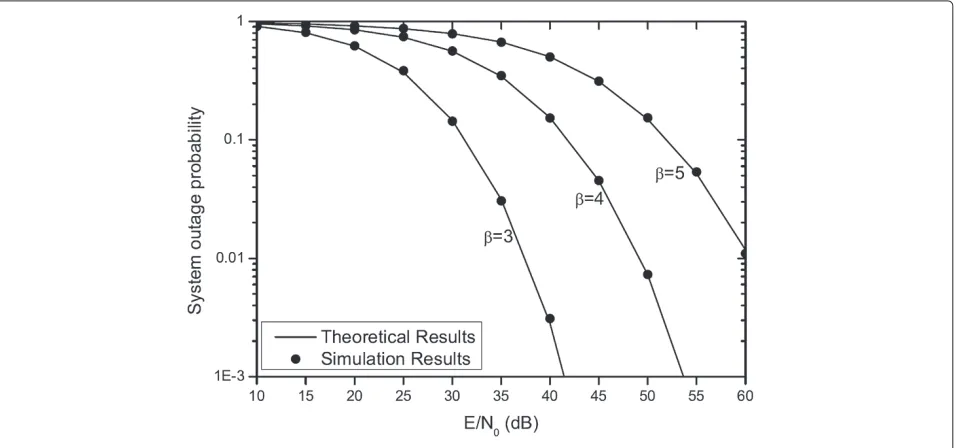
Figure 6 illustrates the relationship between the system outage probability and path loss exponent (β). It can be seen that the system outage performance can be improved by decreasing the value of β. From Equation (4), it can be seen that the path loss increase with the decrease of
β, and then, the channel gain will increase correspond-ingly. Therefore, the output SNR will become better. That is, the number of communication links which cannot sat-isfy the SNR threshold will be decreased. In other words, the outage performance is enhanced.
Figure 7 shows the impact of the distribution of the MS in the cell on system outage performance. Note that, when λ = Sh/S = 0.0625, the MS are uniformly distributed in the cell. Whenλ > 0.0625, the probability of the MS which located in region 1 is higher than in region 2. From Figure 7, it can be observed that, with the increase of
Figure 7System outage probability versus transmit SNR with differentλ.
the valueλfrom 0.0625 to 1.0, the probability of the MS which distributed in region 1 will increase. Since one dis-tributed antenna is located in the center of the cell, the average access distance will reduce, and this will result in the decrease of system outage probability. It should be noted that the system outage probability varies with the value ofλ, which indicates that the distribution of the MS has a strong impact on the system outage performance.
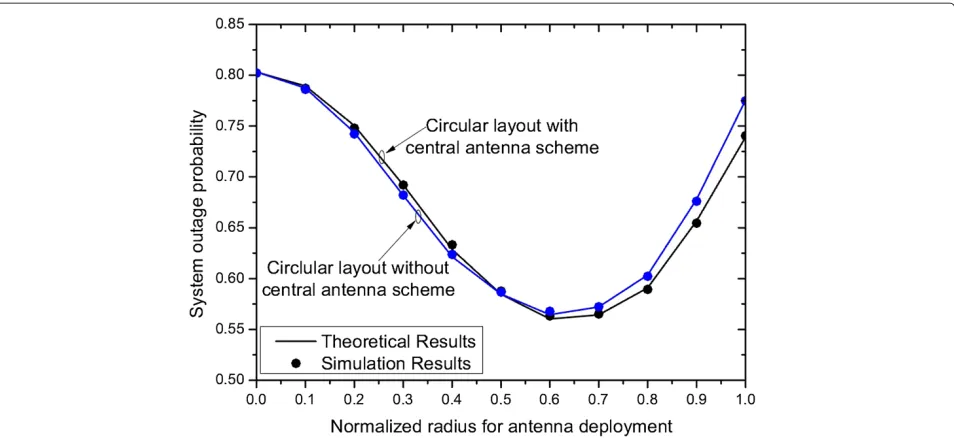
As is well known, the deployment of distributed anten-nas has strong impacts on system performance. In this simulation, two schemes, i.e., circular layout with cen-tral antenna scheme and circular layout without cencen-tral antenna scheme, are proposed to show the optimal radius for antenna deployment. For circular layout with cen-tral antenna scheme, one antenna is deployed in the cell center and the other antennas are evenly deployed on a circle, while all antennas are evenly deployed on a cir-cle for another scheme. Figure 8 shows system outage probability versus normalized radius for antenna deploy-ment when MS is uniformly distributed. It can be seen that, when the normalized radius is less than 0.5, the outage probability of the circular layout without central antenna scheme is smaller than that of the circular layout with central antenna scheme. However, when the normal-ized radius exceeds 0.5, the circular layout with central antenna scheme outperforms the circular layout with-out central antenna scheme. From Figure 8, it can be observed that when the value of the normalized radius is about 2/3, the minimum system outage probability can be derived for both the two schemes. In other words, the optimal radius for antenna placement is about 2R/3 in this simulation scenario.
It should be noted from Figures 3, 4, 5, 6, 7 and 8 that the theoretical results and simulation results of the system outage probability are quite accordant with each other. Therefore, the approximate expression of the sys-tem outage probability shown in this paper can provide perfect approximation to the realistic outage performance of DAS without time-intensive simulations. Furthermore, this approximate expression can be used to evaluate the system outage probability in different scenarios, and it will lay a very good foundation for further research such as antenna placement and network planning.
5 Conclusions
In this paper, we presented a new channel model for DAS, called shadowed generalized-gamma composite channel. The channel fading in this model is a generic case of many classic models, such as Rayleigh-lognormal fad-ing, Nakagami-lognormal fadfad-ing, Weibull-lognormal, et al. Under such a channel model, we investigated the prob-abilistic characterization of uplink system outage with the ST scheme and the distribution of MS in the cell. Using the principle of numerical analysis, we derived an approximate theoretical expression of system outage probability. It has been validated by the numerical results, thus showing that the derived approximate expression can be applied to evaluate the outage probability of DAS precisely.
5.1 Nomenclature
yi received signal at DAi E transmit signal power of MS
Figure 8System outage probability versus normalized radius for antenna deployment whenE/N0= 30 dB,λ= 0.0625, andN= 7.
x transmit symbol of MS with unit energy Z complex white Gaussian noise
Gi fast fading between DAi and the MS vi shape parameter
mi fast fading parameter (x) Gamma function
Li(ρ,θ ) path loss between DAi and MS d0 reference distance
βi path loss exponent
di(ρ,θ ) distance between DAi and MS i shadow fading
ξ 10/ln 10
μi mean value(in dB) of10log10ω σi standard deviation of10log10ω N0 the variance of white Gaussian noise γi output SNA at DAi
Si ELi(ρ,θ ) i/N0 ˜
μi(ρ,θ ) μi+10log10[ELi(ρ,θ ) /N0] γ maximum output SNR γth threshold of SNR δ (ρ,θ ) outage probability of MS
tn base points of theNp-order Hermite polynomial
Hn weight factors of theNp-order Hermite polynomial
r(ρ,θ ) PDF of MS
(z,t) incomplete Gamma function Hn Hermite polynomial
Pout system outage probability
h R/P
k 2π/Q
Appendix
Proof for Lemma 2.1
Proof 1. Since,|Gi|follows a generalized-famma distribu-tion, the cumulative distribution function (CDF) of |Gi|2 can be expressed as
F|Gi|2
g=Pr|Gi|2≤g
=
√
g
−√g
f|Gi|(t)dt. (15)
Differentiating Equation (15) with respect to g yield the PDF of|Gi|2as
f|Gi|2(g)= d
√g
−√g f|Gi|(t)dt
dg
= vimimigmivi−1 (mi)
exp−migvi
,g≥0.
(16)
Furthermore, Si = ELi(ρ,θ ) i/N0in Equation (6), we
can obtain thatγi=Si|Gi|2. Determined byi, Sialso fol-lows a lognormal distribution and its PDF can be derived as
fSi(s)=
ξ
√ 2π σis
exp
−
10log10s− ˜μi(ρ,θ )2 2σi2
,s>0,
(17)
whereμ˜i(ρ,θ )=μi+10log10[ELi(ρ,θ ) /N0].
In the presence of Si, the conditional CDF Fγi|Si (γ ≤r|s) can be written as
Fγi|Si( γ ≤r|s)=F|Gi|2
G≤ r s
=
r s
0
Differentiating Equation (18) with respect to r yield the
By applying Equations (17) and (19), the PDF ofγi can be expressed as
Proof for Theorem 3.1
Before getting into the details of derivation, we mention two important propositions that are already known.
Proposition 1.
which can be found in Section 2.33 in [21]. Proposition 2.
which can be found in Equations (25, 4, 46) in [22].
By Lemma 2.1, Pr(γi< γth)can be expressed as
Therefore, by using proposition 1, Equation (22) can be further written as
Then, by appalying proposition 2, Equation (24) can be further derived as
which completes the proof.
Abbreviations
CDF, cumulative distribution function; DAS, distributed antenna system; MS, mobile station; PDF, probability density function; SNR, signal-to-noise ratio; ST, selective transmission.
Competing interests
The authors declare that they have no competing interests.
Author details
1Key Laboratory for Information System Security of Ministry of Education, School of Software, Tsinghua University, Beijing 100084, China.2National Mobile Communications Research Laboratory, Southeast University, Nanjing 210096, China.
Received: 21 January 2013 Accepted: 21 May 2013 Published: 31 May 2013
References
1. JY Wang, JB Wang, XY Dang, M Lin, Y Jiao, M Chen, in12th IEEE
International Conference on Communication and Technology,System
capacity analysis of downlink distributed antenna systems over composite channels, Nanjing, 11–14 November 2010, pp. 1076–1079 2. XH You, DM Wang, B Sheng, XQ Gao, XS Zhao, M Chen, Cooperative
3. JY Wang, JB Wang, M Chen, System capacity analysis and antenna placement optimization for downlink transmission in distributed antenna systems. Wireless Personal Commun. (2012).
doi:10.1007/s11277-012-0827-8
4. W Roh, A Paulraj, inIn Proceedings of the IEEE Vehicular Technology
Conference, vol. 2. MIMO channel capacity for the distributed antenna
systems (IEEE, Piscataway, 2002), pp. 706–709
5. H Zhu, Performance comparison between distributed antenna and microcellular systems. IEEE J. Selected Areas in Commun. 29(6), 1151–1163 (2011)
6. V Nikolopoulos, M Fiacco, S Stavrou, SR Saunders, Narrowband fading analysis of indoor distributed antenna systems. IEEE Antennas Wireless Propagation Lett.2(1), 89–92 (2003)
7. MK Simon, MS Alouini,Digital Communication over Fading Channels, (2nd edn.) (Wiley, New York, 2005)
8. L Dai, S Zhou, Y Yao, Capacity analysis in CDMA distributed antenna systems. IEEE Trans. Wireless Commun.4(6), 2613–2620 (2005) 9. M Matthaiou, N Chatzidiamantis, G Karagiannidis, A new lower bound on
the Ergodic capacity of distributed MIMO systems. IEEE Signal Process. Lett.18(4), 227–230 (2011)
10. HM Chen, JB Wang, M Chen, Outage capacity study of the distributed MIMO system with antenna cooperation. Wireless Pers. Commun. 59(4), 599–605 (2011)
11. J Zhang, JG Andrews, inIEEE Trans. on Wireless Commun.vol. 7. Distributed antenna systems with randomness. (IEEE, Piscataway, 2008),
pp. 3636–3646
12. HM HM Chen, JB Wang, M Chen, Outage performance of distributed antenna systems over shadowed Nakagami-m fading channels. Euro. Trans. Telecommun.20(5), 531–535 (2009)
13. CHM de Lima, M Bennis, M Latva-aho, inIEEE Transactions on Vehicular
TechnologyStatistical analysis of self-organizing heterogeneous networks
with biased cell association and interference avoidance, (IEEE, Piscataway, 2013, in press)
14. EW Stacy, A generalization of the gamma distribution. Ann. Math. Stat. 33(3), 1187–1192 (1962)
15. Y Shen, Y Tang, T Kong, S Shao, Optimal antenna location for STBC-OFDM downlink with distributed transmit antennas in linear cells. IEEE Commun. Lett.11(5), 387–389 (2007)
16. LL Yang, W Fang, Performance of distributed-antenna DS-CDMA systems over composite lognormal shadowing and Nakagami-m-fading channels. IEEE Trans. Vehicular Technol.58(6), 2872–2883 (2009)
17. J Park, E Song, W Sung, Capacity analysis for distributed antenna systmes using cooperative transmission schemes in fading channels. IEEE Trans. Wireless Commun.8(2), 586–592 (2009)
18. W Feng, Y Li, S Zhou, J Wang, M Xia, inIEEE Wireless Communications and
Networking Conference,Downlink capacity of distributed antenna systems
in a multi-cell environment, Budapest, 5-8 April 2009, pp. 1–5 19. A Goldsmith,Wireless Communication(Cambridge University Press, New
York, 2005)
20. R Burden, J Faires,Numerical Analysis Fourth Edition(PWS KENT Publishing Company, Boston, 1989)
21. IS Gradshteyn, IM Ryzhik,Table of Integrals, Series, and Products(7th edn.) (Academic Press, New York, 2007)
22. M Abramowitz, I Stegun,Handbook of Mathematical Functions with
Formulas, Graphs, and Mathematical Tables(9th edn.) (Dover Publications,
New York, 1970)
doi:10.1186/1687-1499-2013-147
Cite this article as:Caiet al.:Probabilistic analysis of system outage in distributed antenna systems with composite channels.EURASIP Journal on Wireless Communications and Networking20132013:147.
Submit your manuscript to a
journal and benefi t from:
7 Convenient online submission
7 Rigorous peer review
7 Immediate publication on acceptance
7 Open access: articles freely available online
7 High visibility within the fi eld
7 Retaining the copyright to your article