The Effect of Mergers and Acquisitions
on Shareholder Returns
Agus Sugiarto
Victoria Graduate School of Business
Faculty of Business and Law
Victoria University of Technology
The Effect of Mergers and Acquisitions
on Shareholder Returns
by
Agus Sugiarto
Bachelor of Law (Honours) University of Brawijaya
Indonesia
Master of Business Administration Royal Melbourne Institute of Technology
Australia
A dissertation submitted to Victoria University of Technology
in fulfilment of the requirements for the degree of
Doctor of Business Administration
Victoria Graduate School of Business
Faculty of Business and Law
Victoria University of Technology
^0001006987160
sugiarto, Agu s and effect ot m ^ ^^older The . ^„ acquisitions
returns
Table of Contents
Page
Table of Contents ii
Abstract vi Declaration vii Acknowledgment viii List of Tables x List of Illustrations xiv
Chapter 1
Introduction
1.1. Background I 1.2. The Hubris theory of mergers and acquisitions 2
1.3. Rationale of the present study 3 1.4. Definition of mergers and acquisitions 5
1.5. The objectives of the research 5 1.5.1. General objective 5 1.5.2. Specific objectives 6 1.6. Limitation of the research 6
1.7. Research method 7
1.8. Data 7 1.9. Organisation of the study 7
Part One Literature Review
Chapter 2
The Rationale for Mergers and Acquisitions
2.1. Introduction 9 2.2.The hypotheses of mergers and acquisitions 10
2.2.1. Value maximising hypothesis 10 2.2.2. Non-value maximising hypothesis 11
2.2.3. Managerial hypothesis 12 2.2.4. Inefficient management hypothesis 13
2.3. Summary 14
Chapter 3
Abnormal Return : Measurement and Empirical Evidence
3.1. Introduction 15 3.2.Event studies 16
3.2.1. The advantages of event studies 17 3.2.2. The drawbacks of event studies 18 3.3. Accounting numbers methodology 19
3.4. Empirical evidence en event studies 22 3.5. Empirical evidence on accounting numbers 28
3.6. Summary 31
Part Two Methodology
Chapter 4 Methodology
4.1. Introduction 33 4.2. The research model 33
4.2.1. Event studies method " 33
4.2.2. Event time 34 4.2.3. Event window 34 4.2.4. The study models 37
4.3. Data 40
4.3.1. Sources of data 40 4.3.2. Data characteristics 41 4.3.3. Data sample 42
4.4. Summary 43
Part Three
Data Analysis and Empirical Findings
Chapter 5
The Regression Estimates and Statistical Tests
5.1. Introduction 46 5.2. Bidding firms 46 5.3. Target firms 50 5.4. The steps for computing abnormal returns 54
Chapter 6
The Abnormal Return After the Announcement of Mergers and Acquisitions
6.1. Introduction 59 6.2. The bidder's abnormal return 59
6.2.1. Market model 59 6.2.2. Market adjusted model 62
6.3. The target firms' abnormal return 66
6.3.1. Market model 66 6.3.2. Market adjusted model 69
6.4. Comparison of two models 73
6.4.1. The bidder's abnormal return 73 6.4.2. The target's abnormal return 76
6.5. Comparison of abnormal returns between bidding and target firms 79
6.5.1. Market model 79 6.5.2. Market adjusted model 83
6.7. Summary 89 6.7.1. The application of the market model and the market adjusted model 89
6.7.2. The biddmg firm 89 6.7.3. The target firm 90 6.7.4. Comparison of bidding firms' and target firms' abnormal returns 90
Chapter 7
The Abnormal Return After the Outcome is Known
7.1. Introduction 91 7.2. The bidder's abnormal return 91
7.2.1. Market model 91 7.2.2. Market adjusted model 93
7.3. The target firms' abnormal return 95
7.3.1. Market model 95 7.3.2. Market adjusted model 97
7.4. Comparison of the abnormal returns of the two models 99
7.4.1. The bidder' s abnormal return 99 7.4.2. The target's abnormal return 101 7.5. Comparison of abnormal retums of the bidder and target firms 103
7.5.1. Market model 103 7.5.2. Market adjusted model 106
7.6. Comparison with the previous studies 107
7.7. Summary 108 7.7.1. The bidder's abnormal return 108
7.7.2. The target's abnormal return 109 7.7.3. Comparison of abnormal retums of the bidder and target firms 109
Chapter 8
The Abnormal Return for Acquisition of More Than 50%
8.1. Introduction 110 8.2. The bidder's abnormal return 110
8.2.1. Market model 110 8.2.2. Market adjusted model 112
8.3. The target firms' abnormal return 114
8.3.1. Market model 114 8.3.2. Market adjusted model 116
8.4. Comparison of the abnormal remms of the two models 118
8.4.1. The bidder's abnormal return 118 8.4.2. The target's abnormal return 120 8.5. Comparison of abnormal remms of the bidding and target firms 122
8.5.1. Market model 122 8.5.2. Market adjusted model 125
8.6. Summary 126 8.6.1. The bidder's abnormal return 126
Chapter 9
The Abnormal Return for Acquisition of Less Than 50%
9.1. Introduction 128 9.2. The bidder's abnormal return 128
9.2.1. Market model 128 9.2.2. Market adjusted model 130
9.3. The target firms' abnormal return 132
9.3.1. Market model 132 9.3.2. Market adjusted model 134
9.4. Comparison of abnormal retums of the two models 136
9.4.1. The bidder's abnormal return 136 9.4.2. The target's abnormal retum 138
9.5. Comparison of abnormal retums of the bidding and target firms 140
9.5.1. Market model 140 9.5.2. Market adjusted model 143
9.6. Summary 144
9.6.1. The bidder' s abnormal retum 144 9.6.2. The target's abnormal return 145 9.6.3. Comparison of abnormal retums of the bidding and target firms 145
Part Four
Conclusion and Policy Implications
Chapter 10
Summary, Conclusion and Policy Implications
10.1. Introduction 146 10.2. Summary 146
10.2.1. The objective of this study 146 10.2.2. Brief overview of the theoretical background 146
10.2.3. Data analysis and empirical findings 147
10.3. Conclusion 150
10.3.1. Shareholder wealth effect 150
10.3.2. Event studies 150 10.3.3. The gap from previous studies 151
10.3.4. The findings from this study 151
10.4. Policy imphcations 152
10.4.1. The shareholders of bidding firms 152 10.4.2. The shareholders of target firms 154
10.5. Areas for further researches 156
References 157
Appendices
Appendix A Appendix B Appendix C
Abstract
Mergers and acquisitions net only affect the value of merging firms but also generate a positive or negative wealth effect for shareholders of firms involved. The Hubris theory hypothesises that mergers and acquisitions affect the value of the firms as well as shareholder wealth. This theory predicts that as a result of mergers and acquisitions, the value of target firms rises, whilst the value of bidding firms diminishes. Censequentiy, shareholders of target firms gain a positive wealth effect while shareholders of bidding firms experience a negative wealth effect. Most empirical evidence suggests that shareholders of bidding firms suffer a small loss or sometimes earn a marginal gain while the target shareholders obtain a large gain.
However, no previous studies en shareholder wealth effect have investigated whether the differences in abnormal retums are influenced by differences in controlling interest in the target firms. The purpose of the present study is to investigate whether an acquisition of mere than 50% and an acquisition of less than 50% generate the same wealth effects for the shareholders of bidding and target firms. The rationale is that the shareholders of bidding and target firms might cheese a merger which generates better abnormal retums if their wealth is affected by the differences in controlling interest in target firms.
Declaration
This dissertation contains no material which has been accepted for the award of any degree
in any university or equivalent institution and, to the best of my knowledge and belief, the
dissertation contains no material previously written or published by any person, except
where due reference is made in the text of the work.
Agus Sugiarto
March 2000
Acknowledgment
In writing this dissertation, I had the benefit of the input, advice, suggestions and information from many people. First of all, I would like to express my gratitude to my supervisors. Dr. Segu Zuhair and Associate Professor Mary Sweeney, for all their efforts to assist and supervise this research from the beginning of the program.
A special thank goes to Dr. Nick Billington who assisted me in the initial stage of the program, especially during the making of the proposals where he read and commented my proposal and gave some valuable suggestions on the methodology aspect of this research.
My gratitude also goes to Professor Geoffrey George and Associate Professor Louise Kloot whose contribution to the literature review of this research was very helpful and comprehensive.
1 wish to express my thanks to the Beard of Governors of Bank Indonesia, the institution for whom I have been working, Bank Indonesia who has given me a golden opportunity to carry on my study at the doctoral level.
Special acknowledgment must go to some individuals in Bank Indonesia, in particular Mr. Achwan and Mr. Imam Sukamo, the Director and Deputy Director of Human Resources Department of Bank Indonesia , Mr. Maman Semantri and Ms. Dyah Virgeana Gandhi, the Manager and Deputy Manager of Personnel Education and Training Division, the officers at the time when I applied for the program, for their support and for having agreed to let me study further in a doctoral degree. I would also like to acknowledge the excellent support from Mr. Romeo Rissal and Mr. Djoke Sarwone.
I would like to thank Dr. Pam Oliver and Andrew Goodsall for their valuable help and assistance in checking and improving the stmcture and grammar of the English in this dissertation. Thanks also for Andrew's wife, Kate, and son Spencer, for their support and encouragement to complete my study successfully.
I am particularly indebted to my father and mother who offered me the best education they could provide, since my childhood. My father taught me the value of education for my future life, and my mother continually prayed for my success. Both have given me unconditional support and unlimited love, my entire life. Extended thanks go to my brothers and my sister along with their family for their moral support and prayers.
Last but net least, I must thank God for guidance and the opportunities presented to me.
List of Tables
Table Page
4 . 1 . Total sample of mergers and acquisitions (1993-1997) 44
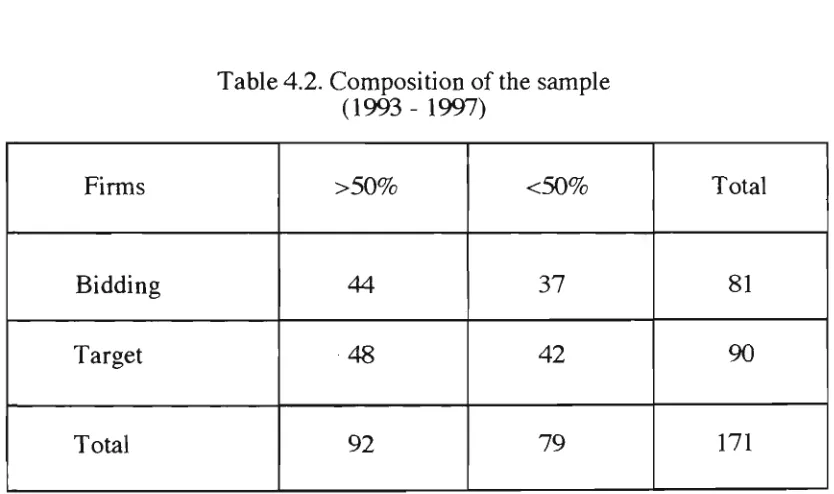
4.2. Composition of the sample (1993-1997) 44
6.1. The average abnormal retum of bidding firms 61 10 days prior to and 10 days after the announcement
(Market model)
6.2. The various cumulative average abnormal retum of bidding firms 62 (Market model)
6.3. The average abnormal retum of bidding firms 64 10 days prior to and 10 days after the announcement
(Market adjusted model)
6.4. The various cumulative average abnormal retum of bidding firms 65 (Market adjusted model)
6.5. The average abnormal retum of target firms 68 10 days prior to and 10 days after the announcement
(Market model)
6.6. The various cumulative average abnormal remm of target firm 69 (Market model)
6.7. The average abnormal retum of target firms 71 10 days prior to and 10 days after the announcement
(Market adjusted model)
6.8. The various cumulative average abnormal retum of target firms 72 (Market adjusted model)
6.9. The average abnormal retum of bidding firms 75 10 days prior to and 10 days after the announcement
(Market model and Market adjusted model)
6.10. The various cumulative average abnormal retum of bidding firms 76 (Market model and Market adjusted model)
6.11. The average abnormal retum of target firms 78 10 days prior to and 10 days after the announcement
(Market model and Market adjusted model)
6.12. The various cumulative average abnormal retum of target firms 79 (Market model and Market adjusted model)
6.13. The average abnormal retum of bidding and target firms 82 10 days prior to and 10 days after the announcement
6.14. The various cumulative average abnormal retum of bidding and 83 target firms (Market model)
6.15. The average abnormal retum of bidding and target firms 85 10 days prior to and 10 days after the announcement
(Market adjusted model)
6.16. The various cumulative average abnormal retum of bidding and 86 target firms (Market adjusted model)
6.17. The comparison of previous studies en mergers and 88 acquisitions
7.1. The average abnormal remm of bidding firms 93 10 days after the merger result is known
(Market model)
7.2. The average abnormal retum of bidding firms 95 10 days after the merger result is known
(Market adjusted model)
7.3. The average abnormal retum of target firms 97 10 days after the merger result is known
(Market model)
7.4. The average abnormal retum of target firms 99 10 days after the merger result is fanown
(Market adjusted model)
7.5. The average abnormal retum of bidding firms 101 10 days after the merger result is known
(Market model and Market adjusted model
7.6. The average abnormal retum of target firms 103 10 days after the merger result is known
(Market model and Market adjusted model)
7.7. The average abnormal retum of bidding and target firms 105 10 days after the merger result is known
(Market model)
7.8. The average abnormal retum of bidding and target firms 107 10 days after the merger result is known
(Market adjusted model)
8.1. The average abnormal retum of bidding firms 112 for acquisition of mere than 50%
(Market model)
8.2. The average abnormal retum of bidding firms 114 for acquisition of mere than 50%
(Market adjusted model)
8.3. The average abnormal retum of target firms 116 for acquisition of more than 50%
(Market model)
8.4. The average abnormal retum of target firms 118 for acquisition of mere than 50%
(Market adjusted model)
8.5. The average abnormal retum of bidding firms 120 for acquisition of more than 50%
(Market model and Market adjusted model)
8.6. The average abnormal retum of target firms 122 for acquisition of mere than 50%
(Market model and Market adjusted model)
8.7. The average abnormal retum of bidding and target firms 124 for acquisition of more than 50%
(Market model)
8.8. The average abnormal retum of bidding and target firms 126 for acquisition of mere than 50%
(Market adjusted model)
9.1. The average abnormal retum of bidding firms 130 for acquisition of less than 50%
(Market model)
9.2. The average abnormal retum of bidding firms 132 for acquisition of less than 50%
(Market adjusted model)
9.3. The average abnormal retum of target firms 134 for acquisition of less than 50%
(Market model)
9.4. The average abnormal retum of target firms 136 for acquisition of less than 50%
(Market adjusted model)
9.5. The average abnormal retum of bidding firms 138 for acquisition of less than 50%
(Market model and Market adjusted model)
9.6. The average abnormal retum of target firm s 140 for acquisition of less than 50%
(Market model and Market adjusted model)
9.7. The average abnormal retum of bidding and target firms 142 for acquisition of less than 50%
(Market model)
9.8. The average abnormal retum of bidding and target firms 144 for acquisition of less than 50%
(Market adjusted model)
10.1. The Hubris theory on mergers and acquisitions 147
10.3. Cumulative abnormal retum for the bidding and target firms 148 for acquisition of more than 50%
10.4. Cumulative abnormal return for the bidding and target firms 148 for acquisition of less than 50%
10.5. Cumulative abnormal retum for the bidding and target firms 150
10.6. Post-outcome position for the bidding firm 153
10.7. Post-outcome position for the target firm 155
List of Illustrations
Figure Page
6.1. The average abnormal retum of bidding firms 60 10 days prior to and 10 days after the announcement
(Market model)
6.2. The average abnormal retum of bidding firms 63 10 days prior to and 10 days after the announcement
(Market adjusted model)
6.3. The average abnormal retum of target firms 67 10 days prior to and 10 days after the announcement
(Market model)
6.4. The average abnormal retum of target firms 70 10 days prior to and 10 days after the announcement
(Market adjusted model)
6.5. The average abnormal retum of bidding firms 74 10 days prior to and 10 days after the announcement
(Market model and Market adjusted model)
6.6. The average abnormal retum of target firms 77 10 days prior to and 10 days after the announcement
(Market model and Market adjusted model)
6.7. The average abnormal retum of bidding and target firms 80 10 days prior to and 10 days after the announcement
(Market model)
6.8. The average abnormal remm of bidding and target firms 84 10 days prior to and 10 days after the announcement
(Market adjusted model)
7.1. The average abnormal retum of bidding firms 92 10 days after the result is known
(Market model)
7.2. The average abnormal retum of bidding firms 94 10 days after the result is known
(Market adjusted model)
7.3. The average abnormal retum of target firms 96 10 days after the result is known
(Market model)
7.4. The average abnormal retum of target firms 98 10 days after the result is known
7.5. The average abnormal retum of bidding firms 100 10 days after the result is known
(Market model and Market adjusted model)
7.6. The average abnormal return of target firms 102 10 days after the result is known
(Market model and Market adjusted rhedel)
7.7. The average abnormal retum of bidding and target firms 104 10 days after the result is known
(Market model)
7.8. The average abnormal retum of bidding and target firms 106 10 days after the result is known
(Market adjusted model)
8.1. The average abnormal retum of bidding firms 111 for acquisition of mere than 50%
(Market model)
8.2. The average abnormal retum of bidding firms 113 for acquisition of mere than 50%
(Market adjusted model)
8.3. The average abnormal retum of target firms 115 for acquisition of mere than 50%
(Market model)
8.4. The average abnormal retum of target firms 117 for acquisition of more than 50%
(Market adjusted model)
8.5. The average abnormal retum of bidding firms 119 for acquisition of more than 50%
(Market model and Market adjusted model)
8.6. The average abnormal retum of target firms 121 for acquisition of more than 50%
(Market model and Market adjusted model)
8.7. The average abnormal remm of bidding and target firms 123 for acquisition of more than 50%
(Market model)
8.8. The average abnormal retum of bidding and target firms 125 for acquisition of mere than 50%
(Market adjusted model)
9.1. The average abnormal retum of bidding firms 129 for acquisition of less than 50%
(Market model)
9.2. The average abnormal return of bidding firms 131 for acquisition of less than 50%
(Market adjusted model)
9.3. The average abnormal retum of target firms 133
for acquisition of less than 50% (Market model)
9.4. The average abnormal retum of target firms 135 for acquisition of less than 50%
(Market adjusted model)
9.5. The average abnormal retum of bidding firms 137 for acquisition of less than 50%
(Market model and Market adjusted model)
9.6. The average abnormal retum of target firms 139 for acquisition of less than 50%
(Market model and Market adjusted model)
9.7. The average abnormal remm of hi tiding and target firms 141 for acquisition of less than 50%
(Market model)
9.8. The average abnormal retum of bidding and target firms 143 for acquisition of less than 50%
Chapter 1
Introduction
1.1. Background
Mergers and acquisitions became a "trend " during the 1960s and 1980s (Lev, 1993;
Larcker, 1993), with so-called merger "waves" during this period. Many firms engaged
in merger activities during these merger "waves", not only in the United States and Europe,
but also in Australia and Japan (Lubatkin and Lane, 1996), the reason being that mergers
and acquisitions have played an important role in the business environment since the 1960s
emerging not only as a part of financial activity but also as part of investment strategy.
Censequentiy, much study and research was conducted en mergers and acquisition over that
period, especially ones which focused on the effect of mergers and acquisitions on
shareholder wealth.
The study of mergers and acquisitions has declined since the early 1990s, yet many issues
remain unresolved. In the past five years, a few studies en the effect of mergers and
acquisitions en shareholder wealth have been undertaken. Among these. Comment and
Schwert (1995) argue that mergers declined at the end of the 1980s and early 1990s;
Mitchell and Mulherin (1996) argue that the merger wave which occurred in the 1980s was
the most active takeover period during the past century and Mikkelsen and Partch (1997)
maintain that the period of 1984 1988 was the mere intense takeover period and 1989
-1993 was a less active period.
Recent literature on mergers and acquisitions has concentrated on other subjects beyond
shareholder retums, such as the effect of managerial wealth en mergers (Cotter and Zenner,
1994); the impact of mergers en industry stmcture (Mitchell and Mulherin, 1996);
managerial failure (Franks and Mayer, 1996); anti takeover amendments (Akhigbe and
Madura, 1996); managerial turnover (Mikkelsen and Partch,1997); managerial compensation
(Agrawal and Knoeber, 1998); managerial ownership (Ghosh and Ruland, 1998).
1.2. The Hubris theory of mergers and acquisitions
The Hubris theory (Roll, 1986) takes a hypothetical view that mergers and acquisitions
affect the value of merging firms. When a merger or acquisition announcement is made, the
shareholders of the bidding firm incur a loss in terms of the share price while those of the
target firm generally enjoy a rise in the share price.
The current reasoning behind this is that when a firm announces a merger offer to the target,
the share price of the target firm increases because shareholders in the target firm are ready
to transfer shares in response to the high premium that will be offered by the acquiring
firm. Roll (1986) says " ...the hubris hypothesis is very simple: decision-makers in
acquiring firms pay toe much for their targets..." (p.213). This behaviour is sometimes
attributed to the overconfidence of the shareholders of the bidding firm, hence the term
"hubris". The increase in share price of a target firm finally drives up the value of the target
firm. On the ether hand, the shareholders of acquiring firms suffer a capital loss of share
value because they must allocate cash or additional shares to the target shareholders, and
sometimes they overpay (Bames, 1998). Singh (1998) points out that there are a number of
studies supporting the existence of bidder overpayment consistent with the Hubris
hypothesis. Censequentiy, the decrease in share prices of an acquiring firm will drive down
the value of the bidding firm. Therefore, a takeover offer drives up the value of acquired
firms and drives down the value of acquiring firms (McCardle and Viswanathan, 1994).
Roll (p. 197) says, "My purpose here is to suggest a different and less conclusive
interpretation of the empirical results. This interpretation may net mm out to be valid, but I
hope to show that it has enough plausibility to be at least considered in further
investigation". In view of this hypothesis, it is important to test whether this theory is able to
accurately predict behaviour under different conditions of mergers and acquisitions. An
important test of a theory is its ability to predict behaviour under real conditions (Kerlinger,
1992). Also theories of a speculative nature, such as the hubris hypothesis, must be
a theory cannot be supported by observational or experimental tests, it must be replaced by
ones that make better predictions and have better empirical support.
Hubris hypothesis has been empirically tested by studies such as : Dodd and Ruback, 1977;
Bishop et.al., 1987; Ravenscraft and Scherer, 1989; Franks and Harris, 1989; Zhang, 1995;
Sudarsanam e/.£z/., 1996; Grallon et.al, 1997; Maquieria er.a/., 1998. These studies have
produced empirical evidence in support of the hubris theory.
1.3. The rationale of the present study
A survey of previous studies reveals that issues in the area of shareholder wealth effects
have not been addressed in the existing literature on mergers and acquisitions. In particular,
none of the studies explain whether the transfer of shares from target firms to bidding firms
occur partly (less than 50%) or wholly (more than 50%), and whether the degree of control
acquired has any impact on the share rices of the bidding and target firms.
Theoretically, if a bidding firm acquires more than 50% of target shares, it will have a
controlling interest in the target firm. This controlling interest empowers the firm to
determine the direction of the acquired firm by making the corporate decisions. Conversely,
if a bidding firm acquires less than 50% of target shares, it does not have control of the
acquired firm because the acquiring firm has insufficient votes to dictate the policy and
direction of the target firm even though practically the acquiring firm becomes the biggest
shareholder in the acquired firm. The differences in the controlling interest could have an
impact on the management and the operations of the merged entity, which in turn could have
an impact on its profitability.
The thesis acknowledges that in certain circumstances it is possible for shareholders with
less than 50% ownership to have an effective control of the major decisions of the firm
mainly because of the fragmentation of the shares into a large number of minority
shareholders. This, however, is not necessarily tme for all circumstances and the only way
to establish control is to examine the decision making process of the major decisions. This
under the strict disclosure regulations.
Under the efficient market hypothesis it is assumed that shareholders are fully informed and
are rational. A fully informed rational shareholder when making decisions about investment
will take the management control of the firm into consideration. These issues need to be
taken into account in research on mergers and acquisitions because there may be different
retums for different controls of interests for shareholders of acquiring and target firms. For
example a shareholder might have different expectations about the remm on investment for
different degrees of control acquired during an acquisition. This is seen situation such as
with Telstra in Australia where with the Government of Australia owning 51% of the
shares, the effective control is with the govemment and the market sentiment is against the
company. Empirically, it is also essential to understand the different impact on shareholder
wealth and the attitude of the shareholders when there are controlling interests of less than
50% and more than 50% of target firms.
Previous studies that support the Hubris hypothesis have not investigated whether the
hypothesis produces the same result when an interest of more than 50% compared with an
interest of less than 50% of a target firm is acquired. This proposition is important in
determining whether shareholder wealth effects are influenced by differences in the
controlling interests of target firms.
The importance of the differences of acquisition of less than 50% and acquisition of more
than 50% is that the shareholders of bidding and target firms may implement different
policies or attitudes on mergers and acquisitions if their wealth effects are influenced by the
differences in the level of controlling interests. In other words shareholders may support or
reject a merger proposal, or merger offer, if it affects their gains or losses.
The implication of these differences to the shareholders of acquiring and target firms can be
linked to the Hubris theory. The hubris hypothesis asserts that the overpayment by the
shareholders of the bidding firm for the target firm is because of the overconfidence. The
present research will empirically establish whether an acquisition, regardless of whether it is
acquiring firms and drive up the wealth of target shareholders. If the answer is yes, any
merger or acquisition will result in a decrease in the value of the acquiring firms regardless
of whether the merger or the acquisition results in a controlling interest or not.
1.4. Definition of mergers and acquisitions
The terms 'merger', 'acquisition' and 'takeover' can be used interchangeably, because they
have a similar meaning one to another (Jarrel et.al, 1988; Berkovitch and Khanna, 1991).
In practical use, there is no difference between these terms. Some authors prefer the term
'takeover' rather than merger or acquisition, and the others prefer use 'merger and
acquisition' instead of 'takeover'. However, most of the literature on mergers and
acquisitions uses the term 'merger and acquisition' rather than 'takeover'.
This study will use these terms interchangeably and define merger, acquisition and takeover
as the same, that is, an offer which is made by the bidding or acquiring firms to the
shareholders of target or acquired firms. Bidding firms publicly announce whether they
intend to acquire greater or less than 50% of their target firm's shares.
1.5. The objective of the research
1.5.1. General objective
The general objective of this research is to estimate the retums for shareholders of target
and acquiring firms on mergers and acquisitions by using an event study method in order to
test whether the Hubris hypothesis is relevant in different conditions. The event studies
method uses share price movements of target and bidding firms in the stock market prior
to, and up until after the announcement of the offer, as well in the period after the
merger outcome is known, in order to measure the change of share prices during that period
1.5.2. Specific objectives
Four specific objectives will be addressed in this research.
Specific objective 1:
To estimate shareholders' abnormal retums of the acquiring firms 10 days prior to and 10
days after announcement of mergers.
Specific objective 2 :
To estimate shareholders' abnormal retums of the acquired firms 10 days prior to and 10
days after announcement of mergers.
Specific objective 3 :
To estimate shareholders' abnormal returns of the acquiring firms 10 days after the outcome
is known (for acquisitions of more than 50% and less than 50%).
Specific objective 4 :
To estimate shareholders' abnormal retums of the acquired firms 10 days after the outcome
is known (for acquisitions of more than 50% and less than 50%).
1.6. Limitation of the research
The research area of mergers and acquisitions is immense. A study of mergers and
acquisitions can be investigated from the view points of various disciplines such as finance,
accounting, management, organisational behaviour, corporation law, and social science. The
study of mergers and acquisitions in the present dissertation will concentrate on a particular
discipline to obtain a focused result, namely to a financial economics aspect only. The
financial economics aspect of this research will investigate the shareholder wealth effect,
shareholders of target and bidding firms.
1.7. Research method
The model applied to measure the abnormal retums of mergers and acquisitions is based on
the event studies methodology, that is, the market model and the market adjusted model.
The measurement of abnormal retums is taken from 10 days prior to the announcement of
mergers and acquisitions up until 10 days after the announcement. The abnormal retums for
the acquisition of more than 50% and less than 50% will then be measured over the ten
day period after the announcement of merger outcomes. The average rates of retum for the
sample of bidding and target firms will be calculated from the security market lines estimated
via simple regressions.
1.8. Data
This study employs data from mergers and acquisitions that occurred in Australia
between January 1993 and December 1997. The data of mergers and acquisitions employed
in this study is The Formal Takeover Offer stated in Section 616 of the Australian
Corporations Law. All firms in the sample, bidding firms and target firms, are publicly
listed companies chosen at random from various industries. A total of 81 bidding and 90
target firms were included in the analysis.
1.9. Organisation of the study
The thesis is organised into four parts, each part in turn organised into one or more
chapters..
Chapter one consists of the background of the study, the definition of 'merger' and
'acquisition', and describes the Hubris theory of mergers. This is followed by the rationale
for the study and the objective of the study. It concludes with a brief description of the
Part One contains a literature review detailing the theoretical aspect of mergers and
acquisitions. Previous empirical findings on shareholder wealth on mergers and acquisitions
will also be discussed, and applied methods for measuring shareholder wealth effects will be
investigated. This part consists of two chapters (Chapter Two and Three). Chapter Two
discusses the reasons why mergers and acquisitions take place, the motives behind mergers
and acquisitions, and provides some hypotheses relating to mergers and acquisitions.
Chapter Three reviews the literature on mergers and acquisitions. It provides the two major
applied models commonly used to measure abnormal retums, that is, event studies and
accounting numbers. This chapter also discusses empirical findings from previous studies.
Part Two consists of only one chapter, that is. Chapter Four which contains the
methodology section of this study consisting of an introduction, the research model and
data.
Part Three consists of data analysis and empirical findings. It provides the empirical
results of the research, that is, the effect of mergers and acquisitions on shareholder wealth.
This part consists of five chapters (Chapters Five, Six, Seven, Eight and Nine). Chapter
Five discusses the results of the regression estimates of the security market lines, the beta
estimates, and their statistical significance. Chapter Six discusses the abnormal retums
after the announcement of mergers and acquisitions. It examines the abnormal retums for
the shareholders of bidding and target firms based on market model and market adjusted
model. Chapter Seven analyses the abnormal retums after the outcome of mergers and
acquisitions is known publicly. The wealth effect of mergers and acquisitions is presented
on both the market model and market adjusted model. Chapter Eight discusses the
abnormal retums for acquisition of more than 50%. The wealth effect for the shareholders of
bidding and target firms is prepared on both market model and market adjusted model.
Chapter Nine provides the abnormal retums for acquisition of less than 50% of target
firms. The shareholders' wealth is presented on the market model and market adjusted
Part Four provides the summary, conclusion and policy implications, consisting of one
chapter. Chapter Ten. It reviews the results of the findings of this study, some theoretical
background on mergers and acquisitions, the gaps from the previous studies, and the
Part One
Chapter 2
The Rationale for Mergers and Acquisitions
2.1. Introduction
A common view of mergers and acquisitions is that they are stimulated by the firms'
objectives to obtain more benefit from the merged firms compared to their total value if they
were independent. Dutz (1989) argues that even though mergers are profitable for share
holders, they are socially undesirable and should be prohibited because they may result in
rationalisation of capacity. Some studies such as Caves (1989) indicate that mergers are
profitable activities and socially desirable, because they create value and are economically
efficient. Increased efficiency may arise through synergistic effects which means that
synergistic gains such as operating synergy and financial synergy can also be reached
through mergers and acquisitions (Maquieira et.al, 1998).
Furthermore, Sudarsanam et.al. (1996) argue that there are three sources of value creation in
mergers : operational synergy, managerial synergy and financial synergy. Lev (1993) finds
that financial synergy can be achieved in short term and long term goals. Short term financial
synergies are, for example, price-eaming effects, improved liquidity, and tax effects. The
long term financial synergies include increased debt capacity, improved capital
redeployment, and stabilised eamings. Lev also points out that motives for mergers are not
only based on financial purposes, but also on such managerial motives as executive
compensation, power needs, power growth, human capital and risk diversification.
Bradley, Desai and Kim (1983) find that mergers can generate an operating synergy
resulting from efficient management, economies of scale, improved production techniques,
the combination of complementary resources, increased market power and the
redeployment of assets to more profitable uses. Ravenscraft and Scherer (1989) propose
that corporate mergers are motivated by reasons such as displacement of inefficient
managers, achievement of economies of scale and scope in production, distribution and
financing, enhancement of monopsony! or monopoly power^, exploitation of tax reduction
opportunities, and constmction of managerial empires.
2.2. The Hypotheses of mergers and acquisitions
Based on the motives for mergers and acquisitions above, the following are some of the
theoretical frameworks concerning the rationale for mergers and acquisitions.
2.2.1. Value maximising hypothesis
This hypothesis originates in economic theory (Manne, 1965) which views mergers and
acquisitions as an activity that may generate a valuable asset. Under this hypothesis, the
managers of firms have a primary goal of maximising shareholder wealth (Firth, 1980;
Sudarsanam et.al., 1996; Gonzalez et.al, 1997). According to this hypothesis, a merger or
acquisition should generate a positive economic gain to the merging firms or at least non
negative retums (Baradwaj et.al, 1992). Hence, any merger or acquisition activity should
meet the same criteria as any other investment decision (Halpem, 1983). Most mergers and
acquisitions are value maximising activities whose aim is to boost shareholder wealth. If
this objective cannot be met by the managers of firms engaging in mergers and acquisitions,
they may not proceed with the merger proposal or may reject any merger offer, and
therefore, in this case, the ability to pick a good takeover target is essential (Powell, 1997)
Managers should not conduct any merger or acquisition if there are no positive gains
expected through the merger of their firms. If the firms' value increases as a result of a
merger or acquisition, it indicates that the firms involved in a merger or acquisition are
assumed to be value maximisers (Asquith and Kim, 1982; Malatesta, 1983). Even if, for
example, at the beginning of making a merger proposal shows a negative net present value
investment, it does not mean that this merger proposal does not generate any gain to the
shareholders of merging firms. The gain raised from mergers and acquisitions may come
after the announcement of merger offers or after the outcome of mergers is known.
!• Monopsony power is the power of a firm to reduce the payment it has to make to workers (McDonald, 1992)
Financial motivations and synergy effects are among those which are consistent with the
value maximising hypothesis (Choi and Philippatos, 1983; Halpem, 1983). Maquieira
et.al. (1998) argue that financial synergies can arise from various aspects of the merging
firms, such as from a reduction of default risk which finally reduces borrowing costs and
diversification of equity risk for shareholders. Haugen and Langetieg (1975) conclude that it
is possible to minimise the risks of insolvency and bankruptcy by merging with another
firm. In addition, Berger et.al. (1998) point out that mergers and acquisitions can generate a
static effect which means the combination of assets of merging firms becomes bigger than
before. The bigger the assets, the greater the possibility of the merging firms displaying a
better wealth effect for the shareholders.
2.2.2. Non -value maximising hypothesis
This hypothesis, proposed by Halpem (1973, 1983), takes the view that any merger or
acquisition has no economic gains for the merging firms. The positive retums are not the
objective of the firm conducting a merger attempt, and therefore, the bidding firms are not
interested in the profitability of a merger. According to Halpem, it is not necessarily
important for the managers of the firms who engage in mergers and acquisition to display
positive retums for their shareholders.
In this type of merger, the merging firms, especially the acquiring ones, will seek some
other objectives beyond the positive economic gains for their firms, such as to maximise
sales growth, to control a conglomerate empire, to lift company image, to enter a new
market which is not possible without a merger or acquisition due to govemment
regulations, to change the target market, to expand to a new geographic market, to acquire
qualified managers and expertise, and so on.
Meanwhile, a study by Healy, Palepu and Ruback (1997) finds that strategic takeovers that
can be categorised as non-value maximising activity (takeovers that typically involved stock
payment for firms in similar businesses) generate more gains than financial takeovers
(takeovers that generally involved cash payments for firms in unrelated businesses). This
result is very interesting because, in fact, the non-value maximising merger often
outperforms the value maximising merger. Most non-value maximising mergers are
horizontal mergers which are subject to govemment restrictions and regulations because the
non-value maximising mergers sometimes create monopoly and oligopoly. The involvement
of govemments, as part of an antitmst policy, is essential to protect public interests against
an increase in the use of market power in setting prices (Akhavein et.al, 1997).
A study by Berger et.al. (1998) discovered that some mergers and acquisitions in the U.S.
Banking Industry are also driven by some non-value maximising objectives, for example, to
consolidate the merging firms, to refocus small business lending. Studies by Bhagat, Sleifer
and Vishny (1990), and Kaplan and Weisbach (1992) point out that operating synergies
can only be created in mergers between firms in the same or related industries.
2.2.3. Managerial hypothesis
Mueller (1969) proposes that mergers can be used by the managers of firms as a tool to
achieve their own personal interests. Under this hypothesis, managers conduct mergers or
acquisitions if they contribute to their personal wealth (Agrawal and Knoeber, 1998; Ghosh
and Ruland, 1998). Bishop et.al (1987) call this hypothesis an anti takeover theory,
because managers act to maximise their own utility. These objectives, however, basically do
not always maximise shareholder retums (Firth, 1980). Therefore, managers' acquisition
decisions are not designed to enhance shareholder wealth. Lev (1983) also argues that the
increase in the power of the managers boosts their own interest at the expense of that of
their companies' shareholders.
Furthermore, Amihud and Lev (1981) comment that managers engage in mergers and
acquisitions to minimise their human capital risk. In addition, merger activities can be seen
by the managers as an attempt to diversify their human capital risks (Morck, Shleifer and
Vishny, 1990). Mergers and acquisitions allow managers to limit their risks by creating
larger but less risky firms (Maquieira et.al, 1998). This argument is logical when the risk to
the new merging firm is divided and shared to some people, leading managers to reduce
The managerial hypothesis is consistent with the argument from Larcker (1983) who states
that managers focus on the short term, and always try to maximise their available utility in
their firm. Again, this argument is logical because most managers are hired for a certain
period of time, and consequently they will try to maximise their wealth before at the end of a
contract. Therefore, when a merger or acquisition provides a manager with large personal
benefits, he is more willing to sacrifice the market value of the firm (Morck ^/.<2/., 1990).
On the other hand, shareholders prefer to maximise the share price, which is more a long
term outlook. To minimise this conflicting interest between managers and shareholder
objectives, it is very common for firms to provide their managers with share options. By
holding shares or options in their firms managers have a vested interest and are morally
responsible for maximising their own interests as well as shareholder wealth.
2.2.4. Inefficient management hypothesis
Mergers or acquisitions can also be viewed as a response to inefficient management. This
scenario is seen by investors as a response to a situation where the incumbent management
has pursued inefficient policies, and consequently, the firm becomes an acquisition target
(Asquith, 1983; Malatesta, 1983).
Inefficient management can be identified from several indicators, for example, poor
earnings, undervalued shares and low P/E ratio. These indicators signal inefficient
management and demonstrate that the resources in the target firms are not utilised efficientiy
and properly which motivates the bidding firms to takeover the target firm (Dodd and
Ruback, 1977). If the firm is acquired, the bidding firm will employ a new management
team who will manage the resources more efficientiy.
Organisation effectiveness can be considered as part of efficient management. Mergers
maximise the resources from the combining firms, thus, the organisation's performance
becomes effective. It also increases productivity through combining two or more resources
one of which is undemtilised.
Furthermore, the new management may change the organisation stmcmre, from a centralised
to a decentralised stmcture (Senn, 1994). This change makes the organisation more
effective in handling day to day activity, because it can react more quickly to problems which
arise. If an organisation can work efficientiy, it maximises its available resources.
2.3. Summary
There are various motives why managers or firms conduct mergers and acquisitions.
Basically there are four theories for the rationale behind mergers and acquisitions. The value
maximising theory states that mergers and acquisitions should maximise shareholder
wealth. The non-value maximising theory says that mergers and acquisitions are not
necessary to produce economic gain for the shareholder. The managerial theory states that in
some cases mergers and acquisitions are used by the manager of merging firms as an
instmment to pursue personal interests. The inefficient management theory emphasises that
Chapter 3
Abnormal Return ; Measurement and Empirical Evidence
3.1. Introduction
Mergers are also considered part of investment strategies (Asquith, Bmnerand MuUins,
1983). Many corporate managers, investors, and also shareholders believe mergers and
acquisitions create a financial synergy or some benefit to their firm. No firms should merge
if they can not emerge from the process with advantages for their share holders. Because
mergers are considered as an investment there needs to be an incentive for the shareholders
to acquire firms which increase the variability of the firm's cash flow. This means that
shareholders may obtain positive abnormal retums at the expense of bond holders by
increasing the firm's risk through merger, even though there is no real synergy. Therefore,
mergers can increase income as well as risk for the shareholders (Asquith and Kim, 1982).
It is apparent that mergers have become an essential investment strategy in business decision
making, and hence, it is important to measure the retums from capital gains as a result of
mergers. The shareholder may cam positive abnormal retums because of increased risk
through mergers and acquisitions. There is some empirical evidence supporting increased
retums to shareholders as a result of mergers (Dodd, 1976; Bradley et.al, 1988; Franks and
Harris, 1989), and evidence indicating decreased retums to share holders when anti-merger
lawsuits are announced (Wier, 1983) or when anti takeover amendments are implemented
(Akhigbe and Madura, 1996). Similar results are found in Jarrel and Poulsen (1988) who
argue that a defence strategy results in a significant wealth loss to target shareholders.
There are two techniques for determining the impact of mergers and acquisitions on
shareholder wealth, namely, event studies and accounting numbers.
3.2. Event studies
Measuring retums by using event studies is the most common method. It was introduced
for the first time by Fama, Fisher, Jensen and Roll (1969). Event studies use the stock
market as an instmment to provide useful evidence on how share prices react to information
and to detect any change or movement of share prices as a result of mergers and
acquisitions.
Event studies measure the returns to shareholders from mergers based on share price
changes; that is, a change of share price from what it was before the merger to what it
becomes after the merger. Bishop, Dodd and Officer (1987) argue that to measure retums
by using event studies is a superior method to that of analysing abnormal retums,
because it provides the "best estimates" of the firm's value after merger.
The characteristic of the capital market as a forward looking medium for changes in share
prices results in a reliable measure of price changes since it is assumed that the capital market
is efficient. In an efficient capital market, the share prices reflect the available information
instantiy (Fama, 1970). Accordingly, share prices will react to this new information by
moving up or down.
Event studies which originate from semi-strong form efficient markets (Fama,1991) result
from such events as the announcement of stock splits, unexpected changes in dividends and
changes in capital structure and mergers. In addition, Fama (1991) points out that event
studies can provide a better and clearer picture of the speed of adjustment of stock prices to
new information relating to merger activities. In his latest article, Fama (1998) maintains
that event studies methodology based on the Efficient Market Hypothesis is still valid even
though a few recent studies on efficient market hypothesis seem to produce some anomalies.
The reason why event studies receive strong support for measuring retums from mergers
and acquisitions is that an information event (the merger announcement) can be dated
precisely, and thus, the share prices will move to follow this new available information.
Therefore, the event studies method based on market efficiency can provide us with
However, in some cases, the information may have been anticipated before the
announcement of mergers or takeovers. For example, Halpem (1973) shows that share
prices begin to anticipate a merger or acquisition eight months prior to the announcement;
Franks et.al. (1977) finds that the share price starts to anticipate a merger proposal three
months before the announcement. Nevertheless, the event studies method is still the best and
preferable choice at the present time due to its reliability in measuring the capital gain or loss
that results from mergers and acquisitions.
3.2.1. The advantages of event studies
(a). Information effects
A merger proposal announced by an acquiring firm to a target firm generates a signal to the
share market and investors that there is an "event" that may effect the share prices of
their firms. Prabhala (1997) points out that event studies have the ability to test the impact of
an event on the announcing firm's value and to estimate its magnitude. Additionally, event
smdies can identify the factors that explain changes in the firm's value on the event date.
For these reasons, the use of event studies methodology to measure the wealth effect of
mergers and acquisitions for the shareholders of bidding and target firms provides a reliable
method. The announcement of any merger or acquisition by a bidding firm contains a lot of
information which is absorbed by the investors in the market and the shareholders of bidding
and target firms as an indicator of their expected future eamings. This argument is supported
by Healy et.al. (1997) who comment that merger announcements represent investors'
expectations of the benefits of mergers.
(b). Quick measurement of remms
The effect of mergers and acquisitions on shareholder returns can be measured and obtained
quickly by using event studies methodology. The wealth effect on the bidding and target
shareholders can also be measured daily, weekly or monthly. The announcement of mergers
and acquisitions releases some information to the market which influences the share price
of the merging firms which is increasing or decreasing in response to new information.
Therefore, the shareholders of acquiring and acquired firms can expect a capital gain or loss
instantly following a merger announcement.
3.2.2. The drawbacks of event studies
Although event studies have been considered the most popular measure of abnormal retums,
they do have some weaknesses which are inherent to this technique, while other weaknesses
are more concemed with the operationalising of the technique. This is discussed in the
following section.
(a). Different models
The model used to measure the abnormal retums differs from one author to another. For
example, Allen and Sirmans (1987) employ the mean adjusted retums, Dennis and
McConnell (1986) use the market adjusted retums, Eckbo (1983) and Dodd and Ruback
(1977) employ the market model, Asquith and Kim (1983) implement a model based on
the GAPM method, whilst Langetieg (1978) uses the three-factor performance index.
As these authors employ different models to measure the retums, it is difficult to standardise
the results of the tests from various models. The result from one author is sometimes not
comparable to the others due to model differences.
(b). Different "event time"
The standard of time used by researchers also differs between studies. There is no standard
time of the "event" which can be reliably measured. There are several event periods used as
measures, such as, two day announcement effects, one month announcement effects, and
abnormal retums from a few days before the announcement through to when the outcome is
known. In addition, a different measure within the same category of event periods is
sometimes used.
outcome also differs from one researcher to another. Franks and Harris (1989) measure the
retums four months before the announcement through to one month after the announcement,
Mandelker (1974) takes the month after the announcement through to twelve months after
the effective date, and Asquith (1983) uses the day of the announcement and continues for
240 days after the outcome announcement, Dodd and Ruback (1977) take a period of 12
months before the announcement through to 60 months after the announcement. The
implication of these differences is the creation of different outcomes of abnormal retums for
shareholders of the acquiring and target firms from one study to another and each study
provides its own justification.
(c). Source of economic gains
Most studies of mergers and acquisitions using event studies can not identify the source of
economic gains obtained by the shareholders of the acquiring and acquired firms. Healy
et.al. (1992) point out that there is an inability in share price performance studies to
determine whether mergers and acquisitions create real economic gains for shareholders
and to identify where the gains come from. Further, they say that the real gains from
mergers and acquisitions may arise from different sources, such as operating synergies,
monopoly power and tax savings. However, the event studies can not identify which factor
contributes to the real gains which is reflected in the change in share prices. The share price
performance of the merging firms does not say anything about the source of economic gain
and where it comes from. This is consistent with the argument by Schwart (1984) who
proposes that there is no single caused explanation for the motive of mergers and
acquisitions.
3.3. Accounting numbers
Merger and acquisition effects can be measured by using financial statements or accounting
numbers. The financial statement approach involves analysis and comparison of some
accounting figures before and after mergers for both the acquiring and target firms, such as
profit ratios, leverage ratios, and growth ratios. In some cases, merger effects in the
bidding and target firms are compared with their industry average performance (Healy et.al,
1992 and 1997).
However, accounting data methodology is not as popular as the event study method because
only a few researchers employ this method to measure the effect of mergers or acquisitions
on shareholder wealth. The reason is that there are some weaknesses in the accounting
numbers methodology that will be explained more fully later in this chapter.
Unlike the event studies methodology which mostly uses the announcement date or the
announcement month as the starting point to measure the wealth effect of mergers, the
accounting methodology uses the outcome date-^ (the outcome date =0) as the benchmark to
measure the effect of mergers or acquisitions.
3.3.1, The advantages of accounting numbers
Even though the accounting numbers methodology has some serious problems as a measure
of the wealth effect of mergers and acquisitions, this method, however, has an advantage
which is not found in the event studies methodology. The main reason given for using
accounting numbers to investigate the effect of mergers is that share prices cannot determine
the real economic gains after the merger. Furthermore, the researchers on accounting data
claim that share prices cannot identify the source of real economic gains obtained by the
newly combined firms.
Accounting data has an ability to sort out the real economic gains from mergers and
acquisitions (Healy et.al, 1992 and 1997). They argue that the accounting data measure the
actual economic benefits of the merging firms following a merger. Additionally, they also
say that the accounting performance measurements are able to identify the source of
economic gains for the acquiring and acquired firms.
3.3.2. The drawbacks of accounting numbers
Like event studies, the accounting numbers (financial statement analysis) also have some
weaknesses as a measure for merger performance,
(a). Longer measurements
As Bishop et.al (1987) show, it can take several years for the financial effects of a merger
to enter into the accounting numbers and the analysis of accounting numbers should be
examined over a long period of time. This acknowledges that the effects of mergers and
acquisitions cannot be identified in a couple of days or even a couple of weeks. There is
also a need to take into account the accounting procedures used by both target and bidding
firms to consolidate their financial performance after mergers.
(b). Different accounting policies
The accounting method uses different approaches to measure some variables. Dodd (1976)
argues that the use of accounting methods to measure abnormal retums is questionable
because of the variety of accounting techniques used by different firms. For instance, to
measure an inventory, some companies may use different approaches, such as LIFO, FIFO
or the average cost method. Furthermore, some companies may employ different
approaches in recording their income and expenses whether they use a cash basis or accmal
basis. Because of differences in accounting practices employed from one firm to
another, the results are also different from one to another. Accordingly, there is a bias of
results if the accounting figures from the measurement of abnormal retums is relied upon.
(c). Prone to abuse
There is an opinion in practice that accounting measures of eamings are open to
manipulation. Brealey and Myers (1991) support this opinion, because the use of eamings
in the reported financial statement is sometimes designed for specific purposes. Healy et.al.
(1992) also point out that accounting data can be affected by managerial decisions.
(d). No future expectation
Halpem (1983) argues that accounting data provides no information on the expected impacts
of mergers and acquisitions on the bidding and target firms in the long mn. Accounting
figures are historical data which record all activities in the past. They do not reflect the
expectation of future profitability of firms. Therefore, accounting-based values neither
reflect real asset values nor represent the market value of a firm (Bishop et.al, 1987).
Furthermore, Bishop et.al (1987) argue that the accounting data reports a total value for the
firm by summing up each individual asset. Although those individual values reflect the
market value of the assets, the tme market value of the firm as a whole has not been
reflected. Additionally, assets recorded in the balance sheet are mostly based on a cost
basis, and may not be adjusted for changes according to the market value.
3.4. Empirical evidence on event studies
Event studies use announcement effects as a benchmark for measurement of remms, such as
stock splits, dividend announcement, and merger announcements. In the case of
mergers, the date of merger announcement can be a benchmark as a starting point for
event time. Most studies of mergers and acquisitions which employ the event studies
method define merger announcement as event time =:0. For example, Eckbo (1983), Allen
and Sirmans (1987), Hannan and Wolken (1989), Baradwaj et.al. (1992), Davidson III and
Cheng (1997), and Chang (1998) use the announcement day of any merger attempt as the
event time (t=0 day). Asquith (1983), Dennis and McConnel (1986), Huang and
Walkling (1987) employ the day before the announcement and the announcement day of
mergers as the event time (t=-l day and t=0 day).
Meanwhile, Neely (1987) uses the week of the announcement of a merger proposal as
the event time (t=0 week). Kummer and Hoffmeister (1978), Asquith and Kim (1982),
Agrawal et.al (1992), Brown and Da Silva Rosa (1997), and Gregory (1997) use the
announcement month of merger proposals as the event time (t=0 month). However,
Cotter and Zenner (1994) use the mmour date of any merger attempt as the benchmark for
Some empirical investigations on mergers and acquisitions using event studies to measure
the retums are summarised below.
3.4.1. Mandelker (1974)
The author examines the retums of mergers on shareholders' wealth by using the adjusted
market model developed by Fama and Macbeth (1973). Data on company mergers listed on
the New York Stock Exchange (NYSE) for the period of November 1941 to August 1962.
The cumulative abnormal retums for the share holders of the acquiring firms are 0.037 %
for the period of 40 months before and 40 months after mergers (t=-40 to t =40), and
0.022% for t=-20 to t=10. The limitation of this study is that it does not measure the
cumulative abnormal retums of the acquired firms after mergers. Only the cumulative
abnormal retums for the acquired firms for the period of 40 months until one month before
mergers (t=-40 to t=l) are measured. Hence, no comparative information regarding the
retums for share holders of the acquired firms is provided.
3.4.2. Dodd (1976)
The author investigates the share prices around the dates of takeover offer by using the two
parameter model developed by Sharpe (1964) and Lintner (1965), and modified by Black
(1972). In a sample of 242 companies in Australia, it was found that the shareholders of
the acquiring firms gained abnormal retums prior to the announcement of the offer. This was
because these firms experience good performance and had surplus funds that could be
maximised in a takeover bid. However, on the other hand, they suffered significant losses
after takeover. The shareholders of acquiring firms obtained negative cumulative abnormal
retums (CAR) up to - 10.9% over the 24 months after the announcement of the offer.
This study shows that the retums for shareholders of the acquired firms indicate that they
gain positive abnormal retums. The cumulative abnormal retums rise significantly, up to 25
%, in the month of the public announcement. The takeover announcement is good news
for the acquired firms since the shareholders expected high compensation for their firm, and
acquiring firms.
The weakness in this study is that it measures the retums for a period of 24 months before
and after the announcement of the offer. The 24-month abnormal retums after the
announcements are prone to bias because the momentum of a merger occurs around the
announcement of the offer, and hence, the expected gains or losses occur during that time.
If the abnormal retums are measured over 24 months after the announcements, they can
be influenced by other extemal factors (such as economic situation, intemational share
markets, interest rates) which are less relevant to the measurement of retums as an effect of
the announcement of mergers.
3.4.3. Dodd and Ruback (1977)
The authors investigate the retums flowing from stock market reaction to tender offers by
employing the market model. The sample data used in this study comes from companies
listed on the New York Stock Exchange (NYSE) over the period from 1958 to 1975. The
results indicate that the successful acquiring firms earn 11.66 % for the period of t=-12
months to t=l month which decreases to 2.83 % during the announcement month. Their
cumulative abnormal retums fall to - 1.32 % for the period of 12 months after the
announcement (t=12 months ) , and falls to -4.59 % on 60 months (t =5 years ) after the
announcement.
On the other hand, the shareholders of the target firms experience positive abnormal retums
of 8.79 % for the period of t=-12 to t=l which increase to 20.58 % during the
announcement month. However, their abnormal retums decrease to 7.95 % over the period
of t=l to t=12, falling to -0.98 % at 60 months ( t =5 years) after the announcement.
3.4.4. Langetieg (1978)
The author investigates the magnitude of shareholder gains from mergers. To measure the
wealth effect to shareholders, he employs a three factor performance index based on
Jensen's performance index (1969), Black's zero beta model (1972) and Mandelker's model