Article
Research on a Precision and Accuracy Estimation
Method for Close-range Photogrammetry
Kai-feng Ma1,2,*, Gui-ping Huang1, Hai-jun Xu1, and Wei-feng Wang3
1 School of Resources and Environment, North China University of Water Resources and Electric Power, Zhengzhou 450045, China; [email protected] (G.-P. H.); [email protected] (H.-J. X.) 2 Henan Engineering Laboratory of Pollution Control and Coal Chemical Resources Comprehensive Utilization,
Zhengzhou 451191, China
3 Zhengzhou ChenwayTechnology Co., Ltd, Zhengzhou 450000, China; [email protected] (W.-F. W) * Correspondence: [email protected]; Tel.: +86-13592532875
Abstract: Precision and accuracy estimation is an important index used to reflect the measurement performance and quality of a measurement system. To reveal the significance and connotations of the precision and accuracy estimation index of a close-range photogrammetry system, several common precision and accuracy estimation methods used in close-range photogrammetry are explained from a theoretical perspective, and the mechanism of the internal coincidence precision estimation and the external coincidence accuracy estimation are deduced, respectively. Through detailed experimental design and testing, the validity and reliability of the proposed precision and accuracy estimation methods are verified, which provides strong evidence for the quality control, optimisation, and evaluation of the measurement results from a close-range photogrammetry system. At the same time, it has significance for the further development of precision and accuracy estimation analysis of close-range photogrammetry systems.
Keywords: surveying; close-range photogrammetry;internal coincidence precision estimation; external coincidence accuracy estimation; experimental work; testing
1. Introduction
The most reliable way to evaluate or estimate the measurement accuracy of a measurement system is to use an experimental method, that is, to compare the measured results with true values (control points) directly; however, in this close-range photogrammetry project, if a sufficient number of high-precision control points are deployed, it will take time and effort, and this is not an easy task, therefore, in practical work, the error theory analysis method is used to evaluate the accuracy of the measurement system [1]. One of the methods is to use the law of error propagation to derive the measurement precision according to the functional relationship between the evaluated unknown parameters. Another method is to calculate the measurement precision of the adjustment according to the law of variance-covariance propagation in statistics after photogrammetric bundle adjustment, which is an important method in the evaluation of the performance and accuracy of the measurement system.
Therefore, there are many kinds of evaluation indices used to characterise the measuring accuracy of ameasurement system, such as the internal conforming method for estimation of measurement adjustment precision and measurement repeatability precision, and the external conforming method for external checking of accuracy, and so on. The above two methods of precision evaluation are divided based on the differencesin comparison standard used. The most probable value of the adjustment estimate for comparison standard is the internal coincidence precision, commonly known as precision, using the standard deviation. The external reference value for comparison standard is called external coincidence accuracy, which is generally called accuracy, and uses the root mean square of error (RMSE) [2,3]: however, in most of the literature, there is not
much difference between the two methods in actual use. Here, we mainly study three methods for estimating the measurement precision and accuracy of single-camera close-range photogrammetry.
Since the close-range photogrammetry system is divided into a dual(multi)-camera photogrammetry system and a single-camera photogrammetry system, the above internal coincidence precision estimation method, and external coincidence accuracy estimation method, are all suitable for single-camera and dual(multi)-camera photogrammetry systems; however, in view of the object and characteristics of the experiment, only the precision and accuracy estimation of single-camera photogrammetry system are analysed and tested.
2. Accuracy and Precision Estimation Method
2.1. Internal Coincidence Precision Estimation
2.1.1. Variance-covariance propagation law method
If the self-calibration bundle adjustment of the global solution is used to calculate the adjustment of the measured data [4], the covariance matrix of all its adjustment parameters can be obtained when the unknown parameter correction is obtained. Therefore, according to the meaning of the matrix element in the covariance matrix and the mean square error of unit weight in adjustment calculation, the mean square error of each parameter can be obtained, and the precision estimation of each parameter in adjustment can be realised.
According to the correction results of three types of unknown parameters (measured object points, camera external parameters, and camera internal parameters) in the global solution of the bundle adjustment [4], the relationship between the coefficient matrix of the normal equation and the cofactor matrix of three unknown parameters is as follows:
1 1 33 32 31 23 22 21 13 12 11
)
(
PA
A
N
Q
Q
Q
Q
Q
Q
Q
Q
Q
Q
TX
(1)
Then, according to the post-adjustment unit weight variance
r
PV
V
T
2 0
(r
as redundantobservations), the corresponding covariance matrix can be obtained as follows:
X X
Q
2 0
(2)
From the diagonal element values of the matrix (2), the precision estimates of the parameters in the adjustment can be obtained, that is,
The estimated precision of the measured object points is:
m
1
0Q
11The estimated precision of the camera external parameters is:
m
2
0Q
22The estimated precision of the camera internal parameters is:
m
3
0Q
33The actual measurement accuracy of the obtained values is lower than that of the theoretical estimation when using this precision estimation method. The main reason lies in the fact: (i) the adjustment observation value is generally regarded as an independent random observation value in practical measurement application for the simple calculation, but the adjustment observed value is related in theory and in practice; (ii) the theoretical basis of the error propagation law requires that the measurement error in the adjustment is a random error from the normal distribution thereof, so when the system error compensation in the adjustment system is not complete, the actual measurement precision will be lower than the estimated precision of the adjusted measurement [5].
2.1.2. Repeatable measurement precision method
In actual close-range photogrammetry, the precision of the measurement system is usually evaluated by the repeatable measurement precision of the internal coincidence. It evaluates the working state and performance of the close-range photogrammetry system by multiple repeated measurements of the measured object points, that is to say, under the same measurementconditions; the same object is repeatedly measured. To ensure the validity and reliability of the measurement results, the precision of repeatable measurement is calculated by investigating the consistency between measurements, so as to evaluate the actual working precision and the stability of the measurement system.
In close-range photogrammetry, the method of checking the repeatability precision of the measurement system is generally as follows: under the same measurement conditions, the camera internal parameters remain unchanged and the measured object point is fixed in the short-term, and the same object points are measured using the same camera with the same measuring geometric network for
m
times. If the self-calibration bundle adjustment was used in subsequent calculations, the coordinates of the measured object points (repeatedm
times) were (Xij,Yij,Zij),(
i
1
,
2
,
,
m
;
j1,2,,n, wherem
is the number of repeat measurements,n
is the number of measured object points), then to transform the object point coordinates of repeated measurement into a unified coordinate system by common points (coded targets) [6], and the RMS of the difference between the measured results of the measured same object points for any two times (for example, theK
andH
times) can be obtained., that is the precision of coordinate repeatability measurement of the photogrammetry system, as shown in (3) to (5):1 ) ( ) ( )
( 2 2
2 2 2 1 1 n X X X X X X
RMS K H K H Kn Hn
X (3)
1
)
(
)
(
)
(
2 2 2 22 1 1
n
Y
Y
Y
Y
Y
Y
RMS
K H K H Kn HnY
(4)1
)
(
)
(
)
(
2 22 2 2 1 1
n
Z
Z
Z
Z
Z
Z
RMS
K H K H Kn HnZ
(5)
Where, RMSX ,
RMS
Y,RMSZ are the RMS errors in the direction of x, y, and z between the measured resultsK
andH
times, respectively.According to the law of combination of errors, the RMS error of a 3-d point location can be obtained from: 2 2 2 Z Y X
P
RMS
RMS
RMS
RMS
(6)If the precision of any two measurements is the same, the internal coincidence accuracy of the single measurement result of the measurement system can be obtained by the law of error propagation, such that:RMSP/ 2.
In fact, when only random errors were contained in the observed values of the processing of photogrammetric adjustment, the repeated measurement precision of the internal coincidence is consistent with the actual measurement accuracy. However, if large systematic errors, or even gross errors, were contained within the observed values during data-processing, the repeated measurement precision of the internal coincidence is generally higher than that in practice. Therefore, when the internal coincidence precision of the obtained measurement results is high, the actual measurement accuracy is not necessarily high, but if the internal coincidence precision of the obtained measurement results is low, it reflects the fact that the actual measurement accuracy of the measurement system is low.
2.2. External Coincidence Accuracy Estimation
The accuracy of external coincidence is a more objective, truer, method of accuracy evaluation, which is generally obtained by comparing the measurement results from the measurement system with the higher precision external check conditions.
In close-range photogrammetry, the external checking conditions are generally used in a certain number of redundant controls, including redundant control points, or relative geometric control conditions. The absolute coordinates of the control points obtained by the measurement system with high accuracy (such as a high-accuracy double theodolite system, high-grade photogrammetry system, coordinate measuring machine (CMM), laser tracker, etc.) are regarded as true values, and then the coordinate results obtained by close-range photogrammetry are compared with them, and the median errors of coordinate errors can be obtained by statistical analysis and calculation. The relative geometric control condition between redundant measurement points is a relatively simple and objective test method. The most common method is to use the length measured by a dual-frequency laser interferometer or calibrated multiple scale-bars as the control conditions for geometric length, and the comparison of the measured length is then possible.
The internationally recognised accuracy test standard VDI/VDE Guideline 2634 Part1 for close-range photogrammetry systems is a set of accuracy testing guidelines issued by Association of German Engineers/Association for Electrical, Electronic & Information Technologies in 2002, and certified by ISO 10360-2 [7-10]. In VDI/VDE Part 1, the measurement accuracy of a close-range photogrammetry system is evaluated by measuring the length of seven calibrated scale-bars set in the cube frame. Then the measurement accuracy of the measurement system is evaluated by comparing with the actual measurement length of these scale-bars.
Due to the limited test conditions, the test of the external accuracy of the close-range photogrammetry system could not be completed by using the standard accuracy test field of the VDI/VDE Guideline 2634 Part 1, however, according to the existing conditions, other methods were used here to test, and verify, the external accuracy of the close-range photogrammetry system as described below.
2.3. Fraser Precision Estimate
Therefore, in the practical application of three-dimensional coordinate measurement with a single-camera and multiple images in close-range photogrammetry, to improve the measuring accuracy of measurement system, we will consider the optimisation of the spatial distribution of the camera station relative to the measured object [4]: because the measurement accuracy of the three-dimensional coordinates of the measured object points is also related to the geometric structure of the spatial network in the measurement area, which mainly includes the spatial geometric relationship of the target points, the camera station position, the shooting distance, the camera focal length, and so on, are important. Therefore, under the constraint of the imposed correlation conditions, Fraser gives another precision estimation formula for the three-dimensional coordinates of the measured object points [13-18]:
xy XYZ
n
S
q
(7)where
XYZ
is the standard deviation of the three-dimensional coordinates of the measured object points,q
is the intensity factor of the spatial geometric structure in photogrammetry, which generally varies from 0.4 to 0.8 with the strength of the spatial geometric structure,S
is the average scale number of the image, usually using the ratio of the average distance of photography to the focal length of the camera,n
is the number of images per station, and in single-camera multi-image photogrammetry, the general value ofn
is 1,xy
is standard error (precision) of image coordinate measurement.3. Testing, Results and Discussion
Aiming at the precision estimation methods of the close-range photogrammetry system, the measurement accuracy of the close-range photogrammetry system is tested and verified.
3.1. Precision Test and Estimation of Internal Coincidence
The relationship between the coefficient matrix of the normal equation and the covariance matrix of three kinds of unknown parameters is directly used in the variance-covariance propagation method based on self-calibration bundle adjustment, and the accuracy estimates of the three classes of unknown parameters are calculated by combining the posterior mean square error of unit weight which is simple and intuitive. Therefore, only the test and results of repeatable measurement precision of the internal coincidence are given here.The precision test of repeatable measurement was carried out in the indoor three-dimensional verification field of Zhengzhou Chenway Technology Co., Ltd, China. The object of the test is the fixed three-dimensional verification frame in laboratory (Figure 1(a)), on which there are about 1250 retro-reflective targets (RRT), and the range is about 3m×2m×0.6m.
(a) (b)
Figure 1. Experimental map used for internal coincidence precision testing: (a) Three-dimensional test frame; (b) Distribution of camera stations
Table 1. Repeatability measurement results: CIM-1 camera photogrammetry system (units: mm)
Repeatability
measurement precision RMSX RMSY RMSZ RMSP
Group 1 VS. Group 2 0.011 0.007 0.011 0.017
Group 1 VS. Group 3 0.012 0.008 0.010 0.018
Group 2 VS. Group 3 0.012 0.009 0.011 0.018
Average value 0.012 0.008 0.011 0.018
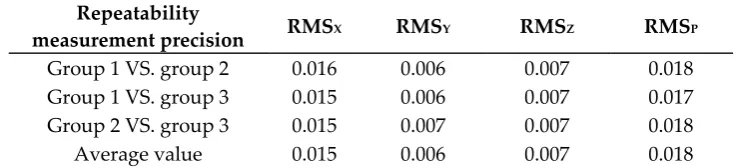
Table 2. Repeatability measurement results: INCA3 camera photogrammetry system (units: mm)
Repeatability
measurement precision RMSX RMSY RMSZ RMSP
Group 1 VS. group 2 0.016 0.006 0.007 0.018
Group 1 VS. group 3 0.015 0.006 0.007 0.017
Group 2 VS. group 3 0.015 0.007 0.007 0.018
Average value 0.015 0.006 0.007 0.018
The test results in Tables 1 and 2 show that the measurement precision of the CIM-1 camera photogrammetry system matched that of the INCA3 camera photogrammetry system within the range of about 3m, with a precision of about 0.018mm. The relative measurement precision is about 1:200,000, and the point position precision of a single measurement is about 0.013mm.
3.2. Accuracy Test and Estimation of External Coincidence
The accuracy estimation of external coincidence of close-range photogrammetry system can be carried out by coordinate alignment method and standard length method.
3.2.1. Standard length method
A certain number of RRTs are pasted on the support of the air-floating motion platform of the dual-frequency laser interferometer with high-precision measurement performance. With the movement of the air-floating platform of the dual-frequency laser interferometer, the corresponding RRT on the support at different positions form a ‘’reference ruler” similar to that used during high-precision calibration. Then it is compared with the corresponding length of the ‘’reference ruler’’ measured by the close-range photogrammetry system to evaluate the external coincidence accuracy of the close-range photogrammetry system. The uncertainty of the length measured by the dual-frequency laser interferometer is 0.1μm+0.1μm/m.
2 were set as the point numbers at the original position 1 when the air-floating platform was not moving. When one stage in the photogrammetry process ends the air-floating platform moves from position 1 to position 2, the corresponding target point numbers are changed to B1 to B8. At the same time, in another photogrammetric stage, the air-floating platform moves from position 2 to position 3, and the corresponding target point numbers are changed to C1 to C8. Therefore, from Figure 2, it can be seen that the distances moved by the air-floating platform can be accurately measured by the dual-frequency laser interferometer, so the distance from Ai to Bi and Bi to Ci (i=1, ..., 8) are also the lengths as accurately measured by the dual-frequency laser interferometer, respectively. The length from Ai to Bi is regarded as the ‘’scale-bar’’ in the data processing of close-range photogrammetry, and is recorded as L1. The length from Bi to Ci is regarded as a ‘’standard length’’, and is recorded as L2, which is used as the test scale for external conformance accuracy. Of course, the air-floating platform can also move into multiple positions, and we can record its travel distance as a ‘’scale-bar’’ when data processing is used, or it is used as a verifiable ‘’standard length’’.
Marble Rail RRT
Air-floating Platform
Position 1 Position 3 Position 2
L
2L
1A1
A2
A3
A4
A5
A6
A7
A8
C1
C2
C3
C4
C5
C6
C7
C8
B1
B2
B3
B4
B5
B6
B7
B8
Figure 2. Experimental set-up:standard length method
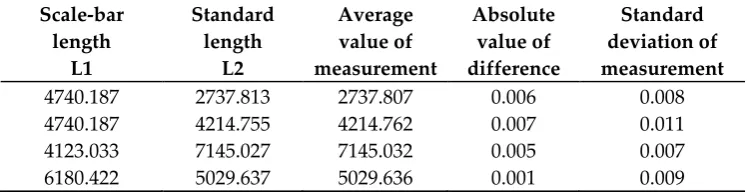
To evaluate the measurement performance of the CIM-1 (S/N:1081010001) camera photogrammetry system, four groups of experiments were carried out in the National Institute of Metrology by using the standard length method. The experimental results are shown in Table 3.
Table 3. Experimental results:standard length method (units: mm)
Scale-bar length
L1
Standard length
L2
Average value of measurement
Absolute value of difference
Standard deviation of measurement
4740.187 2737.813 2737.807 0.006 0.008
4740.187 4214.755 4214.762 0.007 0.011
4123.033 7145.027 7145.032 0.005 0.007
6180.422 5029.637 5029.636 0.001 0.009
From the experimental results listed in Table 3, we can see that the measurement performance of the CIM-1 photogrammetry system is good and the measurement accuracy is relatively high. The difference between measurement value and the standard length is no more than 0.007mm, and the smallest difference is only 0.001mm.
3.2.2. Coordinate comparison method
sets of deviation statistical results of the same measured target points after coordinate transformation between the two photogrammetry systems. Therefore, from the law of error propagation, it can be shown that:
2 3 2
d transforme
measured
RMS
RMS
INCARMS
(8)Where
measured
RMS
is the RMSE of the evaluated camera photogrammetric system,d transforme
RMS
is the RMS of the deviation of the coordinate transformation between the two sets of photogrammetry systems,INCA3
RMS
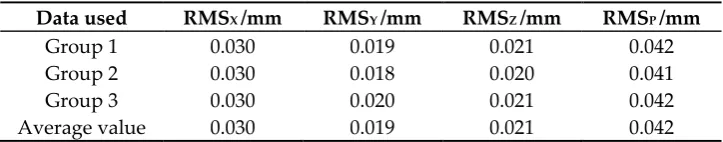
is the nominal RMSE of the INCA3 camera photogrammetry system.Similarly, to evaluate the measurement performance of the CIM-1 (S/N:1081010001) camera photogrammetry system, the aforementioned coordinate comparison method is used. Three groups of experiments were carried out in the photogrammetry system verification laboratory using the CIM-1 and INCA3(S/N: 30307a+)camera photogrammetry systems, respectively. The experimental results are shown in Table 4.
Table 4. Measurement results: coordinate comparison
Data used RMSX /mm RMSY /mm RMSZ /mm RMSP /mm
Group 1 0.030 0.019 0.021 0.042
Group 2 0.030 0.018 0.020 0.041
Group 3 0.030 0.020 0.021 0.042
Average value 0.030 0.019 0.021 0.042
The experimental results listed in Table 4 show that the
RMS
transformed of conversion deviation of two sets of photogrammetric system based on a common point is 0.042mm, the measuring accuracyRMS
INCA3 of the INCA3 camera photogrammetry system is 5μm+5μm×3.6m=0.023mm, so we can find the measurement precision of the CIM-1 camera photogrammetry system to be:mm
RMS
RMS
RMS
measured
transforme2 d
INCA2 3
0
.
035
It can be seen that the relative measurement accuracy is 1:102,857, which shows that the CIM-1 camera photogrammetry system also provides good measurement accuracy.
3.3. Fraser Precision Test and Estimation
(a) (b)
Figure 3. Measured object and distribution of camera positions: (a) Carbon-fibre parabolic antenna; (b) Distribution of camera positions
First, formula (7) is used to estimate the accuracy, and some parameters are selected according to the actual measurement, such as q=0.8; S can be calculated from the shooting distance of 1.5m and the camera focal length of 24.5mm; the value of n is 1, and the measurement accuracy of the image coordinates is about 0.04pixels according to the experimental statistics. By inserting these values into formula (7), we find that
XYZ
0
.
01
mm
.Then, five groups of photographs were taken according to the experimental requirements, and the data were processed by bundle adjustment. The results are shown in Table 5.
Table 5. Precision statistics for photogrammetric bundle adjustment
Camera Group count
Precision estimationRMS /mm
X Y Z Total
Chenway S36
1 0.008 0.004 0.005 0.010
2 0.009 0.004 0.006 0.012
3 0.008 0.005 0.006 0.011
4 0.009 0.004 0.006 0.012
5 0.009 0.004 0.005 0.011
The precision estimation value of the measured target points calculated by Fraser precision estimation is
XYZ 0.01mm, and from Table 5, we can see that the accuracy of the syntheticposition of three-dimensional coordinates of the measured object is about 0.011mm by taking the actual photograph and using bundle adjustment. It can be seen that the precision estimation results obtained by the two methods are consistent, so the accuracy, and validity, of the Fraser precision estimation are verified by actual, measured data.
4. Conclusions
We have verified the suitability of the precision and accuracy estimation method of a close-range photogrammetry system. Initially, three methods for the precision and accuracy estimation method of a close-range photogrammetry system were considered: one involved the precision estimation of the internal coincidence, another, the accuracy estimation of the external coincidence, and the other the Fraser precision estimate.
this can be used to estimate the precision of a measurement system for various measured objects and measuring environments. However, the accuracy estimation of external coincidence is more objective and persuasive, but it depends on certain specialised instruments and equipment, such as a dual-frequency laser interferometer, and so on. Therefore, the realisation, and application, of external coincidence accuracy estimation have certain limitations. In addition, Fraser precision estimation also requires some known parameters, but it can be used as an auxiliary reference for the other two precision estimation methods.
These methods have their own characteristics and advantages, and they have been used to evaluate the quality of measurement results for a suitable measurement object and in a range of environments.
Acknowledgments: This work was supported by Open Fund Program of Henan Engineering Laboratory of Pollution Control and Coal Chemical Resources Comprehensive Utilization (NO. 502002-B07, 502002-A04) and the National Natural Science Foundation of China (NO. 51474217, 41501562)
Author Contributions: Kai-feng Ma analyzed the data and prepared the manuscript; Gui-ping Huang contributed to the theory studies and designed the experiments; Hai-jun Xu examined the quality of this work; Wei-feng Wang performed the experiments. All authors reviewed the manuscript.
Conflicts of Interest: The authors declare no conflict of interest.
References
1. Fei, Y.T. Error theory and data processing, 6th ed.; Mechanical Industry Press: Beijing, China, 2010; pp94-116, ISBN 7-111-07599-4.
2. Yang, Y.X. Some notes on uncertainty, uncertainty measure and accuracy in satellite navigation. Acta Geodaetica et Cartographica Sinica2012, 41(5): 646-650.
3. Walford, A. One Part in 300,000. Precision and Accuracy Discussion. Report, Eos Systems Inc, 2006. 4. Huang, G.P. Theorys, methods and applications of digital close range industrial photogrammetry. Science Press:
Beijing, China, 2016; pp32-36, ISBN 978-7-03-046430-9.
5. Sui, L.F.; Song, L.J.; Cai, H.Z. Errors theory and foundation of surveying adjustment. Surveying and Mapping Press: Beijing, China, 2010; pp1-40, ISBN 978-7-5030-1952-4.
6. Wang,Y.; Zhang, G.J.; Wang, J.L. A calibration method based on coplanar reference objectfor multi stereo vision sensors. Journal of Optoelectronics·Laser2008, 19(6): 754-757, DOI:10.16136/j.joel.2008.06.032.
7. Haig, C.; Heipke, C.; Wiggenhagen, M. Lens inclination due to instable fixings detected and verified with VDI/VDE 2634 Part 1. The International Archives of Photogrammetry, Remote Sensing and Spatial Information Sciences, 2006, 6.Part 5.
8. Rieke-Zapp, D. H.; Tecklenburg, W.; Peipe, J.; Hastedt, H.; Luhmann, T. Performance evaluation of several high-quality digital cameras. The International Archives of Photogrammetry, Remote Sensing and Spatial Information Sciences, 2008, 37(Part B5): 7-12.
9. Hastedt, H.; Luhmann, T.; Tecklenburg, W. Image-variant interior orientation and sensor modelling of high quality digital cameras. The International Archives of Photogrammetry, Remote Sensing and Spatial Information Sciences, 2002, 34(5): 27-32.
10. VDI/VDE 2634 Part 1, Optical 3D measuring systems -Imaging systems with point-by-point probing 2002-05, Verein Deutscher Ingenieure. http://www.vdi.de last accessed 21 April 2010.
11. Fraser, C. S. Digital camera self-calibration. ISPRS Journal of Photogrammetry and Remote sensing1997, 52(4): 149-159, DOI·10.1016/S 0924-2716(97)00005-1.
12. Remondino, F.; Fraser, C. Digital camera calibration methods: considerations and comparisons. The International Archives of Photogrammetry, Remote Sensing and Spatial Information Sciences, 2006, 36(5): 266-272.
13. Fekete, K.; Schrott, P. Qualification of close range photogrammetry cameras by average image coordinates RMS error VS. object distance function. The International Archives of the Photogrammetry, Remote Sensing and Spatial Information Sciences, 2008, 37(B5): 149-152.
14. Tuominen, V.; Niini, I. Verification of the accuracy of a real-time optical 3D-measuring system on production line. The International Archives of the Photogrammetry, Remote Sensing and Spatial Information Sciences, 2008, 37: 13-19.
16. Mason, S.O. Conceptual model of the convergent multistation network configuration task. Photogrammetric Record, 1995, 15(86): 277-299, DOI·10.1111/0031-868X.00032.
17. Menna, F,; Troisi, S. Photogrammetric 3D modelling of a boat’s hull. Proceedings of Optical 3D Measurement Techniques Conference, 2007, 2: 347-354.