CSEIT183541 | Received : 05 May 2018 | Accepted : 14 May 2018 | May-June-2018 [ (3)5 : 120-131 ]
© 2018 IJSRCSEIT | Volume 3 | Issue 5 | ISSN : 2456-3307
Impact of Mobility on Routing Protocols in MANET using NS2
B. Basaveswara Rao#1, SK. Meera Sharief *2, K. GangadharRao#3
#Department of Computer Science and Engineering, Acharya Nagarjuna University, Guntur, Andhra Pradesh, India
*Department of Computer Science and Engineering, GIET College of Engineering, Rajahmundry, Andhra Pradesh, India
ABSTRACT
This paper investigates the impact of mobility patterns on different routing protocols in MANET through NS2. The simulation study is carried out in two schemes and they are classified based on buffer availability at node. They are (a) a finite buffer is created at each node called Buffer Node (BN Scheme) and (b) buffer facility is not available at each node called Buffer Less Node (BLN Scheme). In this simulation study Random Way Point Mobility Model is considered with mobility parameters are speed and pause times are considered for reactive (AODV and DSR) and proactive (DSDV) routing protocols. The simulation study is performed and to evaluate three performance metrics for both BN and BLN environments to identify the impact of mobility on routing protocols in MANET. The performance metrics are Packet Delivery Ratio (PDR), End to End Delay (E-ED) and Average Routing Load (ARL) are considered. For various configurations selective ten runs were performed for each result. Finally the results are presented and draw conclusions. Based on these results to get an idea about the implementation of protocols with respect to mobility of these two schems.
Keywords : MANET, AODV, DSDV, DSR, Mobility Parameters, Queuing Parameters, QoS, CBR, PDR, BN, BLN, E-ED, ARL.
I.
INTRODUCTIONMobile Ad hoc Network is a wireless network of mobile routers or hosts formed by the union of arbitrary topology which is connected by wireless links, and it configures itself by its own. This is basically infrastructure less and no centralized controller. The router moves freely from one place to another within the area and they organize themselves randomly. It consists of mobile nodes which have more mobility without any centralized administration and they can join or leave the network at their own time. Mobile nodes are in the state of mobility in the network so that communication between source and destination
nodes can be possible if they are in same radio transmission range or indirectly by using multi-hopping technique. The neighboring nodes act as intermediate nodes in which source and destination nodes are not within the same radio transmission range then multi-hop concept will be used. It is very difficult to maintain the connectivity between the nodes in MANETS because of the intrinsic complexity of routing between any given pair of nodes. Because of dynamic topology of MANET, there are new challenges for routing protocols, researchers are comparing and improving existing routing protocols using simulations.
transmitted information with one or more hops between the nodes. In this decade the growth of laptops and Wi-Fi utilization has made more complexity in routing mechanisms. The mobility is an essential characteristic of MANETS which necessitates the study of the performance of protocols for designing/developing new protocols so here considered the mobility parameters as Pause time and Speed.
The performance evaluation of several routing protocols in MANET with different traffic loads, mobility models, scalability factors, number of nodes and different metrics was developed [1, 2, 4, 5, 6 and 7]. It is difficult to analyze or measure the metrics and finding the performance metrics of routing protocols of a MANET without using a queuing model. The limited buffer size in queuing model will be more realistic in calculating Packet Delivery Ratio (PDR), End to End (E-E) Delay and Average Routing Load (ARL). If there is no restriction in buffer size then the each nodes keep bundles in their buffer and relay them to the nodes they encounter until they deliver them to the destination, in that case they drop them from their buffers. Also when a bundle reaches TTL, it is also dropped from the buffer. Now that the buffer has a limited size, implement the following management policy: when a new bundle arrives at a node and if the buffer does not have room for it, it later buffers [8]. It eliminates the oldest bundle it has in the stock and which has been not relayed until that point and replaces the new one. As per the dynamic nature of the nodes it is important to study the performance of routing protocols through simulation.
BN and BLN schemes were considered for MANET mobility model and Mobility parameters as Speed and Pause time .There is fundamental need to simulate and study the creation of real time Mobile Ad Hoc Networks with, Packet Delivery Ratio, End to End Delay and Average Routing Load at each node should be high, very low and low respectively. To
achieve this objective the successive contributions have to be done for identifying the impact.
It explores the comparison between the performance of two schemes BN & BLN and also amongst the flat topological routing protocols as proactive (DSDV) and reactive (AODV and DSR) routing protocols.
In BN scheme the packet arrival rate and the service rate at the node kept constant with finite buffer fixed for 30 nodes may be varied pause time and speed at regular interval.
In BLN Scheme number of nodes is kept constant with a value of 30 and pause time and speed may be varied at a regular interval.
Simulation of AODV, DSR, and DSDV routing protocols performance measures PDR, E-E Delay and Average Routing Load are studied in 2 scenarios i.e. pause time and speed for both the schemes i.e. BN and BLN.
This paper is organized as: Section 2 discusses the related research work in flat topological routing protocols, MANET Models, and Queuing System; Section 3 explains about the Mobility models as MANET Topology, Buffered Node, No Buffer Node and Mobility Model; Section 4 discusses about the Simulation Methodology which describes about simulation parameters as Queuing Parameters and mobility parameters; In Section 5 in deepness it describes about Simulation Result Analysis and performance of different protocols in the Mobile ad hoc Network with and without Queuing Approach and; Section 6 describes about Conclusion and Future Work of the Research Paper.
II.
Related Workmetrics i.e., high throughput and low end to end delay.
Laxmi Shrivastava, [1] has compared the evaluation of routing protocols such as AODV, DSDV and DSR in mobile adhoc network with different traffic load as heavy and low , finally concluded that reactive protocols perform better that proactive protocols that is DSR has performed well compared to AODV and DSDV in simulation run of heavy traffic load with 40 connections. These protocols are evaluated by means of number of dropped data packets, average delay, packet delivery ratio versus all the routing protocols with CBR 20 and 40.
S.Mohapatra,[2] has identified the performance analysis of AODV, DSR, OLSR and DSDV Routing protocols using NS2. These protocols were analyzed in three Scenarios by using number of nodes vs Throughput, End to End Delay and Control Over Head. Finally they identified that the DSR protocol is the best in Packet Delivery Ratio and OLSR is the optimum at high mobility ratio.
Kirti Jain, [3] has compared the influence of mobility models that is totally different mobility models in the performance evaluation of mobile ad hoc network routing protocols such as AODV, DSDV and DSR and concluded that these protocols achieve high packet delivery ratio and the least overhead with random waypoint model where as low packet delivery ration and high overhead with city section model.
o.o omitola, [9] has performed a performance evaluation of AODV, DSR, and TORA routing protocols in MANETs by varying number of nodes and different metrics with two different scenarios as conference and event scenarios both of these scenarios DSR perform better that AODV and TORA in terms of throughput, AODV showed a moderate result. Interms of delay AODV outperforms DSR and TORA.
A.Lee [4] has developed an adaptive-gossip algorithm with probability pn for reducing the routing overhead, over the flooding based routing method in a queuing network model based on ad hoc routing networks for multimedia communications. Pan Li[5] has employed a practical restricted random mobility model by proposing a new multi hop relay scheme for smooth trade-offs between throughput and delay by controlling the nodes mobility independent of network size. Saad Talib [6] designed a model for queuing approach of two queue mechanisms (Drop tail and Random Exponential Marking) at each node of network for evaluating the performance of certain MANET parameters. When simulation area is increased it is observed that low throughput with REM and Drop tail, REM gives low delay compared with Drop tail, but in packet loss drop tail is better than REM.
A.H.Zakaria [7] has performed performance analysis in MANETs using queuing theory by determining its arrival times, average waiting times and response time for DSR protocol by varying the input arrival rates using the queuing system M/G/1. They observed that if the number of hops increase then there is an increase in the values of waiting time and average response time. Mouna A.[8] have identified two important issues namely encounter and exchange using a limited buffer management constraint for performance of DTMN if there is ill behaved mobility schemes and its improvement by introducing relay nodes for poor performance factor of DTMN. Rekha[10] has considered AODV, DSDV, and DSR for comparison of MANET parameter in Packet Delivery Ratio fraction and End to End Delay such that increase in density of nodes yields to an increase in the Mean E-E Delay and increase in the pause time leads to a decrease in the E-E Delay and finally the increase in number of nodes will cause an increase in the mean time for loop detection without using any queuing model.
MANET and applied the concept of RED (Random Early Discard) algorithm on TCP to maintain the packets in the buffer and also reaches the destination node with low packet delivery time.
B. Basaveswara Rao and SK M Sharief [12] has simulated different routing protocols in MANET with and without buffer nodes and their performance metrics are evaluated and compared in AODV, DSDV and DSR as reactive and proactive routing. These protocols are performed under the influence of buffered node and no buffer node using different performance metrics as packet delivery ratio, average routing load and End to End delay by varying number of nodes, service rate and arrival rate were performed in buffered node scheme where as number of nodes was performed in No buffer node scheme.
III.
PreliminariesMANET Mobility models are different types are available based on the different strategy and approach. MANET topology is an random model in which the nodes are having self-governing mobility with a variable network model N, which is a limited set of mobile nodes (1,2,3,…N) and the nodes are autonomously placed in a throughway scenario with an area of A(a X b) where a is the length and b is the width of the rectangular freeway scenario area. Each node is assumed to have the transmission range Tr. Let “ld” denote the distance between nodes a and b. Nodes a and b are said to be neighbors if theyare in the same transmission range that is they can directly communicate with each other, that is if ld < Tr . There are N Nodes in the mobile ad hoc network where node S is the source and node D is destination for the packet transmission. The transmission of data or packets may be transferred or traversed from S to D using intermediate nodes called neighbor node and if the Source node S and Destination node D are with in the same transmission range then there is no intermediate node is involved as neighbor nodes. The
protocols AODV, DSR, and DSDV are chosen for the study because of the flat routing protocols and they follow the same configurations .The buffer centric schemes are taken from [12] BN and BLN Schemes. BN and BLN schemes are performed for identifying the impact of mobility on the routing protocols. The comparison of routing protocol under several constraints were performed earlier (1, 2, 3, 4, 5, 6, 7, 8) but this paper proposes the buffer schemes under the mobility parameters pause time and speed were considered for the comparison. In simulation study number of nodes (N), 𝜆 and 𝝻 are fixed for different scenarios and protocols (AODV, DSDV, and DSR) in two cases. Where 𝜆 is arrival rate (expected number of arrivals per unit time) and 𝝻 is service rate(expected number of transmitting service per unit time). Arrival rate and service rate follows exponential distribution. In these parameters one is varied and the other are kept constant resulting two different cases they are Pause Time increasing Scenario and Speed increasing Scenario.
Random Waypoint Model (RWP):
Mobility model describes the way of mobile nodes travel in the network area. In this, nodes may travel in any direction and at any speed based on pause time, speed and other characteristics. The random way point mobility model is used as network node mobility model for the mobile ad hoc network. The mobility model plays a vital role in the evaluation of the performance metrics of MANET. In Random way mobility model every node has speed and pause time attributes. Initially the nodes are positioned randomly in the mobile ad hoc network area. The nodes are moving in the network based on the pause time and speed of each node until the end of the simulation time. Normally mobile nodes travel near the center of mobile ad hoc network area or simulation area. This mobility model happens to be widely used one hence chosen.
Simulation of computer networks is performed by using a Network Simulator tool. There are different computer network simulator tools are available. The general networks simulators are ns2, ns3, Omnet++, Opnet, Qualnet, Mininet, Onesim, Cooja, Tossim, Veins, Sumo, Glomosim, Peersim, WSN Simulator, GNS3, JIST/SWANS ,TETCOS NetSim etc. for research work in computer networks. It is really a difficult task of implementation of large networks and establishment of routers in real time and also cost effective. It is easy for every researcher to perform the experiments in the network simulator using simulation techniques and programs. NS2 is a network simulator tool version 2 used for network establishment, their implementation, simulation of real time networks, designing of network protocols, monitoring of node parameters and other parameters as required by the user or researcher. The application is very easy to implement and perform the experiments in a realistic nature by using NS (Network Simulator), the other ancestors of the ns is ns1, ns2, ns3. NS2 is free software, any user can access NS2 for research, development, and work outs without any financial overhead in linux and windows platforms. There is no significant difference between the real & simulation results hence no need of real infrastructure as a cost effective metric.
IV.
Simulation MethodologyThe simulation generally performed based on the preliminaries as discussed in the above and the objective of simulation is to identify the impact of mobility and quantify the effects of various factors and their interactions on the overall performance before correlating it to the exact image of today’s real applications. Each run of the network simulator accepts input scenario file that describes the exact motion of each node and transmission of data using BN and BLN schemes with the given pause time and speed. The evaluation of the performance at a particular factor can be measured as the average of 10 random simulation runs for the 10 generated random scenario patterns. Performance of the considered
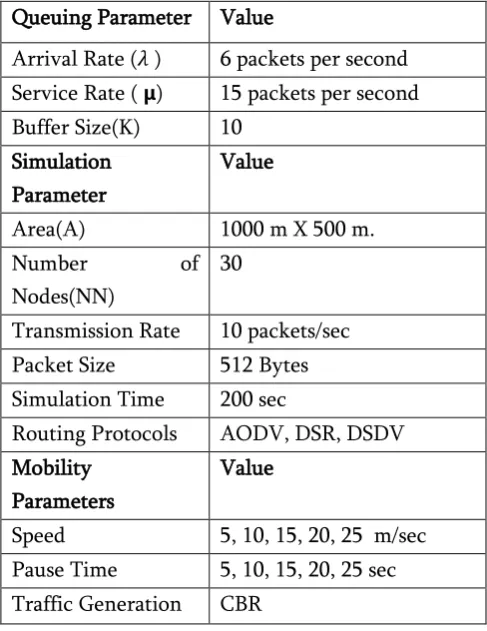
factor is the average of these 10 output simulation runs. In all the simulation runs each one takes 10 sample points of particular factors and verified three different protocols i.e. AODV, DSR, and DSDV. Hence 150 simulation runs for each case were performed to analyze each performance factor for these three protocols. The Parameters that are to be taken in the simulation are divided into three types as Queuing Parameters, Simulation Parameters and Mobility Parameters; the same are presented in table 4.1. Queuing Parameters are arrival rate, service rate and buffer size of the queue. The simulation parameters are area of the network, number of nodes, transmission rate, packet size, simulation time, routing protocols. Whereas mobility parameters are speed of the node, pause time, mobility model and CBR traffic generation. All the parameters are common to both BN and BLN Schemes.
Table 4.1: Simulation Parameters
Queuing Parameter Value
Arrival Rate (𝜆 ) 6 packets per second Service Rate ( 𝝻) 15 packets per second Buffer Size(K) 10
Simulation Parameter
Value
Area(A) 1000 m X 500 m.
Number of
Nodes(NN)
30
Transmission Rate 10 packets/sec Packet Size 512 Bytes Simulation Time 200 sec
Routing Protocols AODV, DSR, DSDV Mobility
Parameters
Value
Performance Metrics:
The performance metrics are used to quantify the affect of routing protocol to reach the QoS. To calculate the performance and Quality of Service issues in MANET, the performance metrics are identified as Packet Delivery Ratio, End to End Delay, and Average Routing Load [12]
Packet Delivery Ratio (PDR) is the ratio of successfully delivered packets to the destination compared to the total number of packets that are generated or sent from the sender can be given as
PDR=(Received Pkts / Generated Pkts)*100[12]
(1)
End to End Delay is the difference between the received time of the packet and the sent time of the packet.
ETE Delay [Pkt Id]=Received Time[Pkt Id]-Sent
Time [Pkt Id] [12]
(2)
Average Routing Load defined as the total number of routing packets (Control packet sent + Forward) transmitted per data packet delivered at the destination.
ARL=((Control Pkts Sent+Control Pkts Forward)/Data Pkts Received)*100 [12] (3)
V.
Results and DiscussionsIn this study the performance of the MANET was evaluated by applying two types of schemes and the results are presented below by scheme wise.
BLN SCHEME:
In this scheme buffer was not available at each node and the pause time and speed are varied from 5 to 25 with an interval of 5.The scheme is extended by two scenarios namely pause time increasing scenario and speed increasing scenario.
PAUSE TIME INCREASING SCENARIO:
In this scenario three performance parameters were considered as packet delivery ratio, end to end delay and Average routing load. Pause time is varied from 5 to 25 with 5 interval time as 5, 10, 15, 20, 25 where as the nodes are fixed at 30 number of nodes and constant speed 10. The remaining parameters are fixed as usual for this case as per parameter table.
Fig.1: Pause Time vs Packet Delivery Ratio
In Fig.1 if there is increase in the pause time , all the protocols performed a constant performance at their level but in the comparison at any given pause time AODV performed nearly 100% packet delivery ratio as compared with other protocols. Whereas DSR protocol performed well as compared with DSDV protocol.
Fig.2: Pause Time vs End to End Delay 0
20 40 60 80 100 120
5 10 15 20 25
PD
R
%
Pause Time
Packet Delivery Ratio with out buffer
AODV
DSR
DSDV
0 20 40 60 80 100 120 140 160 180
5 10 15 20 25
En
d
t
o
E
n
d
Delay
Pause Time
End to End Delay with out Buffer
AODV
DSR
In Fig.2 if there is increase in the pause time, from 5 to 20 DSDV protocol performed low delay as compared with other protocols. Whereas DSR protocol very high at 20 and low at 25 compared with other protocols.
Fig.3: Pause Time vs Average Routing Load
In Fig.3 if there is increase in the pause time, all the protocols performed a different performance at their level but in the comparison at any given pause times, AODV protocol performed low routing load as compared with other protocols.
SPEED INCREASING SCENARIO
In this scenario three performance parameters were considered as packet delivery ratio, end to end delay and Average routing load. Speed is varied from 5 to 25 with 5 intervals time as 5, 10, 15, 20, 25 where as the nodes are fixed at 30 number of nodes and constant pause time 10. The remaining parameters are fixed as usual for this case as per parameter table.
Fig.4: Speed vs Packet Delivery Ratio
In Fig.4 if there is increase in the speed, AODV performed nearly 100% packet delivery ratio as compared with other protocols. In this DSR protocol performed well as compared with DSDV protocol.
Fig.5: Speed vs End to End Delay
In Fig.5 if there is increase in the speed, from 5 to 25 DSDV protocol performed low delay as compared with other protocols. Whereas DSR protocol very high at 20 compared with other protocols.
0 0.5 1 1.5 2 2.5 3 3.5
5 10 15 20 25
A
ve
rag
e
R
o
u
ting Lo
ad
Pause Time
Average Routing Load without Buffer
DSR
AODV
DSDV
0 20 40 60 80 100 120
5 10 15 20 25
P
D
R
%
Speed
Packet Delivery Ratio
AODV
DSR
DSDV
0 50 100 150
5 10 15 20 25
En
d
t
o
E
n
d
Delay
Speed
End to End Delay
AODV
DSR
Fig.6: Speed vs Average Routing Load
In Fig.6 if there is increase in the speed, from 5 to 15 DSR protocol performed low routing load as compared with other protocols. From 20 to 25 DSDV performed low routing load as compared with other protocols.
BN SCHEME: (QUEUING APPROACH)
In this scheme a buffer was created at each node and the pause time and speed are varied from 5 to 25 with an interval of 5.The scheme is extended by two cases namely pause time increasing scenario and speed increasing scenario.
PAUSE TIME INCREASING SCENARIO
In this scenario three performance parameters were considered as packet delivery ratio, end to end delay and Average routing load as in the above case. Pause time is varied from 5 to 25 with 5 interval time as 5, 10, 15, 20, 25 where as the nodes are fixed at 30 number of nodes and constant speed 10. The remaining parameters are fixed as usual for this case as per parameter table.
Fig.7: Pause Time vs Packet Delivery Ratio
In Fig.7 if there is increase in the pause time, in the comparisons at any given pause time DSR performed nearly 100% packet delivery ratio as compared with other protocols. DSR maintains the constant packet delivery ration during the buffer scheme and also packet delivery ratio is also high.
Fig.8: Pause Time vs End to End Delay
In Fig.8 if there is increase in the pause time, from 5 to 25 DSDV protocol performed low delay as compared with other protocols. Whereas DSR protocol very high at 20 compared with other protocols. DSDV is considered to be best for this comparison.
0 1 2 3 4 5 6 7
5 10 15 20 25
A
ve
rag
e
R
o
u
ting Lo
ad
Speed
Average Routing Load
AODV
DSR
DSDV 0
20 40 60 80 100 120
5 10 15 20 25
Pack
e
t
D
e
liv
e
ry
R
atio
Pause TIme
Packet Delivery Ratio
AODV
DSR
DSDV
0 50 100 150 200 250
5 10 15 20 25
En
d
t
o
E
n
d
Delay
Pause Time
End to End Delay
AODV
DSR
Fig.9: Pause Time vs Average Routing Load
In Fig.9 if there is increase in the pause time, all the protocols performed a different performance at their level but in the comparison at any given pause times, DSR protocol performed low routing load as compared with other protocols except at 20 pause time AODV performed low routing load.
SPEED INCREASING SCENARIO
In this scenario three performance parameters were considered as packet delivery ratio, end to end delay and Average routing load. Speed is varied from 5 to 25 with 5 intervals time as 5, 10, 15, 20, 25 where as the nodes are fixed at 30 number of nodes and constant pause time 10. The remaining parameters are fixed as usual for this case as per parameter table
Fig.10: Speed vs Packet Delivery Ratio
In Fig.10 if there is increase in the speed, DSR performed nearly 100% packet delivery ratio as compared with other protocols at any given speed time. In this comparison DSR is best and optimal.
Fig.11: Speed vs End to End Delay
In Fig.11 if there is increase in the speed, from 5 to 25 DSDV protocol performed low delay as compared with other protocols. Whereas DSR protocol very high at 20 and 25 compared with other protocols. In this comparison DSDV is optimal.
Fig.12: Speed vs Average Routing Load
In Fig.12 if there is increase in the speed, from 5 to 15 DSR protocol performed low routing load as compared with other protocols. From 20 to 25 DSDV performed low routing load as compared with other protocols.
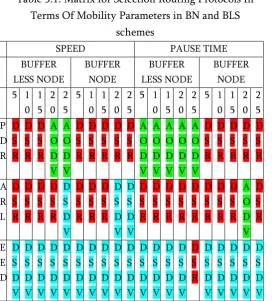
The suggested protocols with two schemes for three performance metrics are given in the following table as per the above results.
0 0.5 1 1.5 2 2.5 3 3.5
5 10 15 20 25
A
ve
rag
e
R
o
u
ting Lo
ad
Pause Time
Average Routing Load
AODV
DSR
DSDV
0 20 40 60 80 100 120
5 10 15 20 25
PD
R
%
Speed
Packet Delivery Ratio
AODV
DSR
DSDV
0 20 40 60 80 100
5 10 15 20 25
En
d
t
o
En
d
Del
ay
Speed
End to End Delay
AODV
DSR
DSDV
0 1 2 3 4 5 6
5 10 15 20 25
A
ve
rag
e
R
o
u
ting Lo
ad
Speed
Average Routing Load
AODV
DSR
Table 5.1: Matrix for Selection Routing Protocols In Terms Of Mobility Parameters in BN and BLS
schemes increasing scenario and pause time increasing scenario, the following observations are drawn from the above table as well as graphs.
Speed Increasing Scenario:
In Packet delivery ratio if increasing the speed from 5 to 15 in no buffer scheme DSR protocol performs well and then from 20 to 25 AODV performed well compared to other protocols where as in buffer scheme DSR protocol performed 100% packet delivery at any speed. In Average routing Load if increasing the speed
of the node from 5 to 20 DSR protocol performed well and at speed 25 DSDV performed low routing load where as in buffer scheme DSR performed low from speed 5 to 15 and from speed 20 to 25 DSDV protocol performed low routing load with increasing speed as compared to other two protocols.
In End to End Delay at any given speed DSDV performed meticulous performance throughout the no buffer and buffer schemes.
Pause Time Increasing Scenario:
In Packet delivery ratio if increasing the pause time in no buffer scheme AODV performed excellent performance throughout the scenario where as DSR protocol performed the same tremendous performance throughout the no buffer scheme at any give pause time.
In Average routing load if increasing the pause time of each node in no buffer scheme DSR protocol performed the best compared to other protocols where as in buffer scheme also DSR protocol performed well compared to other protocols except at pause time 25 AODV did well compared to the remaining.
In End to End Delay if increasing the pause time from 5 to 15 at each node in no buffer scheme (MANETs) are sky-scraping in research and topology of MANETs usually changes with time. The prime idea about alter in routing protocols or designing of new protocols has been done in recent years. Because of the dynamic nature of MANETs and involved complexity to arrive at performance metrics without assumptions, there is always a need to explore the performance of routing protocols through simulation. The simulation study is carried on two scenarios with two schemes of three performance metrics. The observations from simulation study are as follows o The increase in the pause time of nodes in no
o The scenario of increase in the speed of the nodes in no buffer node scheme will give 100% of Packet Delivery Ratio in DSR &AODV protocols. Where as in the case of DSDV protocol the PDR remains decreasing from 80% to 40% . The End to End Delay and Average Routing Load increases gradually for all the routing protocols if packet delivery ratio is only the factor to consider in the network then this is best technique to apply in the MANETs.
o The increase in the pause time of nodes in buffer node scheme leads to the DSR protocol 100% Packet Delivery Ratio, decrease in the End to End Delay and decrease in Average Routing Load as per the simulation results and from the obtained graphs. Increase in the pause time would obviously mean reduced congestion in the buffer to enhance the positive impact on all the dependant parameters.
o The scenario of increase in the speed of the nodes in buffer node scheme will give 100% of Packet Delivery Ratio in DSR protocol .Where as in the case of DSDV protocol the PDR remains decreasing from 80% to 45% and in AODV it remains constant at 80% . The End to End Delay and Average Routing Load increases linearly for all the routing protocols.
o These simulation results proves that the impact of mobility on routing protocols in MANET, the DSR is performed the best results in packet delivery ratio, end to end delay and also in average routing load in both schemes. The future extension may be performed using different mobility models and other performance metrics.
VII.
REFERENCES
[1]. Prof. Laxmi Shrivastava, Sarita S. Bhaduaria, Performance Evaluation of Routing Protocols in MANET with different traffic loads, International conference on Communication Systems and Network Technologies, 978-0-7695-4437-3/11© 2011 IEEE DOI 10.1109/CSNT.2011.10.
[2]. S Mohapatra, P.Kanungo, Performance Analysis of AODV, DSR, OLSR and DSDV Routing Protocols using NS2 Simulator, ICCTSD 2011, 1877-77058 © 2011 Published by Elsevier Ltd.
[3]. Kirti Jain, Rajiv Ranjan Tewari, Influence of Mobility Models in Performance Evaluation of MANET Routing Protocols, Special Issue of International Journal Computer Applications (0975-8887).
[4]. Ahyoung Lee & Iikyeun Ra, A Queuing Network Model Based on Ad Hoc Routing Networks for Multimedia Communications, Appl.Math.Inf.Sci.6No.1S pp.271S-283S.
[5]. Pan Li, Yuguang Fang, Jie Li , & Xiaoxia Huang, Smooth Trade-offs between Throughput and Delay in Mobile Ad Hoc Networks. IEEE Transactions on Mobile Computing, Vol. 11, No. 3, March 2012. [6]. Dr Saad Talib Hasson and Enass Fadil, Queuing
Approach to Model the MANETs Performance, British Journals ISSN 2047-3745.
[7]. Aznida Hayati Zakaria, Md.Yazid Mohd Saman, Ahmad Shukri M Noor, Ragb O.M. Saleh, Performance Analysis of Mobile Ad Hoc Networks using Queuing Theory, DOI:10.1007/978-981-4585-18-7_62, © Springer Science +Business Media Singapore 2014.
[8]. Mouna Abdelmoumen, Mounir Frikha, Tijani Chahed, Performance of Delay Tolerant Mobile Networks and its improvement using mobile relay nodes under buffer constraint, 978-1-4673-7468-2/15© 2015 IEEE.
[9]. Oo.omitola, Performance Evaluation of Routing Protocols in MANETs using Varying Number of Nodes and Different Metrics, African Journal of Computing & ICT, Vol 8. No.2 Kune, 2015-IEEE [10]. Rekha, Gurjeet Kaur, Mahipal Singh, Avtar Singh,
Comparative Analysis of Different Mobile Ad Hoc Network Protocols.,Research Article Volumen 6 Issue No.7, ISSN 2321 3361© 2016 IJESC.
[11]. Prachi Jain & Vijay Prakash, A Buffer Management Scheme to Control Packet Loss in MANET., 2016 Symposium on Colossal Data Analysis and Networking (CDAN),978-1-5090-0669-4/16/©2016IEEE.
Scientific Research and Review Volume 7, Issue 2, 2018 2279-543X.
[13]. Tonguz O and Ferrari G., “Ad hoc Wireless Networks – A communication-Theoretic Perspective, Wiley and Sons”, 2009.
[14]. FR.B. Cruz, T. Van Woensel, J.MacGregor Smith, “Buffer and throughput trade-offs in M/G/1/K queuing networks: A bi-criteria approach”, International Journal Production economics, 2010. PP 224-234.
[15]. CJinshong Hwang, Ashwani Kush, Ruchika, “Performance Evaluation of Manet Using Quality of Service Metrics”, Fifth International conference on Innovative Computing Technology (INTECH 2015) 978-1-4673-7551-1/15 © 2015 IEEE.
[16]. Martin Appiah, “PERFORMANCE COMPARISON OF MOBILITY MODELS IN MOBILE ADHOC NETWORKS (MANET)”, 978-1-5386-3831-6/17© 2017 IEEE.
[17]. Nsnam web pages: https://www.isi.edu/nsnam/ns/ [18]. Tutorial for Simulation-based Performance Analysis
of MANET Routing Protocols in ns-2 By Karthik sadasivam
[19]. Teerawat Issariyakul, Ekram Hossain “Introduction to network simulator NS2”, 10.1007/978-0-387-71760-9© Springer Science + Business Media, LLC. [20]. Hui Xu, Xianren Wu, “A Unified Analysis of
Routing Protocols in MANETs”, IEEE Transactions on Communications, Vol.58, N0.3, March 2010 [21]. Kapang Lego, Pranav Kumar Singh,“Comparative
Study of Adhoc Routing Protocol AODV, DSR and DSDV in Mobile Adhoc NETwork” Indian Journal of Computer Science and Engineering Vol.1 No.4 364-371.
[22]. Radhika Patel, Bimal Patel, Sandip Patel, Amit Parmar, “Comparative Performance Analysis of Reactive routing protocols, TORA and AODV: A simulation based evaluation”, Conference Paper 2017.
[23]. Bouchra M., Hicham T., EL Habib B., Md. Talea, Performance Analysis of Routing Protocols in Vehicular Ad Hoc Network, Springer Singapore, DOI:10.1007/978-981-10-1627-1_3.
[24]. Mandeep Singh, Balwinder Singh, Performance Evaluation of MANET Routing Protocols with Scalability for HTTP Traffic Delay Using OPNET Modeler, International Journal of software &
Hardware Research in Engineering,IJSHRE Vol 1, issue 1 September 2013.
[25]. Wu Wang, Bin Yang, Osamu T, X Jiange, Shikai Shen, On the Packet Delivery Delay Study for Three- Dimensional Mobile Ad Hoc Networks, Journal Ad Hoc Networks, Vol 69, Issue C, Feb 2018, 10.10.16/j.adhoc.2017.10.004.
[26]. Yefa Mai, Yuxia Bai, Nan Wang, Performance Comparison and Evaluation of the Routing Protocols for MANETs Using NS3, Journal of Electrical Engineering 5 (2017) 187-195, DOI:10.17265/2328-2223/2017.04.003.