ULTRAFAST PROCESSES IN SMALL MOLECULES
By
William Alexander Bryan
A thesis in partial fulfilment for the degree
o f Doctor of Philosophy
University College London
ProQ uest Number: U 642157
All rights reserved
INFORMATION TO ALL U SE R S
The quality of this reproduction is d ep en d en t upon the quality of the copy subm itted. In the unlikely even t that the author did not sen d a com plete manuscript
and there are m issing p a g e s, th e se will be noted. Also, if material had to be rem oved, a note will indicate the deletion.
uest.
ProQ uest U 642157
Published by ProQ uest LLC(2015). Copyright of the Dissertation is held by the Author. All rights reserved.
This work is protected against unauthorized copying under Title 17, United S ta tes C ode. Microform Edition © ProQ uest LLC.
ProQ uest LLC
789 East E isenhow er Parkway P.O. Box 1346
Abstract
The interaction of ultrafast (6 x 10 '‘* s) intense (~10'^ - lO'® Wcm‘^) laser pulses
with a number of small molecules is investigated. When focussed, the Tiisapphire
laser used in this work causes multiple ionization, resulting initially in dissociation,
followed by Coulomb explosion into two or more energetic ionized particles.
Ions generated by the Coulomb explosion are detected in a time-of-flight mass
spectrometer. Computer controlled data acquisition and laser parameter control is
effected through a graphical user interface. Covariance mapping is employed to
identify ionization channels, a polarization comparison technique is used to quantify
molecular reorientation, and an ion momentum imaging technique is developed,
coupled with Monte Carlo simulations to measure the molecular geometry.
In water, the intemuclear bonds double in length, in accordance with enhanced
ionization theory. The molecule is also observed to straighten considerably, and the
signature of laser-induced reorientation is observed. The geometry modification is
interpreted in terms of bend angle softening, and comparisons with theoretically
predicted reorientation rates are made.
In carbon dioxide, the ionization channels are identified, and a comparison is made
with the results of other experiments. Laser-induced reorientation is observed, and
quantified as a function of ionization channel. The bend angle distribution observed
is compared with the expected zero-point distribution of the neutral molecule.
Geometry modification in terms o f light-dressed molecular potentials and the
significance of stable molecular ions is discussed.
The Coulomb explosion of sulphur hexaflouride is investigated, and a comparison
made with enhanced ionization theory. The explosion of this molecule is consistent
with a single critical distance.
The dissociation and Coulomb explosion of the hydrogen molecular ion is
investigated for the first time. Comparisons are made with previous experimental and
theoretical results, and significant differences are observed, indicating the
Acknowledgements
I would like to thank all the people who have directly contributed to the research
presented in this thesis:
To Professor Roy Newell, my supervisor, for the opportunity to perform this
research in the first place. His guidance, good humour and insight have been of
fundamental importance throughout.
To Dr Joseph Sanderson for his friendship and interest in this project, and for his
advice during the preparation of this thesis. I wish him the best o f luck in Canada.
To past and present colleagues at University College: Dr Rachel Thomas, for her
help and advice from the beginning, Ali El-Zein for his input as a physicist and
seemingly endless supply of amusing anecdotes and Toby Goodworth for his
enthusiasm.
To our colleagues at The Queen's University of Belfast: Professor Ian Williams, Dr
Balasingam Srigengan, Dr Paul McKenna and Gail Johnston for their expert design,
construction and operation of the ion-beam experiment
To Dr Andrew Langley, Dr Phil Taday and Edwin Divall of the Rutherford Appleton
Laboratory for their operation of the ASTRA laser.
To Ivan Rangué and Ted Oldfield for their indispensable technical expertise and
good humour.
I would also like to thank the following for their much appreciated support.
To Alan and Sue for their financial support and expert chauffeuring.
To Julia for putting up with me cluttering up her living room, and to Carl for his own
particular brand of encouragement.
To Alex and Carrie for being fabulous fiiends and employers and to everyone else at
the Head, whose humour and interest were important - you know who you are.
To Sophie for her moral support, continuous encouragement and beverage action.
To Lindsey for her irrepressible humour and interest.
Contents
Abstract 2
Dedication 3
Acknowledgements 4
Contents 5
List of figures 10
Chapter 1: Review o f experimental and theoretical studies
1.1 Introduction 19
1.2 Experimental investigation into the ionization mode in laser fields 21
1.3 Dissociative processes 24
1.3.1 One-photon dissociation or bond softening 28
1.3.2 Two-and three-photon dissociation 29
1.3.3 Zero-photon dissociation 30
1.3.4 Three-photon trapping 30
1.3.5 Three-photon trapping continued - bond hardening 33
1.4 Coulomb explosion processes 35
1.4.1 Experimental results 36
1.4.2 Classical field ionization Coulomb explosion model 38
1.4.2.1 PICE model - classical realisation o f the critical distance 40
1.4.2.2 PICE model - appearance intensity as a function of
intemuclear separation 42
1.4.2.3 PICE model - classical trajectory calculations 43
1.4.3 Quantum mechanical treatments of enhanced ionization 46
1.4.3.1 One-dimensional DC treatment of intense field ionization o f H2^ 47
1.4.3.2 One-dimensional AC treatment of intense field ionization in a
diatomic molecule 48
1.4.3.3 Three-dimensional treatment of intense field ionization of 51
1.5 Laser-induced reorientation 56
1.5.1 Experimental results 57
1.5.2 Theoretical results 63
1.6 Coulomb explosion and geometry modification of polyatomic
1.6.1 Experimental techniques - covariance mapping 65
1.6.2 Experimental techniques - momentum imaging 76
1.6.3 Theoretical discussion 83
Chapter 2: Experimental
2.1 Introduction 84
2.2 Experimental apparatus 84
2.2.1 Ultra-high vacuum system 84
2.2.2 Time of flight mass spectrometer 86
2.2.3 Target gas supply 90
2.3 Femtosecond laser 91
2.3.1 The 50 femtosecond laser system 92
2.3.2 Beam transport and monitoring 93
2.3.3 Beam focussing in vacuum 95
2.3.4 Calculation of focussed laser intensity 97
2.3.5 Calibration of focussed laser intensity 97
2.4 Data collection techniques 99
2.4.1 Behaviour of ions in the spectrometer 99
2.4.2 One-dimensional time-of-flight mass spectroscopy 101
2.4.3 Covariance mapping 102
2.4.4 lon-Momentum Imaging 106
2.4.4.1 IMI data collection 106
2.4.4.2 IMI data correction procedure 108
Chapter 3: Data acquisition and analysis
3.1 Introduction 113
3.2 Lab VIEW summary 113
3.3 Data acquisition 115
3.3.1 Tektronix TDS 744a digital storage oscilloscope 115
3.3.2 DSO-to-PC interface via GPIB 118
3.3.3 Setting DSC GPIB parameters 118
3.3.4 Basic DSC - PC interface protocol 118
3.3.5 Networked data storage 119
3.5 Laser pulse energy gating procedure 120
3.6 Data collection and processing: covariance mapping 121
3.6.1 Data collection 121
3.6.2 Data processing 122
3.6.3 Calculation and display of the covariance coefficient 122
3.6.4 Storage 123
3.7 Data collection and processing: ion momentum imaging 123
3.7.1 Data collection 123
3.7.2 Generating a TOF matrix 123
3.7.3 Conversion from TOF matrix to ion momentum image 124
3.7.4 Application o f the finite angle correction 126
3.7.5 Generating corrected IMI maps 130
3.7.6 Data preparation for least-squares fitting 130
3.8 Monte Carlo simulation 130
3.8.1 Definition of the probability density function (p.d.f) 130
3.8.2 Definition of the cumulative distribution function (c.d.f) 131
3.8.3 Sampling a p.d.f. using the Inverse Transform method 131
3.8.4 Application of Monte Carlo methods to laser-induced
Coulomb explosion 134
3.8.5 Selecting a p.d.f for Coulomb explosion simulation 136
3.8.6 Generating Coulomb explosion c.d.f.'s 137
3.8.7 Example Monte Carlo Coulomb explosion simulations 140
Chapter 4: Geometry modification and reorientation o f H2O investigated using lor
Momentum Imaging
4.1 Introduction 141
4.2 Preparation of H2O target 141
4.3 TOF matrix of H2O 143
4.4 Uncorrected H2O IMI maps 144
4.5 Corrected H2O IMI maps 147
4.6 Monte Carlo simulation of the Coulomb explosion of H2O 147
4.7 Simulation results 156
4.8 Discussion of results 159
4.10 Discussion of results - laser-induced reorientation 160
4.11 Discussion of results - bend-angle softening 163
4.12 Summary 166
Chapter 5: Laser-induced Coulomb explosion, geometry modification ano
reorientation o f CO2
5.1 Introduction 167
5.2 Preparation of CO2 target 167
5.3 Covariance mapping 168
5.4 Laser-induced reorientation 173
5.5 TOF matrix of CO2 179
5.6 Uncorrected CO2 IMI maps 181
5.7 Corrected CO2 IMI maps 185
5.8 Monte Carlo simulation of the Coulomb explosion of CO2 190
5.9 Simulation results 194
5.10 Discussion of results 198
5.11 Discussion of results - partially sequential dissociation 198
5.12 Discussion of results - enhanced ionization 200
5.13 Discussion of results - laser-induced reorientation 204
5.14 Discussion o f results -bend-angle evolution 207
5.15 Competition between enhanced ionization and laser-induced
reorientation in the Coulomb explosion of CO2 213
5.16 Summary 214
Chapter 6: Conclusion and suggestions fo r future research 215
Appendices
A1 Detector schematic 218
A2 TOF equations of motion 219
A3 Tektronix TDS 744A specifications 221
A4 Lab VIEW software and documentation 225
A5 ASCn commands for Tektronix TDS 744A and Newport
MM 4005 264
A7 Publications - preface 269
A7.1 Multielectron-dissociative-ionization o f SFe by intense
femtosecond laser pulses 271
A7.2 High-intensity femtosecond laser interactions with vibrationally
excited CO2 280
A7.3 Alignment and bending of CO2 by intense femtosecond laser
pulses 286
A7.4 Geometry modification and alignment of H2O in an intense
femtosecond laser pulse 294
A7.5 Sub-pulselength resolution of bond softening and Coulomb
explosion using polarization control o f laser-induced alignment 298
A7.6 Short pulse laser interactions with positive ions 307
A7.7 Laser-induced Coulomb explosion, geometry modification
and reorientation of carbon dioxide 309
A7.8 Fast beam study of a H2^ ions in an intense femtosecond
laser field 331
A7.9 A detailed study of multiply charged ion production within a
high intensity laser focus 341
List of figures
Figure Page
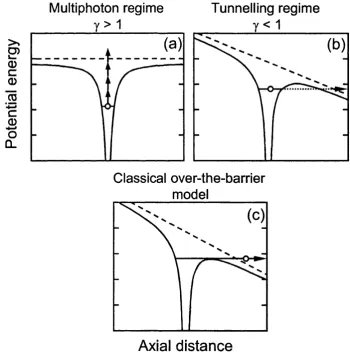
1.1 Schematic representation o f the behaviour o f the outer electron in the field o f an 20 atomic ion in (a) the multiphoton regime, (b) the tunnelling regime. The ionization process has been successfully modelled by a classical over-the-barrier model (c).
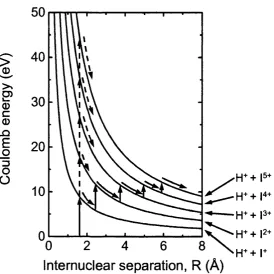
1.2 Potential energy curves for hydrogen iodide as a function o f intemuclear 22 separation. The dashed arrows represent non-sequential (direct) ionization, whereas the solid arrows demonstrate sequential ionization as the molecule dissociates
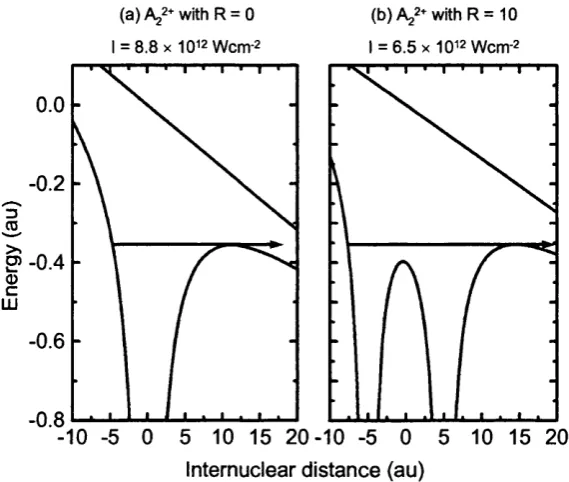
1.3 Field ionization model as applied to the noble gases (From Augst et a l 1989) 23 1.4 Comparison o f an atom (R = 0 au) and a molecule (R = 10 au) in a laser field. In 24
the atomic case (a), an intensity o f 8.8 x lO'^ Wcm'^ is required to ionize the electron (horizontal line), whereas in the molecular case, a field o f 6.5 x 10^^ Wcm'^ is required.
1.5 Ground state and first excited state potential o f dressed by a photon field o f 25 780 nm, where © = 1.6 eV. (From Giusti-Suzor et a l 1995)
1.6 Diabatic dressed potentials for H2^ dressed by a photon field o f 26
780 nm, observing the selection rules.
1.7 Adiabatic dressed potentials for in a 780 nm laser field at three laser 27 intensities, illustrating the avoided crossings. (From Giusti-Suzor et al 1995)
1.8 Relative populations o f the vibrational levels o f 27 1.9 Illustration o f the three ATD paths open to the ion exposed to 532 nm 28
radiation. (Adapted from Zavriyev et al 1990)
1.10 Kinetic energy spectrum fi*om 55 fs 750 nm laser pulses at five laser intensities. 29 (From Thompson et a l 1997)
1.11 Proton kinetic energy spectra recorded at (a) 10'^ and (b) 2 x 10^^ Wem'^ with 31 160 fs 769 nm laser pulses. (From Zavriyev et al 1993)
1.12 A possible trapping scenario for Hz^. The solid lines show the adiabatic dressed 32 potentials, and the thin lines show the field-free potentials dressed by the photon energy (~ 1.6 eV). (From Zavriyev et al 1993)
1.13 Ionization o f the population trapped above the three-photon gap, as suggested 33 by Zavriyev et a l 1993.
1.14 Bond-hardening manifests itself as a shift in energy o f the one-photon peak as 34 the pulse duration is shortened from 540 fs to 45 fs. (Adapted from Frasinski et al 1999)
1.16 Model l2^ molecular ion in a laser field. The solid curve represents the potential 39
energy o f the outermost electron in the combined field o f the two Ÿ ions and the field. (From Posthumus et al 1995)
1.17 Experimental and theoretical kinetic energy releases for N2, O2, CO, CI2 , 1 2 and 40
CO2. Refer to table 1.2 to identify publications (a) to (j). (From Posthumus et al
1995)
1.18 Potential w ells for %2^ at three different intemuclear separations in an intense 41
electric field, illustrating the calculation o f the classical appearance intensity o f the (1,1) channel. In frames (a), (c) and (e), the equivalent laser intensity is 7.9 X 10^^ Wcm'^. In frames (b), (d) and (f), the intensities are 5.3 x 10'^ Wcm'^, 1.2 X 10^^ Wcm'^ and 3 x 10'^ Wcm^ respectively. (From Posthumus et al
1996a)
1.19 Appearance intensity curve (solid line) as a function o f intemuclear separation 43 for l2^ —> (1,1). Three vertical dashed lines indicate the physical processes
behind the stmcture o f the classical appearance curve. (Adapted from Posthumus et al 1996a)
1.20 Classical appearance intensities o f the fragmentation channels o f I2 (full curves) 44
and classical trajectories (broken curves). The laser parameters corresponding to each o f the trajectory calculations are as follows: (a) 150 fs, 8 x lO'^ Wcm'^ resulting in (2,2) channel, KER = 15.9 eV, (b) 400 fs, 5 x 10^^ Wcm'^ resulting in (2,2) channel, KER = 14.1 eV, (c) 150 fs, 2.5 x 10^'* Wcm'^ resulting in (4,4) channel, KER = 58.8 eV and (d) 400 fs, 1 x 10*^ Wcm^ resulting in (4,4) channel, KER = 35.9 eV. (From Posthumus et al 1996a)
1.21 The treatment o f the (0,1) dissociation channel as used by Posthumus et al 45 (1996a).
1.22 Static field ionization rate as a function o f intemuclear separation for H2^, where 47
ionization occurs from the upper level (From Plummer and McCann 1996)
1.23 One-dimensional model o f the generic diatomic A2 in an intense laser field, (a) 49
Ionization rates as a function o f intemuclear separation for two channels calculated using a smooth tum-on pulse with a wavelength o f 1064 nm. (b) Ionization probabilities for a number o f different channels calculated for a 30 fs laser pulse with a wavelength o f 900 nm. (From Seideman et al 1995)
1.24 Smoothed electron potentials at several intemuclear separations, illustrating 50 tunnelling ionization through the central barrier for intermediate separations. The electric field strength is lO^'* Wcm'^ in all cases. (Adapted from Ivanov et al
1996)
1.25 Ionization rate o f the H2^ molecular ion in a 10^'* Wcm'^ 1064 nm laser pulse. 52
The H2^ ion is modelled in three-dimensions in the Bom-Oppenheimer regime.
From Zuo and Bandrauk 1995)
1.26 Three-dimensional Bom-Oppenheimer calculations o f the LUMO (dotted line) 53 and HOMO (dashed line) for H2^ as a function o f intemuclear separation in a
static field o f lO^'* Wcm^ in a 1064 nm electric field. (From Bandrauk 1999)
1.28 Ionization probability o f as a function o f intemuclear separation. The open 55 circles are when the simulated molecular ion starts in the ground state, and the closed circles are when the ion is in the first excited state (From Kawata et al
1999)
1.29 Ion time-of-flight spectra for pump-probe ionization o f carbon monoxide with 58 (a) perpendicular pulse only, (b) parallel pulse only and (c) the perpendicular pulse followed by the parallel pulse with a 800 ps delay. A schematic o f the pulse delays is shown to the right o f the figure, where the detector axis lies up the page. (Adapted from Normand et al 1992)
1.30 Angular distributions from the dissociative ionization o f I^ in an 80 fs laser 59 pulse. The squares are the ion yield o f the (1,2) channel and the solid line is a cos'^G fît. The dashed line is a simulation o f the ion yield if the laser field causes the ions to follow curved trajectories after dissociation. (From Dietrich et al,
1993)
1.31 The minimum threshold intensities at the critical distance Rc which define the 60 fragmentation shells in the focal volume. The arrows show the shells in which molecules that make a certain angle with the laser polarization that end up in the (1,2) channel. (From Posthumus e ta l 1998)
1.32 The angular widths o f the explosion channels o f different molecule species as a 61 function o f laser intensities. The lack o f laser-induced reorientation in iodine is shown by the agreement between the experimental results and the classical model. Nitrogen and hydrogen however, are reorientated by the laser. The narrowing o f the angular distributions with increasing laser intensity is a signature o f laser-induced reorientation. (From Posthumus et al 1998)
1.33 Coulomb explosion products from (a) oxygen, (b) chlorine and (c) iodine with 62 linear and circular polarizations. The average electric field strength in the direction o f the detector has been made the same in all three cases. The increase in ion signal with parallel polarization indicated laser-induced reorientation in the case o f oxygen and chlorine. However, in the case o f iodine, the ion signals are equal, implying there is no reorientation. (From Ellert et al 1998)
1.34 (a) Two-dimensional covariance map o f CO2 recorded at 794 nm at an intensity 67
o f 10^^ W/cm^. (b) Simulation o f the two-body and charge symmetric three-body channels. (From Frasinski et al 1994)
1.35 Schematic o f the structure o f allene and propane. 70 1.36 Two-dimensional correlation maps for the C3H4 molecule, (a) Experimental 71
results recorded at 790 nm with 130 fs laser pulses focused to 5 x 10’^ Wcm'^. (b) Simulated results, generated using a Monte Carlo technique. (From Comaggia et al 1995b)
1.37 Monte Carlo Simulation co-ordinates. 72 1.38 Two-dimensional correlation maps for carbon dioxide (a) experimental results 73
recorded at 790 nm with 130 fs focused to lO'^ Wcm' (b) Simulated results, generated using the Monte Carlo technique. (From Comaggia 1996)
1.39 Two-dimensional correlation map for (a) the C/O^ correlation from CO2 and 75
1.40 Two-dimensional correlation map for the correlation o f SO;. (From 76 Comaggia e ta l 1996)
1.41 MRMI maps o f SO; at 5.4 x lo'^ Wcm l (a) / S^+ ions, (b) S0^+ ions and (c) 77 ions. In all cases, 100 fs 795 nm laser pulses have been used. (Adapted from Hishikawa et al 1998)
1.42 Comparison o f the Coulomb explosion o f a linear and bent triatomic AB;. In the 78 case o f the linear molecule, the A^^ ions are emitted directly along the laser polarisation (e), and the ions have zero momentum, resulting in the MRMI map o f the ion being maximum at zero. In the case o f the bent geometry, the A^^ ions are emitted around the laser polarization, and the B^^ ions are emitted perpendicular to the polarization with non-zero momentum, as shown bottom right.
1.43 MRMI maps o f the (p = 1 - 3) and C**^ (q = 1 - 3 ) produced from the 80 Coulomb explosion o f CO;. The three points on the C**^ (q = 1 - 3) indicate the momentum generated by bends o f 180°, 165° and 150°. (Adapted from Hishikawa et al 1999a)
1.44 Simulated MRMI maps o f the (p = 1 - 3) and C**^ (q = 1 -3 ) produced from 81 the Coulomb explosion o f CO;. Compare with figure 1.43. (Adapted from Hishikawa et al 1999a)
2.1 Schematic o f the ultra-high vacuum system. 85 2.2 Schematic o f the time-of-flight mass spectrometer (not to scale). 87 2.3 Photograph o f the time-of-flight mass spectrometer, inverted on the mounting 88
flange.
2.4 Schematic o f the target gas supply system. 90 2.5 /4" Swagelok to 70 mm confiât conversion piece. 91 2.6 Schematic o f the femtosecond laser system at the Rutherford Appleton 92
Laboratory. The elements o f the laser are labelled thus: Faraday Isolator (FI), concave mirror (CM), spherical mirror (M), Pockel's Cell (PC) and gratings (G1 -G 4).
2.7 Top-down schematic o f the beam transport optics. The elements present are: 93 periscope (P), gold mirrors (M l - M5), apertures (A), glass plate (GP), Integrating sphere (IS), photodiode (PD)„ half-wave plate QJ2) and entrance window (W).
2.8 The periscope used to drop the beam from the exit o f the compressor to the 94 height o f the TOFMS.
2.9 Mount for the 1 cm diameter parabolic mirror. 95 2.10 Mount for the 2.54 cm diameter spherical mirror. S/S indicates stainless steel. 96 2.11 Time-of-flight spectrum o f argon, recorded with the spherical mirror, indicating 98
ionization up to Ar^^, corresponding to an intensity > 3 x 10^^ Wcm'^.
2.13 Time-of-flight spectrum o f carbon dioxide recorded at an intensity o f 3 x 10^^ 99 Wcm'^, with an extraction field o f 300 V.
2.14 Calibration o f the TOFMS, illustrated by plotting the time-of-flight for the ions 100 observed in figure 2.13 against the square root o f the mass-to-charge ratio.
2.15 Illustration o f the behaviour o f energetic ions within the spectrometer. 101 2.16 Illustration o f the calculation o f <xy> for N spectra. For each individual pair o f 103
spectra, the cross product is formed. This is then averaged over all N spectra.
2.17 Illustration o f the calculation o f <x><y> for N spectra. First, the average spectra 104 are calculated by averaging the signal at each time x(t) and y(t), then the cross product o f these average spectra is formed.
2.18 Covariance map o f carbonyl sulphide recorded with 790 nm 55 fs pulses 105 focused to generate an intensity o f 3 x 10^^ Wcm'^.
2.19 TOF matrix o f nitrous oxide recorded with 790 nm 55 fs laser pulses focused to 107 generate an intensity o f 3 x 10*^ Wcm'^. The position o f the N ^ ion is indicated for later discussion.
2.20 Illustration o f the conversion from TOF matrix to IMI map. 108 2.21 Uncorrected IMI plot for the ion from the Coulomb explosion o f N2O, 109
generated from the TOF matrix presented in figure 2.19.
2.22 The trajectories for two ions making the same initial angle to the detector axis, 109 but with different momentum magnitudes. The ion following trajectory T] passes through the aperture hence is detected, whereas the ion following trajectory T; is not.
2.23 The collection geometry for the finite angle correction, which allows the effect 110 o f the variation o f detector acceptance with ion momentum and species to be removed from the IMI plots.
2.24 Dependence o f the finite angle correction with ion momentum for the ion. I l l Also presented is the variation o f a simple correction derived by considering only the maximum acceptance angle.
2.25 Corrected IMI plot for the ion generated by the Coulomb explosion o f N2O. I l l
By comparing this figure and the IMI plot in figure 2.20, the effect o f the finite angle correction is seen.
3.1 Illustration o f a Lab VIEW VI, used to generate a Gaussian function o f arbitrary 114 resolution, (a) The front panel and (b) the block diagram.
3.8 Definitions o f parameters used in generating IMI plot. 125 3.9 Example o f an IMI plot, illustrating underlying structure, 125 3.10 Trajectories o f an ion with p = 3 x 10^ amu ms'^ for different angles a 128
between the momentum vector and the TOFMS axis. The dashed line represents the top grid, and the dotted line the acceleration grid.
3 .11 Variation o f the angular acceptance o f the TOFMS for an O^^ ion. 128 3.12 Variation o f the Correction factor C derived from the finite angle correction for 129
an O^^ ion.
3.13 (a) Gaussian probability density function (p.d.f.) and (b) resulting cumulative 132 distribution fimction (c.d.f)
3.14 The Inverse Transform method applied to the Gaussian c.d.f. (a) Sampling the 133 c.d.f. using the Uniform distribution, (b) The resulting distribution o f samples.
3.15 Monte Carlo simulation molecular geometry. 133 3.16 Conversion from the molecular geometry parameters r and 0 to Cartesian co- 134
ordinates.
3.17 Examples o f the three triangular p.d.f.'s. (a) the bond-length distribution, (b) the 138 bend-angle distribution and (c) the alignment distribution. Labels 1-8 are defined in table 3.1.
3.18 (a) An example triangular p.d.f. and (b) corresponding c.d.f. 139 3.19 (a) Sampling the triangular c.d.f. using the Uniform distribution, (b) Resulting 139
distribution o f samples.
3.20 Monte Carlo simulation o f the Coulomb explosion o f triply-ionized ozone, (a) 140 ions ejected along the polarization direction, (b) ions ejected perpendicular to the polarization direction.
4.1 Time-of-flight spectrum o f H2O recorded with 50 fs laser pulses at an intensity 142
o f 3 X 1 0'^ Wcm^. The laser polarization direction is parallel to the TOFMS
axis.
4.2 ions from the laser-H20 interaction, with the laser parameters as in figure 142 4.1.
4.3 TOF matrix o f H2O. The angle 3 is the angle between the TOFMS axis and the 143
laser polarization direction.
4.4 Momentum maps for the atomic fragment ions resulting from the Coulomb 145 explosion o f H2O. The arrow shows the direction o f the laser polarization
direction.
4.5 Expanded area o f the IT^ IMl, showing the (1,0) channel in the centre. 146 4.6 Momentum maps for the atomic fragment ions resulting from the Coulomb 148
explosion o f H2O. The ion signal has been corrected for detector acceptance
4.7 Test o f initial simulation conditions identified from the corrected IMI maps 150 shown in figure 4.6,
4.8 First simulation attempt from conditions identified from the corrected IMI 151 maps.
4.9 Simulation parameters used in the first attempt at recreating the Coulomb 152 explosion o f H2O. These distributions were used to generate the IMI plots
shown in figure 4.8.
4.10 Illustration o f the change in shape o f the and IMIs with an increase in the 153 width o f the (j) distribution.
4.11 Illustration o f the change in shape o f the and IMIs with (top) an overall 154 shift o f the distribution, (middle) an increase in the width for high r and (bottom) a increase in the width for low r.
4.12 Illustration o f the change in shape o f the and IMIs with (top) an overall 155 shift o f the distribution, (middle) an increase in the width for high 0 and (bottom) a increase in the width for low 0.
4.13 Saturation o f the bend angle distribution. 155 4.14 Best-fit simulation parameters found after a number o f iterations o f the 157
simulation process.
4.15 Comparison between the best fit simulated and corrected experimental maps 158 resulting from the Coulomb explosion o f H2O. (a) The simulated results are
shown on the right-hand side o f the figure, the experimental on the left, (b) and (c) The simulated results are presented on the bottom half o f the plot, the experimental on the top.
4.16 Computed dependence o f the induced dipole moments o f the H2O molecule 162
when the H-H axis o f the molecule is parallel to the laser polarization direction. The parallel (nn) moment can be seen to dominate the perpendicular (p i) moment at intensities I > 3 x 10*'* Wcm'^. (Adapted from Bhardwaj et al 1997)
4.17 Comparison between the (a) best-fit bend angle distribution (section 4.8) for the 163 (1,1,1) and (1,2,1) Coulomb explosion channels and (b) the results o f the MCSCF calculation o f the geometry of the exploding H20^^ and H20'*^ ions o f Werner et al (1995) following ionization by HCI impact.
4.18 Excitation scheme for bend angle softening in the H20^ ion in a 790 nm laser 164 field.
4.19 Bend angle softening illustrated by dressing the excited state by the photon 165 energy.
5.1 Time-of-flight spectrum o f laser-C02 interaction generated by 55 fs laser pulses 168 focussed to generate an intensity o f 3 x 10*^ Wcm'^. The laser wavelength was 790 nm, and the extraction field was 300 V/cm.
5.3 Covariance map o f carbon dioxide recorded under the same laser conditions as 170 figure 5,2, but with an extraction field o f 800 V/cm. The z-scale is adjusted to show the strongest correlation islands.
5.4 Covariance map o f carbon dioxide recorded under the same experimental 171 conditions as figure 5.3. The z-scale is adjusted to show the weaker correlation islands. The channel identification technique is illustrated by the vertical solid white line, passing through correlations (a) to (d).
5.5 Time-of-flight spectra o f laser-COi interaction with (solid line) linearly 174 polarized 450 pJ pulses and (dashed line) circularly polarized 900 pJ pulses. In both cases, the pulse duration is 55 fs and the extraction field was 300 V/cm. The increase in ion signal with linear polarized pulses indicated reorientation is occurring.
5.6 Ratio o f relative ion signal for measured with linear and circular polarization as 175 shown in figure 5.5.
5.7 Variation o f detector acceptance angle with ion species and momentum for 177 COz^ and (q = 1,2,3). The insert shows the measured peak momenta for the oxygen ions.
5.8 (a) TOF matrix o f carbon dioxide recorded by rotating the laser polarization 180 through 360° in 2° steps. The angle P is the angle between the laser polarization and the axis o f the TOFMS. (b) TOF spectrum at 3 = 0°, to allow ion identification.
5.9 (a) TOF matrix o f the atomic ions from the laser-COg interaction, (b) TOF 181 spectrum at P = 0° and 90°, to allow ion identification.
5.10 Uncorrected O'^^ (q = 1,2,3) IMl maps for the atomic fragment ions resulting 182 from the Coulomb explosion o f CO2. The arrow shows the laser polarization
direction.
5.11 Uncorrected (p = 1,2,3) IMl maps for the atomic fragment ions resulting 183 from the Coulomb explosion o f CO2. The arrow shows the laser polarization
direction.
5.12 Corrected (q = 1,2,3) IMl maps for the atomic fragment ions resulting from 186 the Coulomb explosion o f CO2. The arrow shows the laser polarization
direction.
5.13 Corrected C^^ (p = 1,2,3) IMl maps for the atomic fragment ions resulting from 187 the Coulomb explosion o f CO2. The arrow shows the laser polarization
direction.
5.14 C^^ IMl map before the removal o f the contribution o f the ion 188 5.15 The zero point distribution for the bending motion in carbon dioxide. The most 191
probable bend angle is 174°, and there are no perfectly straight molecules.
5.16 First attempt Monte Carlo simulation distributions. 192 5.17 Results o f Monte Carlo simulation o f the Coulomb explosion o f carbon dioxide 193
from the distributions presented in figure 5.16.
5.19 Best fît bend angle distributions. 195 5.20 Best fit alignment distributions. 195 5.21 Comparison between the corrected oxygen IMI maps (right-hand side) with the 196
best fit IMI maps (left hand side).
5.22 Comparison between the corrected carbon IMI maps (bottom half o f each pane) 197 with the best fit IMI maps (top half o f each pane).
5.23 Comparison between the present best-fit bond length distributions (dashed line) 201 and those o f Hishikawa e ta l 1999 (solid line).
5.24 Classical appearance intensities o f three o f the major Coulomb explosion 203 channels o f carbon dioxide, indicated by (1,1,1), (2,2,2) and (3,3,3). Also shown are six classical trajectories corresponding to the minimum and maximum intensities necessary to generate the channels.
5.25 Calculation o f reorientation o f carbon dioxide in a 55 fs pulse focussed to 206 generate an intensity o f 0.923 au (3 x 10'^ Wcm'^), initially at 60° to the electric field.
5.26 Simulation o f the laser-induced reorientation o f carbon dioxide. For each laser 207 intensity, the greyscale plot represents the intensity experienced along the 0 - 0 axis o f the molecule. To interpret this figure, start at the left-hand side o f the figure at some y value (angle with respect to the laser polarization direction). Moving horizontally across the plot then illustrates the dynamic behaviour.
5.27 Comparison between the bend angle distributions for carbon dioxide under a 208 range o f different field conditions, (a) Zero-point distribution, (b) HCI impact with a molecule-field interaction time o f 6 fs. (c) Present work with 55 fs laser pulses, (d) 100 fs laser pulses with linear approximation (dashed lines) and (e) 130 fs laser pulses.
5.28 Light-dressing o f the bending potential o f carbon dioxide, (a) Bending potential 210 energy curves for CO; taken from Rabalais et al 1971. (b) Illustration o f the interaction o f the ground state (1) with states 2 and 3 dressed by three photons. (c) Illustration o f the interaction o f the ground state with states 6 and 7 by six photons.
Chapter 1. Review of experimental and theoretical
studies
1.1 Introduction
Recent advances in laser technology have lead to the routine availability of intense
optical pulses on the same time scale as the vibrational motion o f small molecules
(Strickland and Mourou 1985, Squier et al 1991, Yamakawa et al 1991). These ultra-
short pulses can then be focussed to generate electric field strengths comparable to
the binding energy of the electron to the proton in the hydrogen atom. Such
conditions have lead to the discovery of new highly non-linear phenomena in atoms
and molecules.
Intense laser field interactions with atoms or molecules can be separated into two
regimes, namely the multiphoton regime or the field ionization (or tunnelling
ionization) regime. The distinction is made between the two regimes by way o f the
Keldysh parameter, y, (Keldysh 1965), which is defined as shown in equation 1.1:
Y = / T
2 U p , Equation 1.1
where I? is the ionisation potential (J), and Up is defined as in equation 1.2:
e^G ^
Up = ---- ^ Equation 1.2
4mm
The quantity Up is the pondermotive energy of an electron of charge e (C) and mass
m (kg) in an electric field of maximum amplitude Gq (V/m), with frequency m (s'^) and phase (j). The electric field s(t) of the laser pulse is defined as shown in equation
1.3:
G(t) = Gq (t) cos(mt + (|)) Equation 1.3
For y > 1, the ionization is in the multiphoton regime, where the atom or molecule
absorbs several photons before ejecting an electron. In this regime, the ionization
rate is proportional to U, where n is the multiphoton order, and I is the maximum
field intensity, as given by equation 1.4:
CG '
I = — — Equation 1.4
Stc
where c is the speed of light. In the multiphoton regime, the electron has a small
perturbation; this treatment is typical of high frequencies (e.g. UV, X-Ray).
However in the case where the pondermotive energy of the electron is greater then
the atomic ionization potentials, y < 1, which applies if the tunnelling frequency of
the electron is less than the angular frequency of the oscillating electric field. In this
regime, the ionization is through the tunnelling of the ionizing electron through the
field-induced static potential barrier. Here, the potential barrier is the sum of the
Coulomb field and the electric field due to the laser. Ionization in the tunnelling
regime corresponds to longer wavelengths and higher intensities. In the tunnelling
regime, the action of the laser electric field on the Coulomb potential is no longer a
perturbation, hence multiphoton theory cannot be applied. However, the effect of the
laser field on the Coulomb potential can be modelled in a straightforward manner,
and has been found to successfully describe the tunnelling mechanism in atoms and
molecules (see for example Augst et al 1989). Importantly, the term 'field ionization'
Multiphoton regime Tunnelling regime
y < 1
0)
c
0 CÔ
O
CL
Classical over-the-barrier model
Axial distance
is also used to describe the tunnelling regime, as the ionization process is dependent
on the shape o f potential created by the superposition of the laser field with the
Coulomb potential. A comparison of the two different regimes is shown in figure
1.1.
1.2 Experimental investigations into the ionization mode in laser fields
The experimental investigation into laser-induced multiple ionization was instigated
more than a decade and a half ago. The early experiments concentrated on the atomic
inert gases. L’Huillier et al (1983a,b) measured the ionization rate of Xenon
instigated by a 1064 nm wavelength laser, with a pulse length of 50 ps. In this study,
it was concluded that, at high intensities, multiple ionization was a sequential
process, and at low intensities, nonsequential.
The terms sequential and non-sequential describe the electron-removal mechanism,
and are common to high-intensity laser studies in atoms and molecules. The
definition of these processes is as follows.
• Sequential ionization.
Sequential ionization implies that, during the laser pulse, electrons are removed in a
step-wise manner, as indicated below for Xenon (equation 1.5a,b).
Xe + nhv Xe"^ + e" Equation 1.5a
Xe^ + nhv -> Xe^"^ + e“ Equation 1.5b
• Nonsequential ionization
In contrast to sequential ionization, non-sequential (or collective) ionization implies
that two electrons are removed simultaneously, as shown in equation 1.6.
Xe + nhv -> Xe^^ + 2e" Equation 1.6
Counter to the conclusions of L’Huillier (1983), Luk et al (1983,1985) reported non
sequential ionization of a range of atomic elements, including Xe, using a 193 nm
ArF excimer laser with a 10 ps pulse length.
The first experiment using a molecular target as opposed to an atomic target was
carried out in an effort to resolve the disagreements over sequential verses non
sequential ionization. Codling et al (1987) devised an experiment using hydrogen
iodide (HI), which is isoelectronic with Xe. The molecule was multiply ionized by a
600 nm, 600 fs laser, the highest stage of ionisation observed was Hl^^. It was
P 0) c 0
E o
D O
O H + + |5 +
H ++ |4+ H + + |2+
H++ r
2 4 6
Intemuclear separation, R
(A)
Figure 1.2. Potential energy curves for hydrogen iodide as a function o f intemuclear separation. The dashed arrows represent non-sequential (direct) ionization, whereas the solid arrows demonstrate sequential ionization as the molecule dissociates
six times, which would lead to a proton (H ^ and an ion separated by the ground-
state intemuclear separation (1.61
A).
The two ions would then repel each otherthrough the Coulomb interaction, and the proton would be emitted with a kinetic
energy of around 45 eV. Conversely, if the ionization were sequential, the molecular
ion would be ionized as it dissociated, hence the channel would be reached at
a much larger intemuclear separation, hence the proton would be observed with a far
lower energy. This process is illustrated in figure 1.2.
The protons were observed to have a maximum kinetic energy o f around 21 eV,
hence Codling et al (1987) concluded that the ionization mechanism was sequential
for hydrogen iodide, but at double the ground state separation, which implied
sequential ionization also occurs for Xe for the same laser conditions.
In an earlier publication, Lambropoulos (1985) pointed out that an atom or molecule
in an intense laser field will not be instantaneously exposed to the peak electric field,
rather the temporal profile of the laser pulse will influence the rate at which
ionization takes place. The results of Codling et al (1987) supported this conclusion.
thus allowing experiments to be performed in the tunnelling regime. In an important
experiment by Augst et al (1989), multiple ionization o f the noble gas atoms was studied in this regime. It was found that a classical field ionization model (see figure
1.1(c)) successfully predicted the appearance intensities of specific charge states.
Figure 1.3 shows the results of this model in the ionization of noble gases. The
ionization mechanism was approximated using the over-the-barrier method: as the
laser field increases in strength, the electron can escape over the potential barrier
directly into the continuum. In the case of Augst et al (1989) the effect of the electron tunnelling through the potential barrier was neglected. Even so, the
agreement between the experimental results and the predicted appearance intensities
is excellent.
10^7
10^3
♦ Helium • N eon A Argon □ Krypton ■ X enon
-1 I . I I I 1 1 1! I I I I I m l 1 I I 1 I m l U . J . L
1Q13 1Q15 1Q1® 10^^
Experimental a p p ea ra n ce intensity (W/cm^)
Figure 1.3. Field ionization model as applied to the noble gases (From Augst et al 1989)
The first suggestion of applying a similar model to the multiple ionization of
molecules was made by Frasinski et al (1987) in the case of N2 and Codling et al
(1987) in the case of HI. This model is referred to as the field ionization model. As
in the atomic case, the outermost electron is situated in the sum of the Coulomb
potential and the laser field. However, in transferring from the atomic case to the
molecular case, a number of important differences exist. These were first reported in
(a) Ag2+ with R = 0
I = 8 . 8 X 1 0 ^ 2 Wcm-2
(b) Ag2+ with R = 10
I = 6.5 X 1Q12 Wcm-2
0.0
-0.2
2 - 0 . 4
-0.6
-0.8
15 20-10 -5 0 5 10 15 20
Intemuclear distance (au)
Figure 1.4. Comparison o f an atom (R = 0 au) and a molecule (R = 10 au) in a laser field. In the atomic case (a), an intensity o f 8.8 x 10’^ Wcm^ is required to ionize the electron (horizontal line), whereas in the molecular case, a field o f 6.5 x lO'^ Wcm'^ is required.
the same ionization potential, a molecule will be more easily ionized than an atom.
This is illustrated in figure 1.4.
Secondly, it was observed that the laser polarization direction has a profound effect
on the ionization process. Assuming linear polarization, the maximum electric field
gradient occurs along the polarization direction. Initially, it was assumed that the
molecules would have no time to rotate during the laser pulse (Frasinski et al 1987),
and as a consequence, molecules that are initially aligned with the polarization
direction should be preferentially ionized. Following their experimental
investigations into N2, Frasinski et al (1987) concluded this was case.
1. S Dissociative processes
Studies into the dissociative ionization of small molecules have focussed on the
simplest molecular ion H2% hence this discussion will follow the literature. It has
been assumed by a number o f groups (Giusti-Suzor et al 1995 and references therein,
Gibson et al 1997, Walsh et al 1998) that the first ionization step of the hydrogen
molecule prepares the H2^ ion in accordance with the Franck-Condon principle,
where the neutral molecule distribution of vibrational, rotational and translational
ionization step is very rapid as compared to dynamic effects in the molecule
(reorientation, dissociation, and Coulomb explosion). In the following discussion,
these assumptions are treated as reasonable.
It has been found that considering only the two lowest states o f the H2^ ion (Isag and
2pau) gives a realistic framework within which to understand the dynamics o f the
system. See Giusti-Suzor et al 1995 for a summary o f this principle.
Following the creation of the molecular ion, multiple photon absorption and
emission can lead to a variety of complex phenomena. The most straightforward and
physically transparent method to understand these processes is in terms of 'dressed*
molecular potentials, as illustrated in figure 1.5.
>»
P o c
LU 4
3
2
1
2 p a ,
0
1SCT<
1
0
--2 CO
-3
2(0 -4
■5
■6
-7
8 10
0 2 4 6
Internuclear separation, R (au)
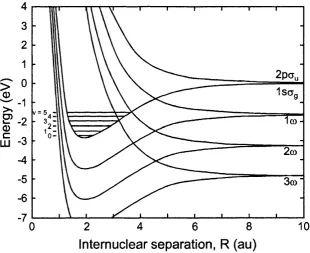
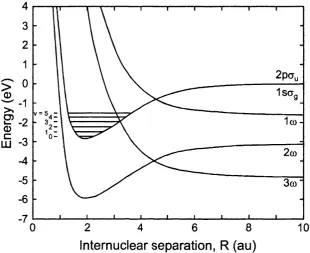
Figure 1.5. Ground state and first excited state potential o f dressed by a photon field o f 780 nm, where © = 1.6 eV. (From Giusti-Suzor et al 1995)
The 'dressed' molecular potentials are created by shifting the Isag and 2pOu levels
down by the photon energy, co. This process is illustrated in figure 1.5 for the H2^ ion
in 780 nm laser radiation. Assuming that the electronic wavefunction starts in one of
the low lying vibrational states o f the ion, figure 1.5 may be considerably simplified
by observing parity rules, in that the electron wavefunction will only
interact with those states of the same parity as the ground state (i.e. even). The
2pQu State dressed by one photon (2pc7u + Ico), the Isog state dressed by two photons
(IsQg + 2co) and the 2pOu state dressed by three photons (2pau + 3o). These
potentials are show in figure 1.6, again for 780 nm radiation. Importantly, these
curves only apply below ~10' * Wcm'^, as they are the diabatic dressed potentials.
2 p a ,
1sa,
>% V = 5
0
-1(0
-O c
LU
2(0
5
-Internuclear separation, R (au)
Figure 1.6. Diabatic dressed potentials for dressed by a photon field o f 780 nm, observing the selection rules.
Above 10^^ Wcm'^, the points at which the potentials cross (curve crossings) become
repulsive, creating adiabatic dressed potentials, with associated 'avoided’ crossings.
These crossings are referred to by the number of photons required to dress the
potential. For example, the avoided crossing between the IsOg state and the 2pau
state dressed by three photons (2pOu + 3m) is referred to as the three photon crossing
or gap. In figure 1.7, the calculations of Giusti-Suzor et al (1995) are reproduced,
showing the adiabatic dressed potentials for in a 780 nm 150 fs laser pulse for
three different laser intensities.
The results reproduced in figure 1.7 are calculated using Floquet theory. The
progressive pushing apart o f the avoided crossings is analogous to the AC Stark
shift.
The shapes of the adiabatic potentials are intensity dependent, and by careful
5 X 1Q12 Wcm'2 5 X 1Q13 Wcm'2
10^^ Wcm 2
2 p c ,
1sa,
V = 5 ':E'
0
-m -3
Internuclear separation, R (au)
Figure 1.7. Adiabatic dressed potentials for H2^ in a 780 nm laser field at three
laser intensities, illustrating the avoided crossings. (From Giusti-Suzor et al
1995')
vibrational levels, new complex processes are found. In an analogy to above
threshold ionization (Gavrila 1992), the dissociative ionization o f molecules by the
passage of the vibrational population over (and in some cases through) the avoided
crossings in the field-dressed potentials is referred to as above-threshold
dissociation. The populations of the vibrational levels in the H2^ molecular ion are
shown in figure 1.8. The dissociative processes found in H2 are summarised in the
following sections.
0.20
i s 0.10
0 1 2 3 4 5 6 7 8 9 10 11 1 2 1 3 14 Vibrational state
LS. 1 Dissociative processes: one-photon dissociation or bond softening
Laser-induced bond-softening was initially proposed by Bandrauk and Sink (1981).
The term "bond-softening” originates from the idea of the laser field progressively
weakening the internuclear bond. As the laser field increases in strength, the one-
photon adiabatic avoided crossing is suppressed, allowing lower and lower
vibrational levels to dissociate with low kinetic energy.
The first observation of bond-softening was by Zavriyev et al (1990). Using the
method discussed in section 1.3, figure 1.9 shows the potentials for the Y i f
molecular ion dressed in a 532 nm laser field. In the left-hand pane of figure 1.9, the
arrow leading from the higher vibrational levels to the one-photon dissociative
limit shows the bond-softening process. As the laser intensity increases, the one-
photon gap opens, allowing the vibrational levels lying above the gap to dissociate.
The right-hand pane of figure 1.9 shows the experimental results of Zavriyev et al
(1990). As can be seen, the bond-softening mechanism leads to a peak in the kinetic
energy spectrum of ions around 0.5 eV. The energy o f the protons released in this
process are measured with respect to the top of the adiabatic barrier, hence the
kinetic energy is intensity dependent. Importantly, the first two peaks in the proton
kinetic energy spectrum shown in figure 1.9 are separated by half the photon energy
(1.3 eV) However, it should be pointed out that the supposed three-photon peak in
the experimental results has not been reproduced since this publication.
' D i â b s t i c
3.5 X 1Q12 Wcm2 5.6 X 10^3 Wcnri2
Relative proton signal
10° 1Q1 102 10° 10^ 10° 10®
0 2 4 6 8
Internuclear separation, R (au) O 1.0
X 10^4 Wcm-2
□ 5.0 X 10’2 Wcm-2
1.3.2 Dissociative processes: two- and three-photon dissociation
While the higher vibrational levels of dissoeiate through the absorption of one
photon, the lower levels can only be accessed through the absorption of more than
one photon. This process is illustrated in figure 1.9 (left-hand pane) by the arrow
starting in the v = 1 vibrational level, and initially following the three-photon
adiabatic curve. Upon reaching the three-photon gap (around R = 4 au), the
wavepacket can either continue along the dressed potential diabatically, and
dissociate by sharing three times the photon energy, or can emit one photon and
transfer adiabatically to the two-photon curve. As a consequence of the dissociation
dynamics, the peaks in the kinetic energy spectrum of H ^ are referred to by the net
number of photons absorbed. The results of Zavriyev et al 1990 (figure 1.9) were recorded with 532 nm pulses. Figure 1.10 shows results more applicable to the
present work. Thompson et al (1997) used 750 nm 55 fs laser pulses to investigate the dissociation and Coulomb explosion of H]. The one-photon (coi) and two-photon
(2(1)]) peaks are shown, along with the Coulomb explosion peak (1,1). Their results
are qualitatively similar to those of Zavriyev et al 1990, however, Thompson et al
(1997) observed no three-photon peak. As mentioned earlier, the three photon peak
has not been observed in any other experimental studies. Given the maximum
intensity in the studies of Zavriyev et al 1990, it is possible that the "3o)" peak is actually a weak Coulomb explosion peak.
c =3
-2
(1.1)2.5
03
03
C
O)
(/)
c
o X 10 Wcm'
s .
2 6
0 1 3 4 5 7
E n ergy (eV )
1.33 Dissociative processes: zero-photon dissociation
Giusti-Suzor et al (1992) proposed a mechanism in which high vibrational levels
may become trapped in the adiabatic well above the one-photon crossing as seen in
figures 1.7 (780 nm) and 1.9 (532 nm). The small portion of the wavepacket that lies
above the diabatic crossing but to the right of the 2pCu + Ico curve will be trapped as
the laser field increases, and in certain cases, the adiabatic potential can increase to
such a degree that the trapped population will escape with near-zero energy.
Very recently. Posthumus et al (2000) observed zero energy protons, and proposed
that the molecule was behaving as predicted by Giusti-Suzor et al (1995). Posthumus
et al (2000) referred to this process as zero-photon dissociation (ZPD), as there is no
net photon absorption. The third harmonic (266 nm) o f a Ti:sapphire laser were used
to ionize H2. Posthumus et al (2000) observed that ZPD is difficult to measure
experimentally, as it requires very particular laser conditions, and efficient coupling
between the one-photon crossing and the vibrational levels of the molecular ion.
Examining figures 1.7 and 1.8, in the case of 780 nm radiation, the vibrational levels
high enough to be trapped by the upper well at the one-photon gap (v > 1 2) have a
very low population. By using the third-harmonic (266 nm), which is equivalent to a
photon energy of 4.65 eV, the well-populated lower vibrational levels (around v = 5)
may be accessed by the upper well of the one-photon gap, hence allowing population
transfer.
1.3.4 Dissociative processes: three-photon trapping
Zavriyev et al (1993) examined dissociative processes using 160 fs 769 nm laser pulses with intensities greater than 10^^ Wcm ^. The authors observed energetic
protons with energies between 1 and 5 eV, as shown in figure 1.11. The kinetic
energy spectra shown in figures 1.1 1(a) and (b) were recorded at intensities of 1 0*^
Wcm'^ and 2 x 1 0^^ Wcm'^ respectively, and show evidence for structure. Zavriyev
et al (1993) attributed the low energy peak around 0.5 eV to two-photon bond-
softening peak. Compare these results with those of Thompson et al (1997) as shown
in figure 1.10. Clearly, the intensities at which the experiments are performed are
different, however, two major differences are observed. Firstly, in the results of
Zavriyev et al (1993) (figure 1.11), no one-photon peak is present. Secondly,
V = 7
V = 6
V = 5
V = 4
v = 3
v = 2
V = 0
■e
CD CD
C D) (/) C
o
0 1 2 3 4 5
Proton energy (eV)
Figure 1.11. Proton kinetic energy spectra recorded at (a) 10’^ and (b) 2 x 10*^ Wcm^ with 160 fs 769 nm laser pulses. (From Zavriyev et a l 1993)
Zavriyev et al (1993). Importantly, the results shown in figure 1.10 were discussed in
terms of enhanced ionization, which is discussed in detail later. The work of
Zavriyev et al (1993) preceded the publication o f enhanced ionization (Posthumus et
al 1995, Zuo and Bandrauk 1995 and Seideman et al 1996), hence Zavriyev et al
(1993) proposed another mechanism, involving trapping at the three-photon
crossing.
H2^. Ionization o f the neutral molecule was estimated to occur at 1.4 x 10^^ Wcm
as shown in figure 1.12(a). The proton wavepacket then begins to move out along the
V = 5 vibrational level. After 15 fs, the wavepacket reaches the other side o f the
potential well. After this time, the laser intensity has risen to 2.9 x 10^^ Wcm^, as
shown in figure 1.12(b). At this point, the avoided crossing between the IsOg state
and the (2pCTu + Ico) state has not opened sufficiently to allow the wavefunction to
escape, hence the wavepacket turns round and begins another oscillation. However,
by the time the wavepacket reaches the turning point for the second time (after 40 fs,
see figure 1.12(c)), the intensity has risen to such a degree (9.0 x 10*^ Wcm'^) that
the three photon avoided crossing between the Isag state and the (2pau + 3co) state
come into play. At this point, the wavepacket crosses into the new adiabatic well and
is trapped.
The second step in the trapping mechanism proposed in Zavriyev et al (1993)
involves multiphoton ionization of the population trapped above the three-photon
gap. This process is illustrated in figure 1.13. Zavriyev et al (1993) calculated that
Ionization 1.4 X 1()i3 Wcm-2
1Ü
I*-* c
Î CL
L_
CO
0)
o 3
E
S c
2.9 X 10^3 Wcm-2
Trapping 9 . 0 X 1Q13 W c m - 2
40 fs 15 fs
2po\
- 3co
2 3 4 5
4 5
3 4
Internuclear separation, R (au)
Figure 1.12. A possible trapping scenario for H2^. The solid lines show the adiabatic dressed
(H + H ) .
15m
113m
O)
Isct,
2 4 6 8 10
Internuclear separation (au)
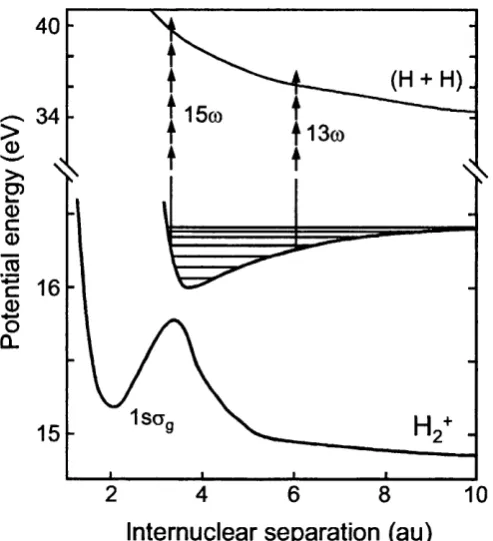
Figure 1.13. Ionization o f the population trapped above the three-photon gap, as suggested by Zavriyev et a l 1993.
this process would require between 13 and 15 photons, depending on the position of
the trapped vibrational wavefunction within the new potential. It is the state of the
vibrational wavepacket in the upper three-photon gap that Zavriyev et al (1993)
proposed caused the structure in the kinetic energy spectrum shown in figure 1.1 1.
This conclusion has since been criticised by Thompson et al (1997), as the saturation
intensity for the ion is 2 x 10^"^ Wcm^ (c.f. 1.4 x lO’^ Wcm'^ from Zavriyev et al
1993) is very similar to that at which (0,1) dissociation occurs, hence there will be
very little time for the molecule to become trapped.
1.3.5 Dissociative processes - three-photon trapping continued: bond hardening
Very recently, Frasinski et al (1999) returned to the idea o f population trapping above the three-photon crossing. The authors performed an elegant experiment using
792 nm laser pulses incident on Hz, and by varying the compressor grating
separation to change the chirp of the laser pulse hence varying the pulse duration,
were able to demonstrate the existence of three-photon trapping. The authors
returned to the terminology of earlier works (Giusti-Suzor et al 1995) and referred to