IJEDR1302007 INTERNATIONAL JOURNAL OF ENGINEERING DEVELOPMENT AND RESEARCH | IJEDR Website: www.ijedr.org | Email ID: [email protected] 30
Simulation and Performance Evaluation of UPFC and
IPFC for Power System Performance Enhancement
Rishabh shah
Dept. of Electrical Engineering Parul Institute of Engineering andTechnology Vadodara, India
Sarafraz Gandhi
Dept. of Electrical Engineering Parul Institute of Engineering andTechnology Vadodara, India [email protected]
Bhavin Trivedi
Dept. of Electrical EngineeringParul Institute of Technology Vadodara, India
Abstract— The FACTS (Flexible AC Transmission Systems) is a modern technology, which is based on power electronic device controllers introduce by Dr. N.G. Hingorani. Since 1970s it has been used in power systems for enhancing the existing transmission capabilities and improvement in system dynamic performance in order to make the transmission line system flexible and efficient in operation. This paper deals with the simulation of complex (series-shunt) FACTS controllers. For this a Single Machine Infinite Bus (SMIB) system is modeled in matlab simulation. In this paper, simple circuit models of Unified Power Flow Controller (UPFC) and Interline power flow controller (IPFC) has been presented for both open loop and close loop configuration. For open loop configuration SPWM control strategy and for close loop system PID controller is used. The simulation results has been compared for both UPFC and IPFC in open loop and close loop system which demonstrates the performance of the SMIB system after compensating the system using the above-mentioned FACTS devices. This gives the clear observation of how the FACTS devices improve the voltage stability and thereby power profile of the power system. The FFT (fast fourier transform) analysis for both devices in open loop and close loop has been done for analyzing the THD (total harmonic distortion) level of the system. All simulations and analysis have been carried out in MATLAB12a/SIMULINK environment.
Index Terms—FACTS, SMIB System, UPFC, IPFC, FFT Analysis, Reactive power compensation
I. INTRODUCTION
In Modern complex power system better power quality is necessary to fulfill the increased demand. Due to the advanced technologies being used for improving power system security, reliability and profitability the power quality is improved. For this it is essential to improve the power profile of the transmission network.
Since the reactive power is very precious in keeping the voltage of power system stable the reactive power flow control in the network is essential to achieve optimum
performance of power system. The main elements like transformers, alternators and transmission line are responsible for generation and absorption of reactive power in power system. Because of new transmission line networks and power stations, variety of loads and transformers the problem of system operation as well as the voltage collapse occurs in power system when system is faulted, heavily loaded and
there is a sudden increase in the demand of reactive power. When voltage fluctuations are there the system is unable to meet the reactive power demand and the loading of long transmission lines increased, it causes voltage instability & reactive power imbalance in power system when. Because of the mechanical components and slow responses of traditional conventional devices like fixed or mechanically switched shunt and series capacitors, reactors and synchronous generators desired performance was not being able to achieve effectively. So, there was a greater need of the alternative technology made of solid state devices with fast response characteristics.
With the invention of semiconductor device like thyristor switch the door for the development of power electronics devices known as Flexible AC Transmission Systems (FACTS) controllers opened. FACTS device are power electronic based semiconductor device which can inject or absorb reactive power in a system as per requirement and one of the most important reactive power sources.
II. BASIC ADVANTAGES AND TYPES OF FACTS DEVICES
The benefits of employing FACTS are mainly:
Power quality by Power profile and voltage profile improvement
With very fast control response time improvement of the dynamic and transient stability
Voltage stability with security improvement Less power loss and Efficiency
Increasing power flow capability Voltage regulation of power system Phase control feasibility in individual phase
From the absence of rotating parts low maintenance requirement
Basically these controllers are divided into following categories:
Shunt controllers like STATCOM, SVC etc. Series controllers like TCSC, TSSC, SSSC etc. Series-Shunt controllers like UPFC, IPFC etc.
IJEDR1302007 INTERNATIONAL JOURNAL OF ENGINEERING DEVELOPMENT AND RESEARCH | IJEDR Website: www.ijedr.org | Email ID: [email protected] 31 alternating current transmission system) devices have been
done using MATLAB12a/SIMULINK software.
III. INTRODUCTION OF FACTS DEVICES
A. Unified Power Flow Controller (UPFC)
Fig.3.1 shows a basic structure of UPFC.UPFC is a Unified power flow controller.
Fig.3.1 Unified Power Flow Controller (UPFC)
It consists of two voltage source converters (VSC), series and shunt converter, which are connected to each other with a common dc link capacitor which provides bidirectional flow of real power between series connected SSSC and shunt connected STATCOM respectively. As shown in fig.3.1 this converters are coupled with shunt and series transformers with ac voltage bus. The SSSC (Series converter or Static Synchronous Series Compensator) is used to add controlled voltage magnitude and phase angle in series with the line, while shunt converter STATCOM (Static Synchronous Compensator) is used to provide reactive power to the ac system, beside that, it will provide the dc power required for both inverter. Here the energy storing capacity or dc capacitor is generally small and therefore active power drawn by the shunt converter should be equal to the active power generated by the series converter. It gives greater flexibility to the power flow control because the reactive power in the shunt or series converter can be chosen independently.
B. Interline Power Flow Controller (IPFC)
Fig.3.2 shows a basic structure of IPFC.IPFC is a interline power flow controller.
Fig.3.2 Unified Power Flow Controller (UPFC)
The topology shown in the figure consist one shunt connected VSC and two series connected VSC. Here also the shunt converter STATCOM (Static Synchronous Compensator) is used to provide reactive power to the ac system and it will provide the dc supply required for both series connected VSC. The series connected VSCs are SSSC (Series converter or Static Synchronous Series Compensator) which are used to add controlled voltage magnitude and phase angle in series with the both line. With injection of a voltage in series with its host lines the primary function of the IPFC is power-flow control in transmission network. The IPFC controls the magnitude and phase angle of the injected voltages in each line, resulting in four degrees of freedom. Hence, they have the capability to precisely control power flow in two different transmission lines.
IV. SIMULATION &PERFORMANCE ANALYSIS A. Uncompensated System Model
The simulated model of simple basic uncompensated double conductor transmission line is shown below in SMIB system in Fig. 4.1.
Fig.4.1 Uncompensated System Model
IJEDR1302007 INTERNATIONAL JOURNAL OF ENGINEERING DEVELOPMENT AND RESEARCH | IJEDR Website: www.ijedr.org | Email ID: [email protected] 32 Fig.4.2 Signal Measurement subsystem
Fig.4.2 shows the signal Measurement subsystem in which voltage measurement block is used to measure the source and load voltage and current measurement block is used to measure the instantaneous current flowing in the transmission line. The active & reactive Power measurement block in Matlab simulink is used to measure the real power and reactive power in the load. Scope displays the signal generated during a simulation.
Fig.4.3 Load Voltage and Current
Fig.4.4 Active and Reactive Power
In Fig. 4.3, 4.4 the load voltage & current and real & reactive power of the system measured by the scope is shown. Here real and reactive power flow is obtained without any compensation. Here the active power (P) is 13.95Kw and reactive power is 6.57 Kvar for uncompensated system model. So, it has to provide reactive power compensation in order to keep the system stable.
Here for all three system models, generated waveforms are taken and calculations are done for the common parameter C=2000μF, sampling time 25e-3 sec.
and load rating of (10 + j4.71) Ω & (5 + j2.198) Ω constant for an open loop and close loop configuration respectively. Both devices are inserted at 0.1sec in the transmission system model.
B. UPFC Compensated System Model
The simulated model of UPFC with line voltage of 440V, 50Hz is shown below in Fig. 4.5. Here mid-point compensation is done at line 1.
Fig.4.5 UPFC compensated System Model
Fig.4.6 UPFC Signal Measurement subsystem
IJEDR1302007 INTERNATIONAL JOURNAL OF ENGINEERING DEVELOPMENT AND RESEARCH | IJEDR Website: www.ijedr.org | Email ID: [email protected] 33 Fig 4.6 & 4.7 shows the signal measurement system which
measures source and load voltage & current, both transformer and capacitor voltage and current. The THD (Total Harmonic Distortion) block is used to measure the THD level of the system. Here the UPFC compensated system model analysis is done in both open loop and close loop system.
i) For open loop system SPWM (Sine Pulse Width Modulation) control strategy is used for achieving the desired system performance. For this the sine waveform of 625 v (440 rms) , 50Hz is given to the continuous PWM block with the sampling frequency of 20KHz for generating the 4 pulse continuously which feds as the gate signals for UPFC as shown in Fig. 4.8.
Fig.4.8 SPWM pulse generator for open loop UPFC
Fig.4.9 Active and Reactive power for open loop UPFC
Fig.4.10 FFT Analysis for open loop UPFC
Fig. 4.9 shows the active & reactive power of the system measured by the scope. Here the active power (P) is 15.84 Kw and reactive power is 9.32 Kvar for open loop UPFC system model. The FFT (fast fourier transform) analysis of this system shows 0.46% of THD level as shown in fig. 4.10.
ii) For close loop system PID controller as shown in fig.4.11 is used in a reference tracking mode for achieving the desired system performance. Here the measured load voltage is given to the PID controller for controlling it in a specific range. Also the reference sine wave controlled by gain which is adaptive in nature is given for tracking purpose. The PID controller generates PWM pulses for UPFC according to the parameter of system voltage.
Fig.4.11 PID PWM pulse generator for close loop UPFC
Fig.4.12 Active and Reactive power for close loop UPFC
Fig.4.13 FFT Analysis for close loop UPFC
Fig. 4.12 shows the active & reactive power of the system measured by the scope. Here the active power (P) is 16.32 Kw and reactive power is 7.6 Kvar for close loop UPFC system model. The FFT (fast fourier transform) analysis of this system shows 0.38% of THD level as shown in fig. 4.13.This results shows the improvement in system performance as the power profile improves and the THD level of the system is also reduced because of the close loop PID controller.
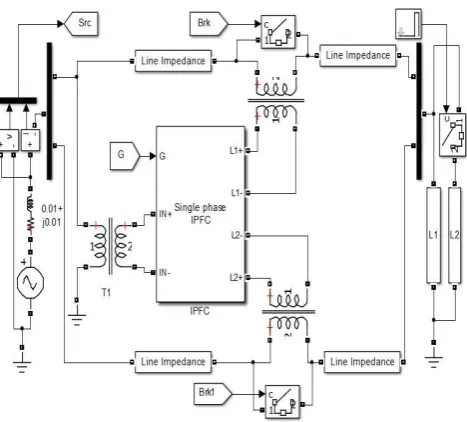
C. IPFC Compensated System Model
IJEDR1302007 INTERNATIONAL JOURNAL OF ENGINEERING DEVELOPMENT AND RESEARCH | IJEDR Website: www.ijedr.org | Email ID: [email protected] 34 Fig.4.14 IPFC compensated System Model
Fig.4.15 IPFC Signal Measurement subsystem1
Fig.4.16 IPFC Signal Measurement system
Fig 4.15 & 4.16 shows the signal measurement system which measures source and load voltage & current, all transformer and capacitor voltage and current. Also the THD (Total Harmonic Distortion) block is used to measure the THD
level of the system. Here the IPFC compensated system model analysis is done in both open loop and close loop system.
i) In open loop system for achieving the desired system performance SPWM (Sine Pulse Width Modulation) control strategy is used. For this the sine waveform of 625 v (440 rms) , 50Hz is given to the continuous PWM block with the sampling frequency of 20KHz for generating the 4 pulse continuously which feds as the gate signals for IPFC as shown in Fig. 4.17.
Fig.4.17 SPWM pulse generator for open loop IPFC
Fig.4.18 Active and Reactive power for open loop IPFC
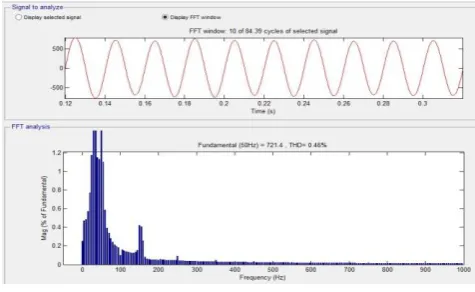
Fig.4.19 FFT Analysis for open loop IPFC
Fig. 4.18 shows the active & reactive power of the system measured by the scope. Here the active power (P) is 26.34 Kw and reactive power is 12.41 Kvar for open loop IPFC system model. The FFT (fast fourier transform) analysis of this system shows 0.23% of THD level as shown in fig. 4.19.
IJEDR1302007 INTERNATIONAL JOURNAL OF ENGINEERING DEVELOPMENT AND RESEARCH | IJEDR Website: www.ijedr.org | Email ID: [email protected] 35 by gain which is adaptive in nature is given for tracking
purpose. The PID controller generates 4 PWM pulses for IPFC according to the parameter of system voltage.
Fig.4.20 PID PWM pulse generator for close loop IPFC
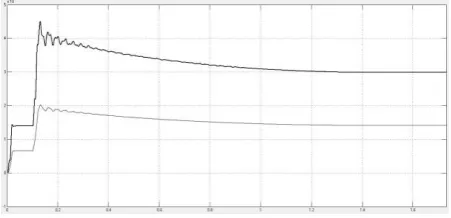
Fig.4.21 Active and Reactive power for close loop IPFC
Fig.4.22 FFT Analysis for close loop IPFC
Fig. 4.21 shows the active & reactive power of the system measured by the scope. Here the active power (P) is 29.89 Kw and reactive power is 14.08 Kvar for close loop UPFC system model. The FFT (fast fourier transform) analysis of this system shows 0.16% of THD level as shown in fig. 4.22. Because of the close loop PID controller the power profile improves and hence this results shows the improvement in system performance and the THD level of the system is also reduced.
V. RESULT
Here for the uncompensated system model and both compensated system models the comparisons are done for the common parameters as mentioned above. The results are tabulated below.
Table. 5.1 Performance analysis of UPFC and IPFC
FACTS Device
Open loop System Close loop System
Active power (P) Kw Reactive power (Q) Kvar Active power (P) Kw Reactive power (Q) Kvar
UPFC 15.83 9.32 16.32 7.69
IPFC 26.34 12.41 29.89 14.08
Table. 5.2 FFT analysis of UPFC and IPFC
FACTS Device
Total Harmonic Distortion level %
Open loop System Close loop System
UPFC 0.46 0.38
IPFC 0.23 0.16
For Uncompensated System Model the value of active power and reactive power are obtained as 13.95 Kw and 6.5 Kvar. Here table 5.1 shows the values of active and reactive power for both UPFC and IPFC in open loop and close loop system. Table 5.2 contains the FFT analysis for both devices which shows THD level of the system.
VI. CONCLUSION
In this paper performance analysis of UPFC and IPFC are presented in SMIB system and MATLAB12a /SIMULINK environment is used for this comparative study to model and simulate IPFC and UPFC connected to a simple transmission line.
Real power (P) and reactive power (Q) of the system is compared with and without the presence of UPFC and IPFC in the system for both open loop and close loop configuration. It is shown from the table 5.1 that power profiles are improved with the addition of both the compensating devices with respect to uncompensated system model in each case.
In table 5.2 it is also shown with the help of FFT (fast fourier transform) analysis that in open loop system the Total Harmonic Distortion level % for both devices are very low and it is further improving in case of close loop system.
In both cases it is clearly shown from result that for the same amount of capacitor IPFC is compensating more to the system with low amount of THD in comparison with UPFC. So, we can conclude that IPFC gives better performance when compared to UPFC for a given operating condition with much low value of THD.
REFERENCES
[1] Rishabh Shah, Nehal Patel “Simulation Modeling & Comparison of Various FACTS Devices for Reactive Power Control In Power System”emerging vistas of technology in 21st century 2013,ISBN 978-93-82880-34-9
[2] Samima Akter, Priyanath Das “Comparison of the Performance of IPFC and UPFC FACTS Controller in Power System” International Journal of Computer Applications (0975 – 8887) Volume 67– No.2, April 2013
IJEDR1302007 INTERNATIONAL JOURNAL OF ENGINEERING DEVELOPMENT AND RESEARCH | IJEDR Website: www.ijedr.org | Email ID: [email protected] 36 [4] Naser Parhizgar, Zahra Dehghani, Mehdi Roopaei, Parisa
Esfandiar “Comparison between PST-UPFC and IPFC on Power Flow Control and Profile Voltage in Power System” Australian Journal of Basic and Applied Sciences, 5(7): 711-723, 2011.ISSN 1991-8178
[5] S.Sankar, S.Balaji, S.Arul, “ Simulation and Comparison of Various FACTS Devices in Power System” International Journal of Engineering Science and Technology Vol. 2(4), 2010, 538-547
[6] Nashiren.F. Mailah, Senan M. Bashi, “ Single Phase Unified Power Flow Controller (UPFC): Simulation and Construction” European Journal of Scientific Research ISSN 1450-216X Vol.30 No.4 (2009), pp.677-684
[7] R. Mohan Mathur, Rajiv K. Varma, “ Thyristor-Based Facts Controllers For Electrical transmission Systems” Ieee Press, John Wiley & Sons, Inc. Publication, ISBN 0-471-20643-1
[8] N. G Hingorani & Laszlo Gyugyi, “Understanding FACTS: concepts and technology of flexible AC transmission System”, IEEE Press, New York (2000).