Article.
Characterization of PM
2.5
at a Traffic Site Using
Several Integrated Analytical Techniques
Nasser M. Hamdan 1,2*, Hussain Alawadhi 2 and Mohamed Shameer 2
1 Physics Department, The American University of Sharjah, United Arab Emirates; [email protected]
2 Center for Advanced Materials Research, University of Sharjah, United Arab Emirates
* Correspondence: [email protected];
Abstract: We have conducted a comprehensive year-long sampling campaign for particulate matter (PM) pollutants at a site near a major highway, following standard protocols. Total mass, and elemental and chemical composition of the fine fractions (PM2.5) of traffic-related pollutants are determined utilizing several complementary techniques. These complementary techniques included gravimetric analysis, X-ray fluorescence (XRF), scanning electron microscopy and energy dispersive spectroscopy, X-ray diffraction (XRD) and black carbon multi-wavelength absorption. The results show that the PM2.5 mass concentrations are within or slightly above international standards and include natural dust and anthropogenic pollutants such as black carbon, sulfates and other traffic-related elements. Anthropogenic sources include the secondary pollutants Mascagnite and Koktaite, traffic emissions such as exhaust emissions and tires, brakes and road erosions. It was found that the sulfates are the highest contributors to PM2.5 (~40%), as evident from XRD results and the S content in the XRF analysis.
Keywords: PM2.5; chemical composition; PMF, Traffic site
1. Introduction
The United Arab Emirates has gone through rapid development and urbanization in the past few decades. It is characterized as an arid region with annual rainfall of less than 50 mm/year and large expansion of deserts [1-3]. The country is associated with increased anthropogenic sources of pollution, including crustal materials due to mega construction projects, oil-related and industrial projects, and heavy traffic emissions. This is in addition to natural pollution sources such as sea salts from the Arabian Gulf and frequent dust storms originating from the desert. Outdoor particle matter (PM) pollution is considered to be the leading environmental risk in the UAE due to its adverse health effects [4-13]. Traffic emissions are a major source of anthropogenic pollutants that have adverse health effects. Several toxic elements and hazardous compound are emitted from fuel burning (diesel and gasoline), tire and brake-pad erosions and road dust resuspension [14-17].
Although there has been several studies on air pollution in the region, the present study represents a systematic sampling campaign and analytic approach utilizing several non-destructive, bulk and spectroscopic approaches to identify the constituents of the fine fraction of PM in the air (PM2.5) at a “traffic” site [1, 9, 18-20]. The study included gravimetric and statistical analysis, complementary non-destructive techniques such as X-ray fluorescence (XRF), scanning electron microscopy and energy dispersive spectroscopy (SEM/EDS), X-ray diffraction (XRD), and black carbon content measurements to determine elemental composition and chemical speciation for PM pollutants, that can be used as source tags for pollutants [21].
2. Experiments
2.1. Sampling campaign and protocol
Sampling was performed using a low volume sampler LVS/LVS6-RV manufactured by Sven Leckel, Ingenieurbüro GmbH Germany. PM2.5 samples were collected for 24 hours twice a week, using the EN standard (EN12341, 2.3 m3/h) on 47 mm diameter Teflon filters. PM2.5 campaign ran between October 25, 2017 and October 26, 2018, near Sharjah International Airport highway. The site is an air quality-monitoring site for the Sharjah-based Bee’ah, an environmental management company. The site is within 50 meters from the highway and about 15 m above the highway level. The highway usually has high traffic congestions in the morning between 7:00 am and 9:00 am, and in the evening between 4:30 pm and 8:00 pm on weekdays, while it has normal traffic flow outside these intervals and during weekends. Sampling was performed every sixth day between October 25, 2107and January 14, 2018, and continued twice weekly after that: every Tuesdays (working days) and Fridays (weekends) starting from 00:01 am and 23:59 pm. The temperatures and humidity were recorded every five minutes during sampling and a normalized air volume at standard temperatures, pressures and humidity was then used to calculate the amount of pollution per cubic meter of air. Because of the high temperatures in the region, the normalized air volume was usually about 10% less than the measured air volume. The normalized volumes were used for all the subsequent calculations.
2.2. Gravimetric analysis
Airborne PM2.5 mass concentrations were determined gravimetrically following a standard operating procedure[1]. Teflon filters were preconditioned at standard temperatures and relative humidity, neutralized with an electrostatic charge neutralizer, and weighed on a Sartorius
microbalance with a precision better than 1 µm. The average of four weighing trials were taken to be the mass of the filter before sampling. The process is repeated after sampling. Mass densities were then calculated according to the equation:
𝑀 = 𝑊𝑓 –𝑊𝑖
Q × t (1)
where 𝑀 is the average mass density of PM in air (in 𝜇𝑔/𝑚3); 𝑊𝑓 and 𝑊𝑖 are the final and initial average mass of the Teflon filter (in 𝜇𝑔), respectively, Q is the air-flow rate in the sampler (in 𝑚3/ℎ) and 𝑡 is the sampling time (in ℎ). The air volume-flow during the sampling duration, Q x t, was normalized by continuously monitoring the relative humidity, pressures and temperature during the sampling using meteorological sensors attached to the sampling head.
2.3 Equivalent black carbon measurements
To determine the equivalent black carbon (EBC)[1, 22], a Multi-wavelength Absorption Black Carbon Instrument (MABI) was used. The instrument uses 7 lasers to determine the light absorption coefficient of a specimen at different wavelengths. “The Laser absorption method relies on a mass absorption coefficient which is a strong function of the particle size, refractive index and density of the EBC particles, as well as the wavelength of light used. As fine EBC can be generated from a range of different sources, its particle size and density distribution may also vary in a collected sample depending on the dominant sources of EBC at the site” [23]. Using different wavelengths of light can resolve the different EBC size fractions collected in a sample. This information can then be used to differentiate the different EBC size fractions originating from sources such as wood smoke or motor vehicles.
2.4. XRF: Elemental analysis
Micromatter thin film standards, with film thicknesses comparable to sample thicknesses, were used to establish single-point calibration values for the sensitivity factors (in cps m-1A-1 / µg cm-2) for the following elements: Na, Mg, Al, Si, P, S, Cl, K, Ca, Ti, V, Cr, Mn, Fe, Ni, Cu, Zn, Rb, Sr, Zr, Ba and Pb. Elemental composition (in µg/m3) for all Teflon filters were then determined utilizing the sensitivity factor for each element. For the purpose of quality assurance and control, the data were validated against a NIST Standard Reference Material 2783, using the same established calibration procedures mentioned above for the Micromatter film standards. This Standard Reference Material is an air particulate sample reduced in particle size to simulate airborne PM2.5 and deposited on a polycarbonate filter membrane[1].
2.5. SEM/EDS measurements
Imaging and elemental maps were performed for selected filters on a TESCAN environmental scanning electron microscope (VEGA3 XMU) using an Oxford Instruments X-Max 50 EDS detector. Mappings were done for 8 minutes. Filters representing different weather conditions and different seasons were selected for analysis. The electron beam excitation was set at 20 kV and low vacuum (10 Pa) was used to avoid charging of the filters. Fourteen filters from both clear and dusty days were selected for SEM imaging and elemental mapping.
2.6. XRD crystallographic phase analysis
3. Results and discussions
3.1 Gravimetric Analysis
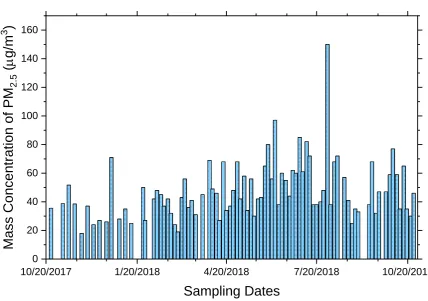
Figure 1. Variation of the mass concentrations in µg/m3 for each of PM2.5 samples collected over the sampling campaign period.
Figure 1 represents the mass concentrations in µg/m3 for each of the PM2.5 filters collected over the sampling campaign period. Other than dust storm and windy days, the mass concentrations lie within or slightly higher than international standards. The United States Environmental Protection Agency’s 24-hour fine-particle standard for mass concentration is 35 µg/m3. PM2.5 data shows that during winter (November to February) most of the data lies within the international standards with an average mass concentration of 34 µg/m3. More dusty days start to occur during the spring and summer, resulting in larger PM2.5 concentrations with an average of 50 µg/m3. The overall mass concentration average was 46 µg/m3. It is also noted that natural pollutants originating during dust events contribute to the fine particles in the atmosphere. The UAE climate during the year can be divided into two seasons: a very hot summer and a moderate “winter”. We can consider the months between May and October to be a summer season, where both the temperatures and humidity are high, while the months between November and May have more moderate weather. The high humidity traps the fine particles in the air for prolonged periods, resulting in higher mass concentrations in the spring and summer months. This is also evident from the hazy atmosphere during these months.
10/20/2017 1/20/2018 4/20/2018 7/20/2018 10/20/2018
0 20 40 60 80 100 120 140 160
Mass Concen
tr
ation
of
PM
2.
5
(
m
g/m
3
)
3.2: Equivalent black carbon
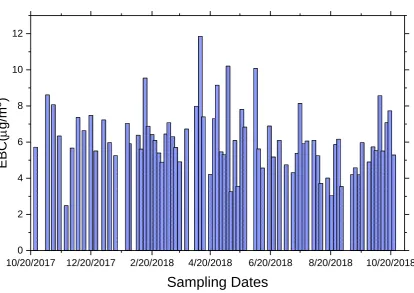
Figure 2. EBC content of PM2.5 for the campaign period.
Figure 2 shows the variation of EBC concentrations for PM2.5 at different sampled dates, obtained using the MABI instrument. The average EBC over the campaign period was 6.6 µg/m3, with values ranging from 2.5 µg/m3 on November 25, 2017, to 11.9 µg/m3 on April 10, 2018. It should be noted that EBC results for dusty days were not included in Figure 2 because of the large amount of PM that affect the transmission signal of the MABI instrument. Traffic emission is believed to be the main source of EBC.
3.3 XRF Results
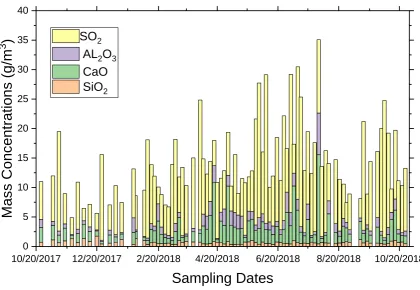
XRF was measured for the 86 collected PM2.5 samples. Twenty-two elements were analyzed, and the mass concentrations of these elements were determined in addition to their uncertainties. Since these elements do not exist in pure elemental state, it is assumed that they exist in oxide forms. Table S1 shows the concentrations of all elements within the detection limit with their uncertainties. The table shows that sulfur (here assumed to be sulfur dioxide) is the highest among all other elements, with an annual average of 10 μg/m3, and with values as high as 25 μg/m3. Figure 3 shows the concentration variation of the oxides of S, Si, Ca and Al over the whole year of sampling. The S exists mostly in the form of sulfates, as will be shown from XRD and SEM/EDS results later in the article. XRF results reveal that sulfates, which are secondary pollutants formed from gas-to-particle conversion in the atmosphere, are the dominant phases in PM2.5.
Natural and crustal sources of pollutants also contribute to the fine fraction of PM. Among these are calcite (CaCO3), and quartz (SiO2)[24]. Figure 3 shows the concentrations of Ca, Si, Al and S, as calculated from the XRF spectra. The Ca concentration (mostly in the form of calcite) over the year averages to 2.5 μg/m3, with a few higher values on the days that had dust events. The figure also shows the concentrations of S and Al, with S having the largest contribution to PM2.5. One data point has been removed from the figure because of an extreme dust storm on July 31, 2018. The annual
10/20/2017 12/20/2017 2/20/2018 4/20/2018 6/20/2018 8/20/2018 10/20/2018 0
2 4 6 8 10 12
EBC(
m
g/m
3
)
average of the Si concentration (mostly in the form of quartz) in PM2.5 is about 0.7 μg/m3. Fe also has a similar concentration as Al. Sea salts originating from the sea breeze from the Arabian Gulf are among the natural sources that exist in the PM collected in the region. Figure 4 shows a reasonable correlation (~ 0.54) between the concentrations of Cl and Na for the data collected over the whole sampling campaign. High correlations between Na and Cl were observed for several days such as February 20, and July 6, 2018. The measured correlation factor is expected because not all the Na content is correlated with Cl. Some of the Na contribution is due to formation of sodium nitrates (NaNO3), as will be shown below from elemental maps. The presence of other elements with lower concentrations such as Mg, K, and Ti are also confirmed with XRF.
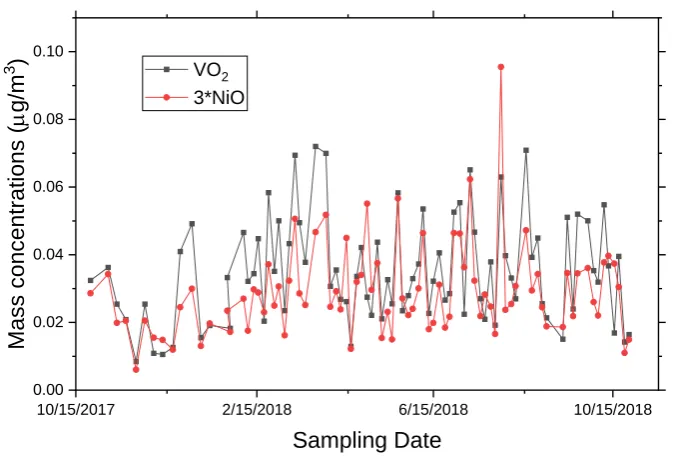
XRF analysis also revealed the concentration of trace elements such as Cr, Mn, Ni, V, Pb, Zn and Cu. These elements can be used as markers for certain pollution sources. For example, V and Ni are known to be originating from heavy oil combustion used in ships [25-28]. Figure 5 shows a very good correlation (> 0.75) between these two elements, indicating that they are originating from the same source. The V (in the form of vanadium oxide) concentrations varied between (10 – 70) ng/m3, while the Ni (in the form of Nickle oxide) concentrations varied between (2 – 30) ng/m3. Zn, Cu, Ba, Mn, EBC and Pb are elements associated with traffic exhaust emissions[14, 15, 29, 30]. Other crustal elements such as Fe, Al, Si and Ca are also considered as road dust due to resuspension. Figure 6 shows the variation of Pb content for all sampling days. The figure shows an average mass concentration of lead oxide of 30 ng/m3 with a few spiking as high as 190 ng/m3. Lead is originating from industrial emissions, such as car battery recycling plants within a few miles from the sampling site. These values are still well below the international air quality limits of 500 ng/m3[29].
Figure 3. Variation of S, Ca, Si and Al concentrations with time.
10/20/2017 12/20/2017 2/20/2018 4/20/2018 6/20/2018 8/20/2018 10/20/2018 0
5 10 15 20 25 30 35 40
Mas
s Co
nc
entrations
(g/m
3
)
Sampling Dates
SO
2Figure 4. Concentration variation of Na and Cl, showing positive correlation between the two elements in some days and the negative correlation in others.
.
Figure 5. Concentration variation of N and V, showing excellent correlation between the two elements.
10/10/2017 2/10/2018 6/10/2018 10/10/2018
0 1 2 3 4 5 6 7
Mas
s Co
nc
entrations
(arbit
rary units)
Sampling Date
Cl 2*Na2O
10/15/2017 2/15/2018 6/15/2018 10/15/2018
0.00 0.02 0.04 0.06 0.08 0.10
Mas
s co
nc
entrations
(
m
g/m
3
)
Sampling Date
Figure 6. Concentration variation of Pb content for the sampling days.
All elemental contributions and the EBC content for each sample were added up and compared with the total mass concentration obtained by gravimetric measurements. The reconstructed mass concentrations from XRF and EBC measurements were found to have an overall yearly average of 50% of the total mass concentrations. Figure 7 shows the variation of the ratio of the reconstructed mass concentrations obtained by the sum of XRF and EBC analysis to that of the total mass obtained by gravimetric measurements. Except for a few points, the data are distributed about 50 ± 10%. On April 13, 2018, the ratio was 97%. On that day, the total PM2.5 obtained by gravimetric measurements was 27 μg/m3, the total mass of the elemental oxides obtained by XRF was 18.9 μg/m3 and those of the EBC was 7.4 μg/m3. Similar behavior was also observed for the samples collected on July 20 and August 25, 2018. The three spikes occurred on clear days, as can be seen from gravimetric data.
Figure 7. Variation of the ratio of the reconstructed mass concentrations obtained by the sum of XRF and EBC analysis to that of the total mass obtained by gravimetric measurements.
10/20/2017 1/20/2018 4/20/2018 7/20/2018 10/20/2018
0.00 0.05 0.10 0.15 0.20
Mass Concen
tr
ation
of
Pb
O
(
m
g/m
3 )
Sampling Date
10/20/2017 12/20/2017 2/20/2018 4/20/2018 6/20/2018 8/20/2018 10/20/2018
0.0 0.2 0.4 0.6 0.8 1.0
inor
ga
nic e
lemn
ts& EBC / tot
al m
ass c
on
cen
tra
tion
Organic carbon (which is not detectable by techniques used in this study) due to both primary and secondary sources is responsible for about 30% of the total mass concentrations. These aerosol pollutants are expected to be high in the vicinity of an active traffic highway. Alkanes are among the most abundant organic species [31]. Other common organic compounds originating from road traffic emissions, solid fuel combustion and industrial emissions are polycyclic aromatic hydrocarbons (PHAs) [32]. Biologic and soil organic matter, and organic acids are also reported in the literature as common organic PM [31]. Pant et al. has reported in their study for New Delhi that organic matter (OM) contributes to more than 33% of PM2.5 in the summer [31]. Fu et al. [33] has reported, based on organic tracers, that traffic contributions can be as high as 43%. We therefore assume that OM contribution, particularly for the current traffic site, is between 30 – 35%. This will leave the error margin in our source assignment reconstruction for PM2.5 from XRF elemental composition determinations and from EBC measurements to be in the range of 10-20%.
3.4. XRD Results
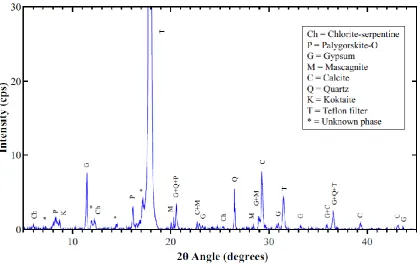
XRD analysis was performed on 20 selected samples. Figure 8 is a representative of most of the analyzed samples. The figure shows the analysis of filter 80, sampled on October 5, 2018. Although this was a dusty day with a mass concentration of 77 µg/m3, the XRD pattern does not show any crustal or mineral phase. The figure shows the presence of two phases: ammonium sulfate [(NH4)2SO4] as Mascagnite, and calcium ammonium sulfate [(NH4)2Ca(SO4)2·H2O] as Koktaite, in addition to peaks originating from the Teflon filter. Most of the analyzed samples showed only these three phases. This is a strong evidence that sulfates are the dominant phase in the fine PM, which agrees with the observed XRF results and analysis above. It should be mentioned that although XRD cannot detect trace, organic or amorphous phases, it is a very powerful tool to understand the composition and formation mechanisms of secondary pollutants. Masganite and Koktaite exist in very fine particle sizes [9]. Mascagnite is a secondary pollutant formed by the conversion of sulfur dioxide [SO2] gas generated form traffic, power plants and various industries because of fossil fuel burning, into fine particles. With the high temperatures, abundance of sunshine, and high relative humidity in Sharjah, oxidation of the SO2 gas phase by hydroxyl radical (OH) produces sulfuric acid (H2SO4), which then interacts with ammonia (NH3) to form the ammonium sulfate’s fine particles (< 0.5 μm in diameter)[34]. Calcite that is present in the atmosphere reacts with the ammonium sulfate, at a rate measured in days, to yield Koktaite as an intermediate product and, finally, Gypsum [CaSO4·2H2O]. Gypsum appears mostly in PM10 [24, 35].
Figure 8.XRD pattern for filter 80, sampled on October 5, 2018. Most of the tested PM2.5 samples show the same phases.
Figure 9.XRD pattern for filter 35, sampled on on April 17, 2018, a dusty day.
3.5. SEM/EDS Results
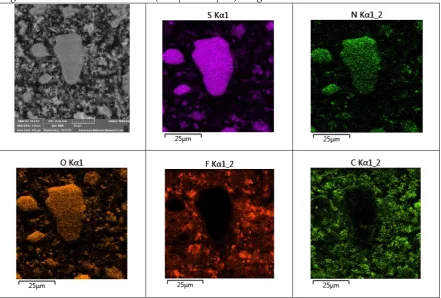
having a size of more than 25 µm. Elemental maps show an excellent corrolation between the maps of S, N and O, confirming the results observed by XRD above and the domination of S in the XRF results. This is also a confirmation that S exists as sulfate phase, a secondary phase that is formed in the atmosphere through gas-to-particle coversion, as explained earlier. The figure also shows maps of F and C, both represnting the filter material. These elelments are clearly absent in areas where ammonium sulfate exisis.
The critical relative humidity (RH) of ammonium sulfate at 24 °C is 81%. On October 6, from 00:00 to 9:00 am, hours after sampling was done and the sampling station was still outside, RH increased from 89% to 100% and the temperature dropped to 24 °C, causing some of the Mascagnite on the filter to melt. As the sun rose later in the day, the humidity decreased to 29% while the temperature increased to 37 °C, causing evaporation of the moisture and formation of the observed large chunks of ammonium sulfate (~ 25 µ m x 15µ m) in figure 10.
Figure 10. SEM micrograph (2000x magnification) and elemental maps of S, N, O, F and C for PM2.5 sample 80 collected on October 5, 2018.
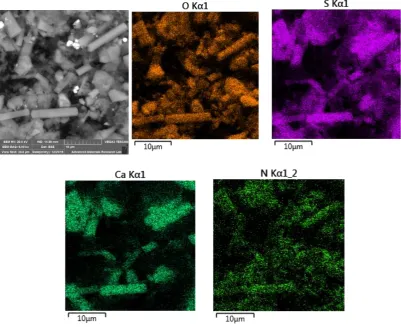
Figure 11. SEM micrograph (6000x magnification) and elemental maps of Ca, S, N and O for PM10 sample 67 collected on October 5, 2018.
The EDS maps of most samples also show correlations among several other elements (not shown here) that were measured by XRF and correspond to mineral phases observed by XRD, such as Quartz, Calcite, Palygorskite and Chlorite-serpentine. In addition to maps for the phases observed by XRD, Halite and Sodium Nitrate have been observed in the EDS maps of several samples. Figure 12 shows elemental maps of Na, Cl, N and O for sample 21, which was collected on February 20, 2018.
Figure 12. SEM micrograph and elemental maps for sample 21 collected on February 20, 2018, showing correlations between Na and Cl for one crystal (upper right corner). No correlation with oxygen for that crystal. Several other crystals show correlations among Na, N and O. .
on the direction of the wind, the Halite in this sample is originating from the sea breeze coming from the Arabian Gulf (to the west of the sampling site), while the sodium nitrate is a secondary pollutant formed in the atmosphere.
4. Conclusions
Fine PM sampled at a roadside site were found to be affected by dust events and traffic. In the absence of dust storms, the mass concentrations of PM2.5 were found to be within international standards. The integration of complementary, nondestructive analytical techniques in the investigation, such as gravimetric analysis, EBC, XRF, XRD, and SEM/EDS mapping enabled us to perform chemical speciation and analysis to identify various primary and secondary compounds in the atmospheric PM. For example, elemental mapping was used successfully to identify compounds present in the atmosphere that were not detected by XRD.
It was found that secondary sulfates, mainly in the form of Mascagnite and Koktait, were the most dominant phases in PM2.5, representing more than 40% of the total mass, as obtained from XRF analysis. XRD also confirmed these results, showing that these two sulfates are the major phases present in most of the analyzed samples. Sea salts (such as Halite) and nitrates (such as sodium nitrates) were not detected in the XRD but were confirmed by XRF results and EDS elemental maps. The formation of sulfates as secondary phases were more probable than nitrates because of the high temperatures and humidity [36]. In addition, the region does not have major agricultural and biomass activities. Minerals and crustal compounds were also observed in the elemental maps, confirming that natural sources also contribute to the fine fraction of aerosol pollutants. Trace elements such as Ni, V, Pb, Cr, Mn, Zn and Cu were also detected. These elements are markers for specific sources of pollutants such as traffic and industrial emissions and heavy oil combustion. The average concentration of EBC was found to be 6.6 µg/m3. We have estimated the contribution of OM to PM2.5 mass concentration to be in the range of (30-35)%.
Supplementary Materials: The following are available online at www.mdpi.com/xxx/s1, Figure S1: Elemental compositions with their uncertainties, and elemental black carbon content of PM2.5.
Author Contributions: All the authors have contributed to this article as follows: methodology, NMH and HA; software, MS; validation, NMH and HA; formal analysis, NMH and HA; investigation, NH and MS; data curation, MS, HA, NH; writing—original draft preparation, NMH.; writing—review and editing, HA and NMH.; supervision, NMH; project administration, NMH; funding acquisition, NMH and HA. All authors have read and agreed to the published version of the manuscript,
Funding: This work was funded by the American University of Sharjah under grant number FRG16‐R‐08, and by the University of Sharjah under grant number No. 16020143026-P.
Acknowledgments: The authors acknowledge the support of the Center for Advanced Materials Research at the University of Sharjah. NMH received support from the Dean’s office, College of Arts and Sciences at the American University of Sharjah.
Conflicts of Interest: The authors declare no conflict of interest.
References
[1] N. M. Hamdan, H. Alawadhi, N. Jisrawi, and M. Shameer, "Characterization of fine particulate matter
in Sharjah, United Arab Emirates using complementary experimental techniques," Sustainability, vol. 10, p. 1088, 2018.
[2] NCMS, "Climate Yearly Report 2013-2017," ed, 2013-2017.
[3] U. NCMS. (2019). UAE climate yearely report 2003- 2018.
[4] J. M. Gibson and Z. S. Farah, "Environmental risks to public health in the United Arab Emirates: a
[5] J. Al Jaberi, J. Thomsen, M. Al Hashimi, S. Al Bagham, M. Al Yousuf, K. Jamil, et al., "The national strategy and action plan for environmental health for the UAE," Abu Dhabi, 2010.
[6] Y. Li, J. M. Gibson, P. Jat, G. Puggioni, M. Hasan, J. J. West, et al., "Burden of disease attributed to anthropogenic air pollution in the United Arab Emirates: estimates based on observed air quality data,"
Science of the total environment, vol. 408, pp. 5784-5793, 2010.
[7] C. M. Wong, H. Tsang, H. K. Lai, G. N. Thomas, K. B. Lam, K. P. Chan, et al., "Cancer mortality risks
from long-term exposure to ambient fine particle," Cancer Epidemiology and Prevention Biomarkers, vol. 25, pp. 839-845, 2016.
[8] V. Tsiouri, K. E. Kakosimos, and P. Kumar, "Concentrations, sources and exposure risks associated with
particulate matter in the Middle East Area—a review," Air Quality, Atmosphere & Health, vol. 8, pp. 67-80, 2015.
[9] N. M. Hamdan, H. Alawadhi, N. Jisrawi, and M. Shameer, "Size‐resolved analysis of fine and ultrafine
fractions of indoor particulate matter using energy dispersive X‐ray fluorescence and electron
microscopy," X‐Ray Spectrometry, vol. 47, pp. 72-78, 2018.
[10] K. A. Miller, D. S. Siscovick, L. Sheppard, K. Shepherd, J. H. Sullivan, G. L. Anderson, et al., "Long-term
exposure to air pollution and incidence of cardiovascular events in women," New England Journal of
Medicine, vol. 356, pp. 447-458, 2007.
[11] H. A. Hochstetler, M. Yermakov, T. Reponen, P. H. Ryan, and S. A. Grinshpun, "Aerosol particles
generated by diesel-powered school buses at urban schools as a source of children’s exposure,"
Atmospheric environment, vol. 45, pp. 1444-1453, 2011.
[12] A. Bener, M. Dogan, M. Ehlayel, N. Shanks, and A. Sabbah, "The impact of air pollution on hospital
admission for respirarory and cardiovascular diseases in an oil and gas-rich country," European annals
of allergy and clinical immunology, vol. 41, p. 80, 2009.
[13] J. M. Gibson, J. Thomsen, F. Launay, E. Harder, and N. DeFelice, "Deaths and medical visits attributable
to environmental pollution in the United Arab Emirates," PloS one, vol. 8, p. e57536, 2013.
[14] I. Sundvor, N. Balaguer, M. Viana, X. Querol, C. Reche, F. Amato, et al., "Road traffic’s contribution to
air quality in European cities," ETC/ACM technical paper, vol. 14, pp. 1-74, 2012.
[15] I. Sundvor, N. Castell Balaguer, M. Viana, X. Querol, C. Reche, F. Amato, et al., "Road Traffic’s
Contribution to Air Quality in European Cities, ETC/ACM Technical Paper 2012/14," Copenhagen:
European Topic Centre for Air Pollution and Climate Change Mitigation, 2013.
[16] M. Birch and R. Cary, "Elemental carbon-based method for monitoring occupational exposures to
particulate diesel exhaust," Aerosol Science and Technology, vol. 25, pp. 221-241, 1996.
[17] L.-H. Young, Y.-J. Liou, M.-T. Cheng, J.-H. Lu, H.-H. Yang, Y. I. Tsai, et al., "Effects of biodiesel, engine
load and diesel particulate filter on nonvolatile particle number size distributions in heavy-duty diesel
engine exhaust," Journal of hazardous materials, vol. 199, pp. 282-289, 2012.
[18] A. A. Al-Taani, Y. Nazzal, F. M. Howari, and A. Yousef, "Long-term trends in ambient fine particulate
matter from 1980 to 2016 in United Arab Emirates," Environmental monitoring and assessment, vol. 191, p.
143, 2019.
[19] N. M. Hamdan, H. Alawadhi, and N. Jisrawi, "Particulate matter pollution in the United Arab Emirates:
Elemental analysis and phase identification of fine particulate pollutants," in Proceedings of the 2nd World
Congress on New Technologies (NewTech'16) Budapest, Hungary–August, 2016, pp. 18-19.
[20] N. M. Hamdan, H. Alawadhi, and N. Jisrawi, "Elemental and Chemical Analysis of PM10 and PM2. 5
Indoor and Outdoor Pollutants in the UAE," International Journal of Environmental Science and
[21] L. Samek, Z. Stegowski, and L. Furman, "Preliminary PM2. 5 and PM10 fractions source apportionment
complemented by statistical accuracy determination," Nukleonika, vol. 61, pp. 75-83, 2016.
[22] A. Petzold, J. A. Ogren, M. Fiebig, P. Laj, S. Li, U. Baltensperger, et al., "Recommendations for reporting" black carbon" measurements," 2013.
[23] D. D. Cohen, G. Taha, E. Stelcer, D. Garton, and G. Box, "The measurement and sources of fine particle
elemental carbon at several key sites in NSW over the past eight years," in Proceedings of 15th
International Clean Air and Environment Conference, 2000, pp. 485-490.
[24] X. Song, L. Shao, Q. Zheng, and S. Yang, "Characterization of crystalline secondary particles and
elemental composition in PM 10 of North China," Environmental earth sciences, vol. 74, pp. 5717-5727,
2015.
[25] M. Manousakas, E. Diapouli, H. Papaefthymiou, V. Kantarelou, C. Zarkadas, A. C. Kalogridis, et al.,
"XRF characterization and source apportionment of PM10 samples collected in a coastal city," X‐Ray
Spectrometry, vol. 47, pp. 190-200, 2018.
[26] M. Bove, P. Brotto, F. Cassola, E. Cuccia, D. Massabò, A. Mazzino, et al., "An integrated PM2. 5 source apportionment study: positive matrix factorisation vs. the chemical transport model CAMx,"
Atmospheric environment, vol. 94, pp. 274-286, 2014.
[27] M. Manousakas, H. Papaefthymiou, E. Diapouli, A. Migliori, A. Karydas, I. Bogdanovic-Radovic, et al.,
"Assessment of PM2. 5 sources and their corresponding level of uncertainty in a coastal urban area
using EPA PMF 5.0 enhanced diagnostics," Science of the Total Environment, vol. 574, pp. 155-164, 2017. [28] F. Mazzei, A. D'alessandro, F. Lucarelli, S. Nava, P. Prati, G. Valli, et al., "Characterization of particulate
matter sources in an urban environment," Science of the Total Environment, vol. 401, pp. 81-89, 2008.
[29] EC. (03/07/2020). Air Quality Standards. Available:
https://ec.europa.eu/environment/air/quality/standards.htm
[30] M. Viana, T. Kuhlbusch, X. Querol, A. Alastuey, R. Harrison, P. Hopke, et al., "Source apportionment
of particulate matter in Europe: a review of methods and results," Journal of aerosol science, vol. 39, pp. 827-849, 2008.
[31] P. Pant, A. Shukla, S. D. Kohl, J. C. Chow, J. G. Watson, and R. M. Harrison, "Characterization of
ambient PM2. 5 at a pollution hotspot in New Delhi, India and inference of sources," Atmospheric
Environment, vol. 109, pp. 178-189, 2015.
[32] J. C. Chow, J. G. Watson, H. Kuhns, V. Etyemezian, D. H. Lowenthal, D. Crow, et al., "Source profiles for industrial, mobile, and area sources in the Big Bend Regional Aerosol Visibility and Observational
study," Chemosphere, vol. 54, pp. 185-208, 2004.
[33] P. Fu, K. Kawamura, C. Pavuluri, T. Swaminathan, and J. Chen, "Molecular characterization of urban
organic aerosol in tropical India: contributions of primary emissions and secondary photooxidation,"
Atmospheric Chemistry and Physics, vol. 10, pp. 2663-2689, 2010.
[34] A. Ianniello, F. Spataro, G. Esposito, I. Allegrini, M. Hu, and T. Zhu, "Chemical characteristics of
inorganic ammonium salts in PM 2.5 in the atmosphere of Beijing (China)," Atmospheric Chemistry and
Physics, vol. 11, pp. 10803-10822, 2011.
[35] P. Satsangi and S. Yadav, "Characterization of PM 2.5 by X-ray diffraction and scanning electron
microscopy–energy dispersive spectrometer: its relation with different pollution sources," International
Journal of Environmental Science and Technology, vol. 11, pp. 217-232, 2014.
[36] C. Belis, F. Karagulian, B. R. Larsen, and P. Hopke, "Critical review and meta-analysis of ambient
particulate matter source apportionment using receptor models in Europe," Atmospheric Environment,