University of Windsor University of Windsor
Scholarship at UWindsor
Scholarship at UWindsor
Electronic Theses and Dissertations Theses, Dissertations, and Major Papers
1-1-2007
Engine defect detection using wavelet analysis.
Engine defect detection using wavelet analysis.
Bhaskar Ray University of Windsor
Follow this and additional works at: https://scholar.uwindsor.ca/etd
Recommended Citation Recommended Citation
Ray, Bhaskar, "Engine defect detection using wavelet analysis." (2007). Electronic Theses and Dissertations. 6978.
https://scholar.uwindsor.ca/etd/6978
NOTE TO USERS
This reproduction is the best copy available.
ENGINE DEFECT DETECTION USING WAVELET ANALYSIS
by
BHASKAR RAY
A Thesis
Submitted to the Faculty of Graduate Studies through Electrical And Computer Engineering
in Partial Fulfillment of the Requirements for the Degree of Master of Applied Science at the
University of Windsor
Windsor, Ontario, Canada
Library and Archives Canada
Bibliotheque et Archives Canada
Published Heritage Branch
395 W ellington Street Ottawa ON K1A 0N4 Canada
Your file Votre reference ISBN: 978-0-494-35003-4 Our file Notre reference ISBN: 978-0-494-35003-4
Direction du
Patrimoine de I'edition
395, rue W ellington Ottawa ON K1A 0N4 Canada
NOTICE:
The author has granted a non exclusive license allowing Library and Archives Canada to reproduce, publish, archive, preserve, conserve, communicate to the public by
telecommunication or on the Internet, loan, distribute and sell theses
worldwide, for commercial or non commercial purposes, in microform, paper, electronic and/or any other formats.
AVIS:
L'auteur a accorde une licence non exclusive permettant a la Bibliotheque et Archives Canada de reproduire, publier, archiver,
sauvegarder, conserver, transmettre au public par telecommunication ou par I'lnternet, preter, distribuer et vendre des theses partout dans le monde, a des fins commerciales ou autres, sur support microforme, papier, electronique et/ou autres formats.
The author retains copyright ownership and moral rights in this thesis. Neither the thesis nor substantial extracts from it may be printed or otherwise reproduced without the author's permission.
L'auteur conserve la propriete du droit d'auteur et des droits moraux qui protege cette these. Ni la these ni des extraits substantiels de celle-ci ne doivent etre imprimes ou autrement reproduits sans son autorisation.
In compliance with the Canadian Privacy Act some supporting forms may have been removed from this thesis.
While these forms may be included in the document page count,
their removal does not represent
Conformement a la loi canadienne sur la protection de la vie privee, quelques formulaires secondaires ont ete enleves de cette these.
ABSTRACT
This study is concerned with the development of a non-intrusive engine fault detection
system that uses vibration signature analysis to detect and diagnose mechanical defects in
internal combustion engines. Various existing engine fault detection methods are studied
and a new method is developed that incorporates the use of Wavelet Packet Transform
(WPT). Vibration signals are recorded using accelerometers mounted on the engine and
measurements are then transformed to the crank angle domain and subsequently to
wavelet domain from which the features are analyzed and compared to the vibration
signatures of engines with known defects. The results from this study show that the
proposed method can detect the cause of several commonly occurring mechanical defects
in engines, such as defective valve lash adjusters, cam phasers, chain-tensioners and
piston rod assembly related defects while also allowing for the precise identification of
DEDICATION
This work is dedicated to my parents, who have always provided me with the love and
support to achieve everything possible and to Terry, who stood by me throughout my
University experience and offered unrelenting support and encouragement and will
ACKNOWLEDGEMENT
The author would like to express his sincere thanks to his supervisors Dr. Jimi Tjong and
Dr. M. Ahmadi. Their encouragement and innovative ideas enabled me to successfully
complete this thesis. The author would also wish to express his sincere appreciation to the
committee members, Dr. B. Shahrrava and Dr. D. Ting for their insight and
recommendations.
Special thanks go to the many members of the Ford Powertrain Engineering Research
and Development group for their time, assistance and support through the course of this
study. In particular, the author would like to thank Mohammed Fawzy Aly, for all the
valuable advice, assistance and insights that he provided during the study. Author would
also like to thank Tony Fountaine, Ted Murawski, Richard Koresky, Russell Ellwood,
and Greg Maxwell for their cooperation, knowledgeable insight and technical assistance
TABLE OF CONTENTS
ABSTRACT iii
DEDICATION iv
ACKNOWLEDGEMENTS v
LIST OF TABLES x
LIST OF FIGURES xi
ABBREVIATIONS xvi
CHAPTER 1: INTRODUCTION 1
1.1 Background 1
1.2 Motivation 1
1.3 Defect Detection Using NVH Indicators 5
1.3.1 Noise and Acoustic Signal 6
1.3.2 Pressure Signals 7
1.3.3Vibration Signals 8
1.4 Research Objective 11
1.5 Thesis Outline 13
CHAPTER 2: DEFECT DIAGNOSTIC METHODS 15
2.1 Data Acquisition 15
2.2 Data Reductions and Processing 16
2.3 Algorithm for diagnosis o f engine defects 16
2.3.1 Time Domain Analysis 16
2.3.1.1 Crank Angle Domain 17
2.3.1.2 Time domain averaging 19
2.3.1.3 Root Mean Square (RMS) 20
2.3.1.4 Crest Factor 21
2.3.1.5 Kurtosis 21
2.3.2 Frequency Domain Analysis 25
2.3.2.1 Fast Fourier Transform 25
2.3.2.2 Order Analysis 30
2.3.2.3 Cepstrum Analysis 32
2.3.3 Time- Frequency Analysis 33
2.3.3.1 Short Time Fourier Transform 35
2.3.3.2 Time-Frequency Distribution 36
2.3.3.3 Wavelet Analysis 37
2.3.3.3.1 Overview o f Wavelet Transform
Analysis 38
2.3.3.3.2 Continuous Wavelet Transform (CWT) 40
2.3.3.3.3 Discrete Wavelet Transform (DWT) 42
2.3.3.3.4 Wavelet Packet Analysis (WPT) 46
2.3.3.4 Applications of Wavelet Analysis in Vibration
Monitoring 48
2.5 Advantages of Wavelet Analysis over other Methods 50
2.6 Proposed Engine Fault Detection Method 52
2.7 Summary 54
Chapter 3: EXPERIMENTAL SETUP 55
3.1 Engine Test Setup 5 5
3.2 Operating Conditions 56
3.3 Acquisition Equipments 57
3.3.1 Transducers 57
3.3.1.1 Bruel & Kjaer Type 4366 Accelerometer 58
3.3.1.2 PCB Model 353B15 Accelerometer 59
3.3.2 T ransducer C alibrator 59
3.3.3 Data Acquisition System 60
3.3.3.1 Anti-aliasing F iltering 61
3.3.3.2 Signal Coupling 61
3.3.3.4 Sampling 62
3.3.4: Bruel & Kjaer Model 5974 Charge Amplifier 64
3.4 Transducer Positioning 64
3.5 Summary 67
Chapter 4: DATA ANALYSIS AND RESULTS 68
4.1 Data Processing 68
4.1.1 Transforming to Crank Angle Domain 68
4.1.1.1 Finding the Engine Speed 71
4.1.2 Resampling 72
4.1.3 Wavelet Packet Decomposition 73
4.1.3.1 Mother Wavelet 74
4.1.3.2 Level of Decomposition 77
4.1.4 Wavelet Packet Energy 78
4.2 Defect Classification 78
4.3: Engine Defects under Investigation 79
4.4 Good and Defective Engine 81
4.5 Engine Defect Vibration Signature Types 83
4.6 Engine Fault Detection System 86
4.6.1 Engine Fault Detection System Pseudo Code 89
4.7 Graphical User Interface 91
4.8: Case Studies 95
4.8.1 Case Study: Defective Right Cam Phaser 95
4.8.2 Case Study: Defective Right Chain Tensioner 99
4.8.3 Case Study: Defective Cylinder #1 Intake Lash Adjuster 103
4.8.4 Case Study: Defective Cylinder #4 Exhaust Lash Adjuster 107
4.8.5 Case Study: C ylinder #4 Bore N on-C leanup 111
4.9 Comparison o f Wavelet Analysis with Variance and STFT 114
Chapter 5: CONCLUSIONS AND RECOMMENDATIONS 123
5.1 Conclusions 123
5.2 Recommendations and Future Work 125
REFERENCES 126
APPENDICES 132
A: 5.4L 3V ENGINE SPECIFICATIONS 132
B: CELL#7 DYNAMOMETER SPECIFICATIONS 133
C: CHARGE-TYPE ACCELEROMETER SPECIFICATIONS 134
D: ICP-TYPE ACCLEROMETER SPECIFICATIONS 135
E: ACCELEROMETER CALIBRATOR SPECIFICATIONS 136
F: PROSIG ACQUISITION SYSTEM SPECIFICATIONS 137
G: 8-CHANNEL CHARGE AMPLIFIER SPECIFICATIONS 138
LIST OF TABLES
Table 3.1 Accelerometer channel naming convention 67
Table 4.1 Engine RPM calculation 71
Table 4.2: Engine defects under investigation 79
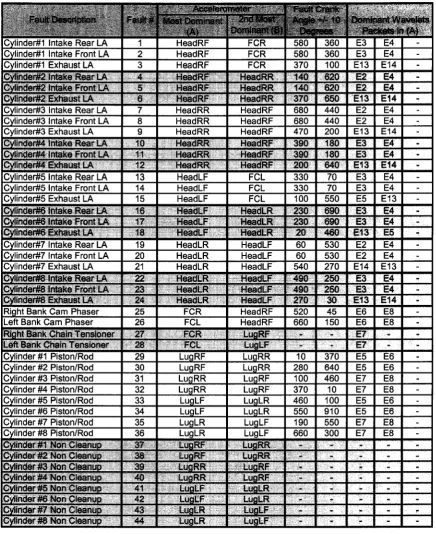
Table 4.3: Defect Description and the associated fault number 80
Table 4.4: Fault Database Table 88
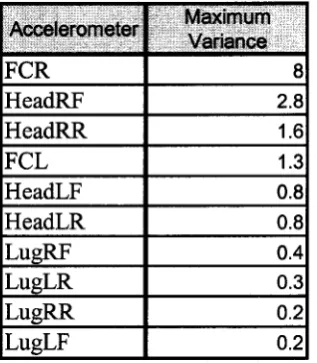
Table 4.5: Maximum variance for each accelerometer channels 95
Table 4.6: Fault parameters for defective right bank cam phaser 98
Table 4.7: Maximum variance for each accelerometer channels 99
Table 4.8: Fault parameters for defective right bank chain tensioner 102
Table 4.9: Maximum variance for each accelerometer channels 103
Table 4.10: Fault parameters for defective cylinder #1 intake lash adjuster 106
Table 4.11: Maximum variance for each accelerometer channels 107
Table 4.12: Fault parameters for defective cylinder #4 intake lash adjuster 110
Table 4.13: Piston position during engine cycle 113
Table 4.14: Fault database for cylinder non-cleanup defects 113
Table 4.15: Fault parameters for defective cylinder #1 intake and exhaust
lash adjuster 115
Table 4.16: Fault parameters for defective right bank cam phaser 117
Table 4.17: Engine Fault Detection Summary 120
Table 4.18: Modified Engine Fault Detection Summary 121
Table 4.19: Summary o f test engines and cumulative success rates 122
Table A .l: 5.4L 3V Engine Specifications 132
Table B .l: Cell#7 Dynamometer Specifications 133
Table C .l: Charge-type Accelerometer Specifications 134
Table D .l: ICP-type Accelerometer Specifications 135
Table E. 1: Accelerometer Calibrator Specifications 136
Table F. 1: PROSIG System Specifications 137
LIST OF FIGURES
Figure 2.1: Time domain average of vibration data. Period was taken to
be the time taken by the crankshaft to rotate 720 degrees
(1 engine cycle) 20
Figure 2.2: Waterfall running variance plot for 30 engine cycles. Graph
shows there is a vibration spike at 360 degrees crank angle
consistently during all engine cycle. 24
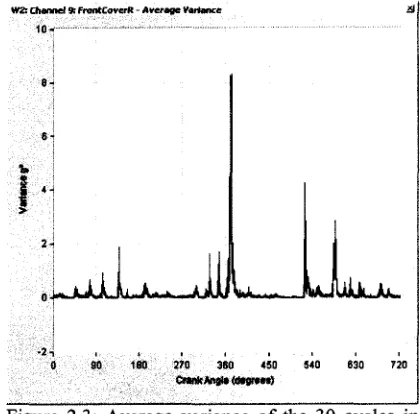
Figure 2.3: Average variance o f the 30 cycles in the crank angle domain.
Graph shows there is significant vibration spike at 360
degrees crank angle. 24
Figure 2.4: Frequency response of vibration signal for a good engine
and engine with a defective phaser. 29
Figure 2.5: Order Analysis 31
Figure 2.6: Comparison o f Time, Frequency, STFT and Wavelet domain
analysis. 39
Figure 2.7: Two-channel filter bank 43
Figure 2.8: DWT Mechanism - Filtering and Sub sampling o f signal 44
Figure 2.9: DWT decomposition tree 45
F igure 2.10: Discrete W avelet T ransform T ree 46
Figure 2.11: Wavelet Packet Transform Tree 46
Figure 3.1: Illustration of test setup. A 5.4L 3V Engine and transmission
are coupled with a dynamometer. 56
Figure 3.2: Accelerometers used for the study. PCB Model 353B15
Accelerometer (left) and Bruel & Kjaer Type 4366
Accelerometer (right) 59
Figure 3.3: Bruel & Kjaer Type 4294 Calibrator 60
Figure 3.4: The Prosig 5600 System front view. 61
Figure 3.6: Red circles show the location of accelerometers on the
right side o f engine (2 on the cylinder head lugs and 2
on the engine lugs) 66
Figure 3.7: Red circles show the location o f accelerometer on the left
side of engine (2 on the cylinder head lugs and 2 on the
engine lugs) 66
Figure 3.8: Red circles show the location o f accelerometers on the front
cover (1 on each bank) 66
Figure 4.1: CID signal (top plot) and Right Front Cover Accelerometer
(bottom) 69
Figure 4.2: CID Signal 69
Figure 4.3: CID Signal is used as a reference for the crankshaft positio 70
Figure 4.4: Using the CID signal to find the 0 degree TDC o f Cylinder #1
and transforming the time domain data into angle domain. 70
Figure 4.5: Engine RPM tracking 72
Figure 4.6: Data resampling each engine cycle to 7200 points 73
Figure 4.7: Wavelet Packet Decomposition tree representation 73
Figure 4.8: Members of the Daubechies'wavelet family (Db2 thru Db 10) 75
Figure 4.9: Impulse Response o f the Dbl5 lowpass filter 77
Figure 4.10: Impulse Response o f the Db 15 highpass filter 77
Figure 4.11: Magnitude Response o f Db 1, Db5, Db 10 and Db 15 lowpass
filters 77
Figure 4.12: Impulse Response of the Dbl5 highpass filter 77
Figure 4.13: Vibration level of good engine 81
Figure 4.14: WPD Coefficients of vibration signal from a good engine 82
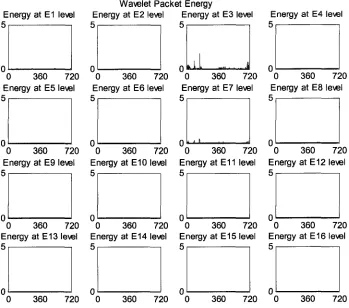
Figure 4.15: WPD packet energy o f vibration signal from a good engine 83
Figure 4.16: Single vibration spike per engine cycle. 84
Figure 4.17: Comparison o f vibration signal from a good engine (red) and
defective engine (blue) with multiple vibration spikes 85
Figure 4.18: Waterfall Variance plot for 30 engine cycles 86
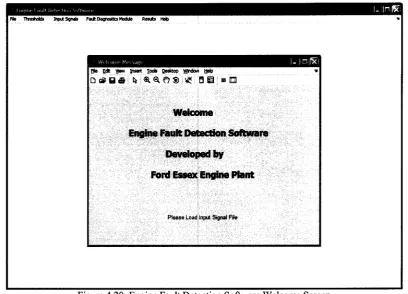
Figure 4.20: Engine Fault Detection Software Welcome Screen 91
Figure 4.21: Options under File Menu 92
Figure 4.22: Threshold Menu 92
Figure 4.23: Selecting Engine Block Lug Accelerometers 93
Figure 4.24: Selecting Cylinder Head Lug Accelerometers 93
Figure 4.25: Selecting the Front Cover Accelerometers 93
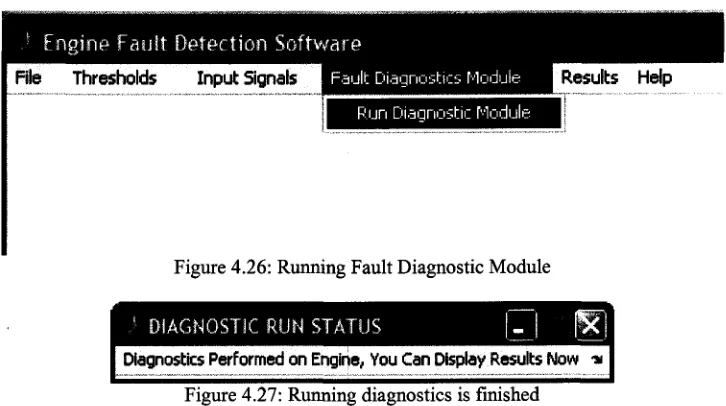
Figure 4.26: Running Fault Diagnostic Module 94
Figure 4.27: Running diagnostics is finished 94
Figure 4.28: Display results and warnings 94
Figure 4.29: Displaying message indicating that the vibration signature
recorded by the accelerometer does not match the signature
o f any known defect and vibration level is below threshold
level hence it is a good engine. 94
Figure 4.30: Displaying message indicating a fault is detected to be present
for the particular accelerometer and it matches the signature of
a known fault. The message shows the fault number along with
the fault description 94
Figure 4.31: Displaying message indicating that the energy content o f the
vibration signal recorded by the accelerometer is within limits
o f the threshold and there is no vibrations spikes are present that
is over the threshold for any crank angle. 94
Figure 4.32: Message displayed when a vibration spike is detected at crank
angle(s) or wavelet packet(s) that is not in the fault database. 94
Figure 4.33: Vibrations recorded by FCR accelerometer 96
Figure 4.34: Running variance waterfall o f FCR recorded vibrations for
40 engine cycles 96
Figure 4.35: W avelet packet coefficients 97
Figure 4.36: Wavelet packet energy 98
Figure 4.37: Vibrations recorded by FCR accelerometer 100
Figure 4.38: Running variance waterfall o f FCR recorded vibrations for
Figure 4.39: Vibration amplitudes for 1 engine cycle 101
Figure 4.40: Wavelet packet coefficients 101
Figure 4.41: Wavelet packet energy 102
Figure 4.42: Vibrations recorded by HeadRF accelerometer 104
Figure 4.43: Running variance waterfall of HeadRF recorded vibrations
for 40 engine cycles 104
Figure 4.44: Vibration amplitudes for 1 engine cycle 105
Figure 4.45: Wavelet packet coefficients 105
Figure 4.46: Wavelet packet energy 106
Figure 4.47: Vibrations recorded by HeadRR accelerometer 108
Figure 4.48: Running variance waterfall of HeadRF recorded vibrations
for 40 engine cycles 108
Figure 4.49: Wavelet packet coefficients 109
Figure 4.50: Wavelet packet energy 110
Figure 4.51: 40-Engine cycle waterfall plot for LugRR accelerometer 111
Figure 4.52: Average variance in crank angle domain 112
Figure 4.53: Defective Cylinder 1 intake Lash Adjuster. HeadRF
Accelerometer position recorded a spike at 355 degrees CA. 116
Figure 4.54: Defective Cylinder 1 exhaust Lash Adjuster. HeadRF
Accelerometer position recorded a spike at 365 degrees CA. 116
Figure 4.55: Defective Cylinder 1 intake Lash Adjuster. HeadRF
Accelerometer position recorded a variance spike at 355
degrees C A. 116
Figure 4.56: Defective Cylinder 1 exhaust Lash Adjuster. HeadRF
Accelerometer position recorded a variance spike at 365
degrees C A. 116
Figure 4.57: W avelet Packet E nergy at Level =4 116
Figure 4.58: Wavelet Packet Energy at Level =4 118
Figure 4.59: Severely defective right bank phaser. FCR accelerometer
position recorded a spike at 525 degrees CA. 118
recorded a spike at 525 degrees CA. 118
Figure 4.61: Frequency response over 1 Engine Cycle (Severely defective
and good phaser). 118
Figure 4.62: Frequency response over 1 Engine Cycle (Defective phaser
and good phaser) 118
Figure 4.63: Wavelet Packet Energy at Level =4 118
ABBREVIATIONS
A Amplitude, or cross-sectional
AC Alternating Current
ADC Analog-to-Digital Converter
BDC Bottom-Dead-Centre
CID Cylinder Indicator Signal
CWT Continuous Wavelet Transform
DC Direct Current
DWT Discrete Wavelet Transform
fs sampling frequency
FCR Front Cover Right-hand side
FCL Front Cover Left-hand side
FT Fourier Transform
FFT Fast Fourier Transform
HeadRF Engine Head Right Front Lug
HeadRR Engine Head Right Rear Lug
HeadLF Engine Head Left Front Lug
HeadLR Engine Head Left Rear Lug
i data index
ICE Internal Combustions Engine
ICP Integrated Circuit Piezoelectric
LugRR Engine Block Right Front Lug
LugRR Engine Block Right Rear Lug
LugLF Engine Block Left Front Lug
LugLR Engine Block Left Rear Lug
n total number of samples or cycles
NVH Noise, Vibration and Harshness
PERDC Powertrain Engineering Research & Development Centre
RMS Root-mean-square
RPM Revolutions Per Minute
s
SignalSAE Society of Automotive Engineers
SOHC Single Overhead Camshaft
SNR Signal-to-noise Ratio
s i f t Short-time Fourier Transform
T period of measurement
TDC Top-Dead-Centre
Vi average variance
WPD Wavelet Packet Decomposition
WPT Wavelet Packet Transform
* Complex Conjugate
CHAPTER 1
INTRODUCTION
1.1 Background
This study is concerned with the development of a vibration signature analysis method
for the early detection and diagnosis of mechanical faults in Internal Combustion Engines
(ICE). Advanced engine maintenance programs incorporate various methods for
monitoring the health of engine components, helping us to check if the engine is running
under its normal operating conditions. They also enable us to foresee any malfunctions
or abnormal operations and diagnose if any defect is present [Ben-Ari et al, 1998]. In this
document, we will first discuss briefly, existing diagnosis methods that have been
researched and explored in depth by various researchers for detecting different types of
defects in internal combustion engines using the engine’s noise, vibration and harshness
(NVH) characteristics as the primary source of parameters. We will then explore and
discuss the possibility of using a different approach with the goal of detecting new faults
in a more accurate and efficient way.
1.2 Motivation
The main goals of every manufacturer are to achieve high productivity at minimal cost,
high customer satisfaction, innovative concepts and products, and an having efficient
manufacturing and assembly process [Tjong, 1992]. In a production environment, having
an in-process testing system that is capable of detecting and diagnosing manufacturing
their assembly. Such systems play a vital role for the company as it greatly increases
productivity, customer satisfaction and help reduce scrap cost.
As such, in any modem engine-manufacturing environment, such online engines
monitoring diagnostic system are present on the assembly line. These test stations are
generally known as “cold test” and “hot test” stands. Engines are tested several times at
different stages of its assembly process at these test stations, which are usually capable of
detecting and diagnosing many manufacturing related engine defects. These in-process
test stations subject the engine to a number of rigorous tests and check for missing
components, certain machining related defects or other assembly defects. They also
provide monitoring of important parameters such as torque, oil/coolant cavity leaks,
cylinder pressure, crankshaft balance, fuel rail pressure, integrity of the engine harness
and all electronics sensors and the proper functionality of the electronic control unit. If at
any stage of the manufacturing process, an engine is diagnosed to have a fault, then it is
routed to a repair bay on the assembly line where it receives careful inspection and is
repaired if possible or is otherwise scrapped. These test stations can detect defects early
in the process, thereby reducing downtime and repair costs that would be incurred if the
engine were to be disassembled after complete assembly. It is desirable that all defects in
the engine are detected during these in-process tests. However, as good as these tests
stands may be, they are not able to detect 100% of the defects due to the fact that the
internal combustion engine is a highly complicated machine with hundreds of moving
components. Furthermore, some engine defects are detectable only after being completely
engine speed (revolutions per minute or rpm) or at specific operating engine load or oil
temperature. In addition to these different operating conditions, the defect may only show
up intermittently and may not be present at all times. Since it is not feasible to subject the
engines to all test operating conditions in a manufacturing environment, sometimes,
defective engines do get shipped out with its defect undetected.
These defective engines can then only be detected after the entire vehicle has been fully
assembled and is test-driven at the Body and Assembly (B&A) plants, at the dealership,
or following a customer complaint due to excessive noise or vibration from the engine
after the vehicle has been sold. In many of these cases, if such “noisy” engines are
identified, they are usually exchanged with a new one as per warranty and the total cost
of the engine replacement and repair easily exceeds the cost of a new engine by a few
times. Considering that a typical engine manufacturer is capable of producing roughly
500,000 engines a year, even if a small percentage of the total number of engines
produced contains some undetected defects, it can potentially cause the manufacturer to
incur high cost due to replacing these engines after the vehicles are fully assembled. Most
of these engines that are replaced due to abnormal noise or vibration have some
mechanical defects. These defects are mainly due to the presence of faulty components
that can be easily replaced, and the engine repaired, if the cause is identified correctly.
Repairing these engines usually involves partial disassembly that can be performed in
vehicle at the dealership or at the B&A plants, thereby drastically reducing the cost of the
There are several conventional ways to diagnose these engines at the B&A plants or at
the dealerships. The most common is by auditory assessment. In general, if a noise is
concentrated in a narrow bandwidth, or has a very rapid rise time or is intermittent or
irregular, it is deemed “noisier” than if it remains steady. An experienced inspector or
mechanic usually performs these assessments by listening to the sound level and
frequency variations of the abnormal engine noise to identify the mechanical defects
inside engine. Words like “tick”, “knock”, “rattle”, “whine”, “chatter”, “whistle”, “hiss”,
“clunk” are often used to describe these defects. Another method that is used in
conjunction with the auditory assessment is to isolate the noise to a particular cylinder by
disconnecting the fuel injectors or spark plugs to stop the combustion process in each
cylinder. Though these methods are often simple and fast, the judgment is subjective to
the listener and is prone to errors. Furthermore, these methods are inconsistent due to the
effect of ambient condition or the physiological state of the inspector himself. This is
especially true when the abnormal noise is on the borderline of acceptability.
Product and design engineers use a more scientific approach to diagnose these defects by
using various NVH indicators for detection. But these methods are mostly used as
experiments in a laboratory setting and not at B&A plants or dealerships. There are many
applications in industry such as monitoring of rotating machines that have repetitive
signals, which are generally periodic, where NVH characteristics are used for fault
detection. However, it is difficult to use many of these standard techniques to analyze
measurements from internal combustion engines because its signals contain both periodic
impact inside the engine. The various vibration analysis methods that are used for such
defect detection are, for example, time domain averaging, order analysis, spectral
analysis etc. The details and merits of these methods are discussed in Chapter 2. While
some of these methods are effective in detecting certain defects, they are not in cases of
others, especially the ones of interest to us in this study. As a result, more effective
techniques are required to better analyze NVH measurements and detect engine faults
more reliably. Hence there is a need to develop and implement a practical, standardized,
cost effective and non-intrusive diagnostic system that can perform diagnosis, detect and
identify any defects in these engines that have been installed in a vehicle without
complete dismantling of the engine being necessary. Such a system should not only
detect faulty engines but should also have the capability to diagnose which specific
component(s) are defective so they can be replaced and the engine repaired. It will reduce
the amount of time and effort required to manually detect the defect and will also help
maintain a constant quality standard which will ultimately lead to better quality,
increased customer satisfaction, greater sales, a better reputation and ultimately leading to
greater profit for the company.
1.3 Defect Detection Using NVH Indicators
The noise and vibration generated by a faulty engine is complex in nature. The analysis
must decompose the data in such a way that the fault recognition process can be
concentrated on those attributes of the signal that is most representative of the faults to be
of the signals. The NVH indicators that are used to detect engine defects that result from
abnormal mechanical impacts or from the combustion process are
i) Noise signals or sound pressure levels
ii) Pressure signals
iii) Vibration signals
1.3.1 Noise and Acoustic Signal
Sound measurement is one of the oldest techniques to detect machine defects. Almost
thirty years ago, Chung et al [1979] of General Motors Research Laboratories developed
a cross-spectral method of measuring sound intensity to perform a detailed mapping of
engine noise, noise source ranking and also calculate total engine sound power with
reasonable accuracy. Noise or acoustic signals are measured using microphones or sound
intensity measurement, as done by several researchers such as Tjong [Tjong, 1992],
Jonuscheit [Jonuscheit, 2000] and Leitzinger [Leitzinger, 2002]. Jonuscheit used sound
intensity measurements to determine noise sources in engines by using two overhead
microphones to measure sound pressure in a production environment [Jonuscheit, 2000].
Leitzinger performed a survey using different indicators and transducers such as
microphones, accelerometers and vibrometers to detect engine defects. Leitzinger
reported that microphones produce inconsistent results and were unable to detect defects
he investigated. He also concluded that the most reliable transducers were accelerometer
and laser doppler vibrometers [Leitzinger, 2002], The advantage of using microphone to
measure sound pressure is that it is quite easy to take and that it provides non-contact
in a suitable and controlled environment such as a semi-anechoic chamber or an
enclosure that will attenuate unwanted noise signals.
Biedl suggested quantifying the vibration of components through noise measurements
such as SAE-J1074 test. SAE-J1074 is a test using microphones that measures the noise
radiation pattern at one-meter distances surrounding the engine and is usually done in a
semi-anechoic chamber. He states SAE-J1074 was optimal in developmental work when
defining the amount of noise reduction required to meet target specifications. He
concluded that only by point-to-point acceleration measurements is the only way to
accurately describe a vibrating system [Beidl et al, 1999].
1.3.2 Pressure Signals
Pressure measurements for engines are generally taken in the vicinity of the combustion
chambers to measure in-cylinder pressure variations as done by Chandroth [Chandroth et
al, 1999 (2), (3)], and Rizzoni [Rizzoni et al, 1994]. It can also be used for measuring
pressures in the intake, exhaust manifold or oil gallery as done by Bryant [Bryant et al,
1992]. Bryant of Ford Motor Company, who hold several US patents in the area of
engine testing and diagnostics, developed a novel method where he monitored multiple
indicators such as crankcase air pressure, intake and exhaust manifold pressures, oil
pressure, torque to diagnose defects such as missing or broken components in engine. He
later successfully implemented his fault detection system in the cold test stands at the
Ford Cologne Engine Plant in Germany. In a separate study, Bruce Bryant developed
cylinders in real time. For each engine cycle the pressure signal is sampled and digitized
and fed as an input vector for a pattern classifier that then discriminates between firing
and misfiring cylinders based on the predetermined internal coefficients of a trained
classifier. Sharkey performed a study where an engine fault diagnosis system was
developed using multiple sensors such as acoustic, vibration and in-cylinder pressure
signal traces to detect leaking intake and exhaust valves and defective fuel injectors. The
signal characteristics were then fed to a trained ANN (Artificial Neural Network), which
discriminated each class of data [Sharkey et al, 2000]. In another study, Chandroth used
vibration and in-cylinder pressure signals from a diesel engine to detect engine defects
[Chandrothet al, 1999 (1), (2)].
1.3.3 Vibration Signal
Vibration analysis techniques are fairly common is industry. It is used frequently as a
fault detection and diagnostic tool to detect malfunctioning rotating machines such as
electric motors, turbines, compressors as shown by Tamaki, [Tamaki et al, 1994] and
other researchers. Vibrations produced by rotating machines are usually repetitive signals
that are more or less periodic in nature. Vibration analysis is also used as a part of
preventive maintenance programs to detect defects such as bearing failure [Heng et al,
1998], excessive wear or structural damage and to predict failures. This is done by
monitoring the changes in the levels of machine vibration. These vibration tests often
enable us to identify the faults early in the maintenance process without having to
dismantle the machine. Mitchell [Mitchell, 1981] and Eshleman [Eshleman, 1995]
vibration spectrum exhibited by the machine. They used it to identify various types of
defects in rotating machines such as bearing wear, misalignment and tolerances related
defects.
All machines vibrate because they are mechanical systems with moving components and
comprise an elastic system that oscillates in response to excitations [Ben-Ari et al, 1998].
Every machine has their specific characteristic modes of vibrations that can be
distinguished during normal operating conditions. Each of the modes is characterized by
its spectrum and a distinguished pattern of relative amplitudes that is dependent on its
mass, system stiffness, fitting tolerances, friction levels, and other parameters typical to
the system [Ben-Ari et al, 1999], When a machine malfunctions, it causes the excitation
forces to vary and thus changes its system characteristics and hence the vibration
signature of the system. This change can then be detected and distinguished from normal
conditions by using appropriate vibration monitoring and analysis method. These
vibration-monitoring techniques have been mostly applied to relatively simple rotating
machines that consist of a relatively small number of moving parts and the movement of
these components is relatively smoother. Several researchers such as Ben-Ari [Ben-Ari et
al, 1998, 1999] and Modgil [Modgil et al, 2004] for example, noted that in many cases,
there exist a direct one-to-one relationship between the cause of the defect and the
frequency content and amplitude of the vibration signature.
In recent times, these vibration analysis applications have been also applied to
machines, gearboxes [Miller, 1999], transmissions [Biqing et al, 2004] and [Turner et al,
2002], and also in a small number of applications involving internal combustions engines
as done by Tjong [Tjong, 1992,1993], Bryant [Bryant et al, 1992], Chandroth [Chandroth
et al, 1999 (1), (2)], Samimy [Samimy et al, 1996], Ghosh [Ghosh et al, 1991], Mingzan
[Mingzan et al, 2003]. The reason for the low number of industrial applications can be
attributed to the complex nature of the working principles of internal combustion engines
coupled with the fact it contains large number of moving parts. Fault detection in Internal
combustion engines often requires the understanding of the dynamic and chemical
processes taking place inside an engine, which are difficult to model accurately noted
Chandroth [Chandroth et al, 1999 (1)].
Combustion and inertial forces, in-cylinder pressure variations and mechanically induced
structural resonance are the cause of vibrations in engines [Preide], Tjong [Tjong, 1992]
categorized the generation of noise and vibration by a faulty engine into three areas
i) Impact between components due to incorrect clearance between valve
train, gears, connecting rod, pistons and bearings etc. The impact usually
results in an impulse generated vibration occurring at fixed crankshaft
angle(s).
ii) Imbalance in rotating components of the engine such as crankshaft,
camshaft (s), balance shaft, gears. This results in vibration that is harmonic
at low orders of the engine rotation.
iii) Abnormal combustion due to incorrect ignition timing, incorrect valve
Engine vibration signals are measured in the form of surface borne acceleration with
accelerometers attached on the outside of the engine as shown by Tjong [Tjong, 1992],
Leitzinger [Leitzinger, 2002], Daws, [Daws, 2002] or as velocity signals that is measured
using vibrometers such as with laser doppler vibrometers as shown by Leitzinger
[Leitzinger, 2002], Biedl studied vibrations generated by an engine by using a scanning
laser vibrometers. He concluded that the results gave a good overview of the entire
vibration behavior of an engine side but he recommended using point-to-point surface
measurements using accelerometers for accurate data. The reason being, laser performs a
non-contact measurement and the accuracy of such measurement results mainly depends
on surface reflectivity and measurement angles. Any variation of the angles and
reflectivity and would yield a skewed vibratory response [Beidl et al, 1999]. Tjong [US
Patent 5821412] found a novel method to diagnose mechanical anomalies in internal
combustion engines using vibration amplitudes at various crank angle position and
implemented it in the cold test and hot test stands in a manufacturing environment.
1.4 Research Objectives
Our main goal is to develop a system that can diagnose and identify defects in engines by
performing non-intrusive tests, so we can repair it without having the need to remove the
faulty powertrain from the vehicle. The defects under study result in abnormal
mechanical impacts in engines due to faulty components.
Sound level measurements using microphones has to be acquired in a controlled
as we aim to detect engine defects in the field. Pressure measurements are already
performed at various stages of the cold test in the manufacturing line and can help detect
missing components but can not detect all malfunctioning components in the engine. In
cylinder pressure measurements can indicate if any combustion related problems are
present but it is also impractical to carry out in the field, as it requires cylinder heads that
are instrumented with pressure transducers. Also, a majority of the studies that have been
performed in the area of engine defect detection investigates ways to detect combustion
knock in an engine as done by Thomas [Thomas et al, 1996], Molinaro [Molinaro et al,
1992, Konig, [Konig, 1996] and Rizzoni [Rizzoni et al, 1993]. Combustion knock is
caused by irregular combustion and generates pressure oscillations in the cylinder. The
placement and designs of calves, spark plugs, fuel injection ports and additive contents in
fuel are factors causing the existence of combustion knock. Detection of combustion
knock is not the focus of this study. The main interest in this project is detection of faulty
components present inside the engine using vibration characteristics of good and faulty
engines and the way in which the results are processed in order to extract the relevant
data and identify the fault. The engines we are interested in diagnosing are the ones that
have mechanical faults and have already passed through cold test stands without the fault
being caught.
Therefore, for this study, vibration is used the only indicator for detection of engine
defects. Vibration signal is directly related mechanical operations within the engine and
contain valuable information of the health of different engine valve train or combustion
and can help prevent catastrophic failures in future. For the proposed application, using
vibrometers is highly impractical due to limitation in space in the engine compartment of
the vehicle. Hence, we will use piezoelectric accelerometers to measure vibration. Also,
these vibration transducers are relatively small and a large number of them can be used if
necessary at different locations to capture localized vibration. The piezoelectric
accelerometers are the most commonly used transducer for vibration measurements
because of its relatively small size, low cost, robustness and usability over a wide
frequency range.
In order to successfully meet the objective of this study there are a number of goals that
have to be met and they are
i. Select data acquisition equipments and appropriate transducers for engine
vibration detection and also determine optimal measurement locations that exhibit
good vibration characteristics.
ii. Collect sufficient amount of data from both good engines and engines with
different types of defects.
iii. Develop a standardized test and fault diagnosis algorithm that can successfully
detect faulty components.
1.5 Thesis Outline
The remainder of this thesis is structured as follows: Chapter 2 discusses all state-of-the-
time, frequency and joint time-frequency domain techniques, and their theoretical
background.
Chapter 3 discusses the experimental setup, all test conditions, key concepts for data
acquisition, testing and data acquisition equipment used for this study and their
specifications.
Chapter 4 discusses different steps of the defect detection method, data analysis and
processing steps, implementation of the algorithm, brief overview and description of the
graphical user interface (GUI) that has been developed and test results for detection of
different engine faults and case studies.
Chapter 5 concludes the thesis and recommendations are provided for future work and
CHAPTER 2
DEFECT DIAGNOSTIC METHODS
This chapter describes the fault detection and diagnostic process and all state-of-the-art
machine fault diagnostic techniques based on time, frequency, and joint time-frequency
domain, using various NVH indicators that are currently used in the industry. The theory
behind these methods is discussed along with their various advantages and disadvantages
that each method poses. The chapter concludes with description o f the proposed method
that is used in this study to detect faulty engines as well as to identify the cause o f the
fault.
There are three main steps to the fault detection process of an internal combustion engine.
They are data acquisition, data reduction and processing and finally algorithm for
diagnosis o f defects.
2.1 Data Acquisition
The first step in the defect detection process is data collection. It involves determining
which types o f and how many sensors should be used, the measurement locations, and
type o f hardware that should be used for data acquisition. Also, we need to identify
sources o f variability in the data acquisition process and with the system and these must
2.2 Data Reductions and Processing
This is done to selectively and systematically choosing the acceptable data and to
eliminate from the measured vibration signals different kinds of noise such as mechanical
noise due to vibration, electrical noise due to improper grounding of the data acquisition
system or irregularities in the power supply, electromagnetic noise from ambient
radiation and communication waves, electronic noise in the instrumentation etc. This
process is usually based on knowledge gained by individuals directly involved with the
data acquisition.
2.3 Algorithm for diagnosis of engine defects
A variety o f data analysis techniques are available and used to detect and identifying
engine defects through the use of NVH measurements. A brief review o f many o f these
techniques is provided in the following section. Traditional techniques can be broadly
divided in to three categories: time based and frequency based and joint time-ffequency
based. Time-Frequency analyses techniques are the most recommended methods as noted
by Yen as they are suitable for analyzing non-stationary signals such as vibrations
generated by mechanical impacts [Yen et al, 1999 (1), 2000],
2.3.1 Time Domain Analysis
Time domain analysis of vibration signals is one of the simplest and cheapest fault
detection approaches. This analysis is performed usually by examining some statistical
parameters related to the time domain vibration signal. Various time domain statistical
most used ones are Standard Deviation, RMS, Crest factor and Kurtosis. Usually greater
values o f these parameters indicate presence of a fault. By comparing these statistical
parameters from vibration signal to the normal values calculated using vibrations from
“good” machines, the presence of a defect and its severity can be detected. This approach
has been widely used in detecting bearing damages. Heng [Heng et al, 1998] and Martin
[Martin et al, 2004] reported in their studies that Kurtosis, Crest factor and skew values
o f the vibration signals can be used for detection o f bearing faults at early stages in their
development. Their results confirmed that these statistical methods could be used to
identify different types o f defects present in bearings.
However, analysis o f engine noise and vibration in time domain is usually not performed,
since raw time data is difficult to comprehend and provides little or no useful
information. Therefore, in almost all cases, post processing of time domain data is
performed in order to present the data in a form that will provide more detailed
information regarding frequencies, amplitudes, crank angles etc.
2.3.1.1 Crank Angle Domain
Internal combustion engines operate in a cyclic manner hence the most common analysis
that is performed is converting the time domain signal to crank angle domain. Daws
reported that analysis of data in the crankshaft angle domain is very logical and useful
because it allows one to correlate any observed signal abnormalities with specific points
crankshaft or camshaft position is also acquired simultaneously so vibration signals can
be synchronized to engine cycle when analyzing the data.
Some typical processing methods that may be performed in time domain are time domain
averaging or calculation of the statistical parameters such as RMS noise and vibration
amplitudes [Bruel & Kjaer, 1982], Kurtosis, Crest Factor, Variance analysis etc. These
parameters can give an indication o f the noise or vibration level present based solely on
one value. Once computed, it can be compared to see if it falls within an acceptable range
and thus we can use it to discriminate between good or bad parts.
As such almost all researchers use the crank angle domain approach when analyzing
displacement or vibration data o f an engine and further post processing are usually
performed on the crank angle domain data. Alvey used crank angle domain method with
vibration measurements to detect defects in engines in a production line for cold start and
hot start tests. He successfully identified certain defects through these on-line tests by
comparing with a database of defect signatures in the angle domain [Alvey et al, 2005].
Tjong discussed and utilized this method as well and he incorporated variance analysis
method in conjunction with crank angle domain data to identify various engine faults
[Tjong et al, 1993]. Other authors such as Leitzinger also used acceleration versus crank
angle to display the vibration generating events at particular moments in the engine cycle
[Leitzinger, 2002]. Sczepanski extensively used the angle domain to display
valve-opening, closing and seating acceleration at constant and sweeping speeds [Sczepanski,
2004].
2.3.1.2 Time domain averaging
Time domain averaging is a process in which the recorded vibration signal in ensemble
averaged over the rotational period of interest. After a large under o f averages are taken,
the resulting signal becomes nearly periodic. If the raw vibration signal is represented as
a continuous signal s(t), then the linear averaging operation in given by Equation 2-1
where T is the rotational period and N is the number of averages.
This technique is effective in suppressing signals that are not periodic within the
averaging period and it helps reducing noise in the signal. This method can be used for
detection o f faults that occur consistently at a certain instance o f the engine cycle.
Internal combustion engines operation on a cyclical basis, therefore, all of the events that
occur can be matched to a position in the cycle. However, there are several drawbacks for
this method. First, it is not effective in the detection o f semi periodic process. Second,
good noise reduction requires many averages and long signal lengths. Also, any
variability in shaft speed will require a variable sampling rate. Therefore, these time
domain methods posses only minimal diagnostic capabilities needed for identifying
engine defects.
V W : t l i a m t « Lf ' I : I r o u t ( o v c r P < y< U* l>«tl <a A v r r < t < j r 1 -f
£3
-1 .54
0 9 0 1 8 0 2 7 0 3 6 0 4 5 0 5 4 0 6 3 0 7 2 0 Crank AngJe (degress)
Figure 2.1: Time domain average o f vibration data. Period was taken to be the time taken by the crankshaft to rotate 720 degrees (1 engine cycle).
2.3.1.3 Root Mean Square (RMS)
The simplest approach to measuring defects in the time domain is using the root-mean-
square (RMS) approach, which provides a measure o f the power content in the vibration
signature. The RMS of a signal x, can be defined as
N= Total number of data samples
Monitoring the RMS o f the vibration in time domain is most widely practiced defect
diagnostic method being used in the industry. It is simple to implement and the results are
easy to interpret. It is mostly used in monitoring of simple machines and machine
components. The RMS value is usually compared to a pre-determined threshold and if it
(2-2)
where xrms =signal RMS value
exceeds the threshold, it is an indication of presence of a defect. However, since it
generates a single valued number, it can only indicate whether the machine or the
component being monitored is good or bad and provides no information about signal
characteristics that may indicate specific defects.
2.3.1.4 Crest Factor
The Crest Factor of a waveform is defined as the ratio of the peak amplitude o f the input
signal to its RMS level. Hence it is a dimensionless quantity.
CrestFactor = peak-
n-3)
Xrms
Modgil used crest factor as one o f the statistical indicator for vibration diagnostics of
engines and reported that the crest factor value should lie between 2 and 6. He found that
a value greater than 6 indicates that the data exhibits significant non sinusoidal signal
content [Modgil et al, 2004].
2.3.1.5 Kurtosis
Kurtosis is another statistical indicator that is widely when performing vibration analysis
in time domain. Kurtosis is a measure o f the "peakedness" in the data and emphasizes
high amplitude deviation in the signal from the normal level. The definition o f Kurtosis
(K) is
K
=where, x is the signal
( [ x ( t ) - j u x]4dt
/4 = signal mean
T = duration of the signal
cr = signal standard deviation
A perfect random vibration has a kurtosis value of 3 whereas a vibration signal with
kurtosis value of greater than 3 implies the signal has peaks. Higher kurtosis means more
o f the variance is due to infrequent extreme deviations, as opposed to frequent modestly
sized deviations. Using kurtosis of the vibration signal data in time domain has been
widely used for defect detection purposes. Martin showed that it could be used in bearing
fault detection with great success [Martin, 1995]. Calculating the kurtosis value very
useful in detecting faults when the impacts are only intermittent but it cannot provide
diagnostic information about specific faults when the machine and its vibration signature
is complex.
2.3.1.6 Variance
This is a statistical method that is commonly used in conjunction with the crank angle
domain analysis when analyzing vibration signatures for internal combustion engines.
Leitzinger [Leitzinger, 2002] and Tjong [Tjong, 1992, 1993] showed that the calculations
for variance analysis can be represented by three mathematical steps as shown below:
1. Calculating the Ensemble Average which is the average o f the amplitudes at each
crankshaft angle and can be represented by Equation 2-5 as shown below:
— 1 N
x, = — Y x n (2-5)
N j ^ J'‘
n = total number o f cycles,
xjj = the amplitude of the zth cycle a t / h crank angle, as j goes from 0 to 720°.
2. Calculate Running Variance (RV) represented by Equation 2-6
R F ., = ( * ,.,-x ,.)2
tVi
Where: RVjj - running variance o f the i cycle at crank angle j .
3. Average Variance V; can then be represented by Equation 2-7:
(2-6)
(2-7)
Where: F, = average variance.
Variance analysis is a useful tool for extracting semi-periodic components from a set of
data. This type o f analysis is useful in attenuating amplitudes of normal occurring data
values to a low level in order to better observe and exaggerate the semi-periodic
component o f the signal. As well, since the variance process squares all data, all values
are positive which makes developing the diagnostic algorithm easier.
This analysis is best used in the angle domain where the vibrating phenomenon is
consistently repeated over every engine revolution and can be related to a particular
crankshaft angle. The variance analysis has also been shown to be accurate in
representing the phenomenon that repeats semi-periodically during engine cycles. These
semi-periodic amplitudes may be attenuated over many averaged cycles; however,
through variance analysis these amplitudes are effectively maintained. Figure 2.2 and
defective engine respectively. There is a vibration spike of varying magnitude is
occurring at a cmak angle of around 360 degrees consistently for all engine cycles.
0 90 180 270 380 450 540 830 720 810 900
C rankA ngte «tog rt* « )
W2: Channel 9s FnmtCoverR - Average Variance
A j i i l wuUJJLAjl.
270 380 450
Crank (dtoracs)
540 630 720
Figure 2.2: Waterfall running variance plot for 30 Figure 2.3: Average variance o f the 30 cycles in
engine cycles. Graph shows there is a vibration spike the crank angle domain. Graph shows there is
at 360 degrees crank angle consistently during all significant vibration spike at 360 degrees crank
engine cycle. angle.
Tjong has used this method extensively and showed that engine defects can be detected
using the variance analysis. Due to cyclic operation o f an internal combustion engine,
vibration spikes should occur at relatively constant crankshaft positions from cycle to
cycle. Moreover, where they occur and how many times per cycle can determine to which
cylinder the defect is related to and further possibly identifying the nature of the fault
itself [Tjong, 1992]. Using this method we can find out at what crank angle (engine cycle
location) the vibration impulse is occurring and then relate it to a particular event in its
cycle. The main drawback for this, using this method we can only narrow down the
2.3.2 Frequency Domain Analysis
Frequency based methods are also popular techniques for analyzing the vibration signals.
Most times machine defects are characterized by certain impulses that occur at particular
frequencies or have components at known harmonics. Hence, an effective diagnosis
method is to analyze the vibration signals in its frequency domain. Usually, a baseline
level is first created that represent the normal operating conditions. Then any abnormal
conditions in machines are then diagnosed by monitoring the trend and by comparing to
the baseline data. We can calculate the dominant frequencies or orders associated with
the machine fault and use it for defect identification. This method has been used
successfully for most cases of machinery diagnostics.
There are several frequency domain analysis techniques that are widely used in the area
o f vibration analysis of rotational machines, such as the
i. Discrete Fourier Transform (DFT) or more commonly the Fast Fourier
Transform (FFT)
ii. Order domain analysis
iii. Cepstrum analysis
2.3.2.1 Fast Fourier Transform
Fast Fourier Transform (FFT) is possibly the most widely used signal analysis technique,
used in the industry for data analysis. This approach is used based on the notion that the
machine condition. Therefore, instead o f analyzing vibration directly in the time domain,
the FFT o f the vibration signal is analyzed.
Fourier transform decomposes a time based signal into a complex exponential functions
o f different frequencies and can be represented by Equation 2-8 in its continuous form.
where t stands for tim e ,/fo r frequency, x(t) the signal in time domain and X(f) the signal
in frequency domain. The inverse of the transform is given by Equation 2-9.
This analysis is based on the notion that any regular periodic function and certain non
periodic functions with finite integral can be expressed as a sum of trigonometric
functions in an infinite time framework [Boggess and Narcowich, 2001]. In Equation 2-8,
cos(27tft)+jsin(2nft) i.e. a sine and cosine term o f frequency/ and then integrating over all
times. The value of X(f) depends on whether or not x(t) has a dominant frequency
component at frequency / If x(t) contains a dominant frequency f then X(f) will be large
and if it does not contain frequency f then X(f) will be zero. Since the integration is from
minus infinity to plus infinity, it does not matter where in time the component with
frequency/appeared and hence it does not impact the result of the integration. Thus, as
Politis notes, the Fourier transform gives a unique representation of the signal in the
frequency domain and provides information about which frequencies appear in the signal
but not about the time instants in which these frequencies are encountered [Politis 2003].
X ( f ) =
f
x ( t ) e ~ 1J* ‘ d tJ-c C (2-8)
(2-9)
The most useful form o f the transform when used with real, digitally sampled data is the
Discrete Fourier Transform. It essentially replaces the integral transform with a finite
version. Equations 2-10 and 2-11 can represent the forward and inverse transform
respectively.
i V-l .Ijfai
G (k ) = - T iY u S { n ) e J N (2.io )
N n= 0
/ y _ l .2 n k n
g { n ) = Y J G ( k ) e N (2. n )
*=0
The calculation of DFT involves computation of a large number o f complex
multiplications in order to generate a useful frequency spectrum. This is a
computationally exhaustive process and often not practical when performing real time
analysis. For this reason, an algorithm has been developed, known as the Fast Fourier
Transform (FFT), which that performs an efficient or fast implementation o f the DFT by
greatly reducing the number o f computations. FFT is widely employed in signal
processing and related fields to analyze the frequencies and used in a wide variety of
applications, from digital signal processing to solving partial differential equations to
algorithms for quickly multiplying large integers.
Taking the FFT of the signal gives us the spectrum in the frequency domain. The
spectrum presents information indicating the level o f the vibration at particular
frequencies. Thus all major frequency components and their amplitudes can be identified
and be used for trending and fault detection purposes. The frequency identifies the source
machine components, the vibration spectrum peaks at the defect frequency and its
harmonics that is associated with the faulty element. As the severity o f the damage
increases, the corresponding amplitudes o f the peaks in the power spectrum increase.
Often times, the Auto Power Spectrum is used to identify key frequency components in
the spectrum. Auto Power Spectrum is computed as shown in Equation 2-12
A u to P o w erS p ectru rrix ) = F F T (x )F F T (a;) (2-12)
n
where x is the input time-domain signal and n is the number of points in the signal.
Fourier has been used extensively in vibration analysis to detect machine defect. Siedlitz
used the frequency domain to distinguish between resonant and non-resonant motion in
machines. However he concluded that in order to use Fourier transform with vibration
signal, the event must be periodic [Siedlitz, 1990]. Ghosh have used this method to detect
combustion knock in internal combustion engines [Ghosh et al, 1991]. Boubal mentions
combustion knock induces resonance as stationary waves that have fundamental
frequencies around 6 kHz. This frequency is depended on geometry o f the combustion
chamber. He recommends high pass filtering the signal with a cut off frequency o f 5 kHz
to eliminate all frequency components below because they derive from noise related to
the working of the engine and not related to combustion knock [Boubal 2000].
This method works great when used in applications involving simple machines such as
detecting faulty bearing as done by Staszewski [Staszewski et al, 1999] and by Eren
[Eren et al, 2002], or to detect broken rotor bar etc as shown by Yazici [Yazici et al,
signal to noise ratio is low and the vibration spectrum has a large number of frequency
components due to complexity of the system.
Nurhadi investigated the correlation between the vibrations measured by accelerometers
mounted on an engine with engine components being the source for the excitations. The
engine was motored by an electric motor with its spark plug removed cancelled
compression and combustion. Such a setup removed a lot o f unwanted frequencies from
the data [Nurhadi et al, 1993]. Suh investigated valvetrain dynamics o f an engine and
concluded that the standard Fourier transform was not well suited for such applications as
it was non-stationary response. He recommended using other techniques such as Wavelet
transform, Wigner-Ville Distribution and Short-Time Fourier Transform (STFT) instead.
This transform is suitable for analyzing stationary signals and not a suitable tool for the
analysis o f non-stationary signals such as vibration signatures generated by mechanical
faults in an engine as it mostly consists o f transients [Suh, 2002].
0.02
0.018
0.016
0.014
0.012
Q) 1 0.01ro
cs 2 0.008
0.006
0.004
0.002
0
0 3000 6000 9000 12000
Frequency (Hz)
Figure 2.4: Frequency response o f vibration signal for an engine with
Frequency R e sp o n se over 1 Engine Cycle
1 |
Figure 2.4 shows the plot o f FFT o f a good and defective engine over 1 engine cycle.
While difference may be observed in the case of extremely severe case o f defective
engines, no obvious difference can be seen in the frequency representation o f the two
signals for this case. Hence more intense frequency domain analysis has to be pursued in
order to discover the independent frequency content of each defective valvetrain
components. Also, this analysis does not provide us with any time-related data. Without
a time-relation the physical meaning of the frequency results would still be insignificant
when analyzing vibration signals generated by an engine.
2.3.2.2 Order Analysis
Another frequency domain analysis technique that is also often performed on vibration
data acquired from rotational machines is the Order Tracking Analysis. An NVH order is
a sinusoidal phenomenon at a frequency that is a fixed multiple of the rotation speed of
the rotating source producing the phenomenon [Ford: Basic Order Tracking for NVH,
2003]. These phenomena are usually described by
a) Order number
b) Type o f phenomena such as force, displacement or pressure etc.
c) The rotating source such as tire, engine or fan etc.
For example, a 3rd order tire force variation is a sinusoidal force at three times the
rotation frequency o f the tire producing the force. In the case of engine, orders are
referenced to crankshaft rotation speed. Thus a 2nd order engine phenomena means that it
occurs at twice the crankshaft rotation frequency. The main difference between order