http://dx.doi.org/10.4236/jgis.2013.56055
Geospatial Modeling for Sinkholes Hazard Map Based on
GIS & RS Data
Omar Al-Kouri1, A’kif Al-Fugara2*, Samih Al-Rawashdeh3, Balqies Sadoun3, Biswajeet Pradhan4
1Department of Human Sciences and Technology, Community College, Taibah University, Medina, Kingdom of Saudi Arabia 2Surveying Engineering Department, Faculty of Engineering, Al al-Bayt University, Mafraq, Jordan
3Surveying and Geomatics Engineering, Faculty of Engineering, Salt, Jordan
4Department of Civil Engineering, Faculty of Engineering, University Putra Malaysia, Serdang, Malaysia
Email: [email protected], *[email protected], [email protected], [email protected]
Received August 6, 2013; revised September 6, 2013; accepted September 13,2013
Copyright © 2013 Omar Al-Kouri et al. This is an open access article distributed under the Creative Commons Attribution License, which permits unrestricted use, distribution, and reproduction in any medium, provided the original work is properly cited.
ABSTRACT
The Kinta Valley is an area of karst in the north-western part of Peninsular Malaysia. Over 30 years of uncontrolled land use and development has led to significant changes in topography and geomorphology, such as the appearance of sinkholes. In this paper, geospatial techniques were utilized to the task of evaluating sinkholes susceptibility map using a spatial multi criteria evaluation approach (SMCE). Sinkhole location and a spatial database were applied to calculate eight inherent causative factors for limestone instability namely: lithology, structure (lineament), soil cover, slope, land use mining, urban area features, ponds and rivers. The preparation of the sinkhole geohazard map involved summing the weighted values for each hazard element, which permits the construction of geohazard model; the results of the analysis were validated using the previous actual sinkholes locations in the study area. The spatial distribution of sink-holes occurrence, urban development, faults distribution and ex-mining ponds are factors that are directly responsible for all sinkholes subsidence hazards. Further, the resulting geo-hazard map shows that 93% of recent sinkholes occur in areas where the model flags as “high” and “very high” potential hazard, located in the urbanized part of the valley, while less-developed areas to the west and southwest suffered less sinkhole development. The results can be used for hazard prevention and land-use planning.
Keywords: Geo-Hazard Mapping; Karst; Sinkholes; Geospatial Modeling
1. Introduction
Urban development is rapidly occurring in the karstic terrain of the Kinta Valley, Malaysia. Sinkholes are an inherent feature of the landscape; they present hazards and engineering challenges to the development of infra-structure. Sinkhole hazard is common in limestone karst, associated with subcircular surface depression or col-lapse structure formed by the colcol-lapse of small subterra-nean karst cavities [1-3]. The annual sinkhole hazard potential in a given area may be estimated using Equa-tion (1):
R
H E V (1)where R is the potential hazard, expressed in terms of victims per year or financial losses per year; H is the hazard; E is the exposure or elements at potential hazard,
referring to the population and the economic value of the properties and activities that may be affected by sink-holes; and V is the vulnerability, given by the unitary fraction of the exposure that is expected to be damaged if affected by a sinkhole. The total annual potential hazard corresponds to the sum of the estimated potential hazard for each exposed human element. Preferably, the hazard should include two components: the probability of sink-hole occurrence and the expected severity of the future sinkholes [4].
map was used to evaluate applications for sinkhole haz-ard prediction, and was further extended to construct sinkhole-risk models used in sinkhole risk assessment due to the lack of data coverage. “Reference [7]” studied the phenomena of sinkholes along the eastern part of the Dead Sea using 2D multi electrodes resistivity imagining that a lot of recent sinkholes were interpreted.
The environmental conditions most commonly thought to control sinkhole morphometry are the underlying ge-ology, including bedrock, fractures and faults, soil depth to bedrock, and local hydrology [8,9]. There is a need to develop a more detailed karst map by identifying and ranking factors that control the morphometry of mapped sinkhole formations. Spatial technology has been used intensively to study and map aspects of karst areas. “Reference [10]” studied the environmental impact of sinkholes in Dead Sea area. “Reference [11]” constructed a sinkhole probability map based on various parameters such as sinkhole distribution, bedrock geology, depth to bedrock, and nearest-neighbor analysis. “Reference [12]” suggested that sinkhole clustering occurs because such zones had similar geologic and topographic characteris-tics favoring sinkholes formation. Various mapping tech- niques that had been applied to the study of landslides had been modified for the study of sinkhole development [13].
As a natural phenomenon, the occurrence of sinkhole is controlled basically by geological conditions, mor-phological conditions, land cover conditions, etc. The sinkhole susceptibility analysis can give a clue of the dangerous degree by site. In this context, space borne satellite images have been largely used in the environ-mental related studies [14-16]. Karst terrain is very dif-ficult to map. Sinkholes are the most common karst fea-tures mapped because they are an indicator of bedrock dissolution, and they can be recognized on topographic maps or through remote sensing techniques [5]. “Refer-ence [17]” located sinkholes through stereoscopic view-ing of panchromatic aerial photography and plotted them on 1:24,000 scale topographic maps. “Reference [17]” primarily relied on these remote sensing techniques, but also performed some field check where sinkhole loca-tions were questionable.
The use of a GIS permits the integration of the data from various sources and on different topics more accu-rately and faster than the traditional analytical methods. GIS applications enable researchers to objectively iden-tify the conditions that trigger karst hazards. However, karst formations develop in very specific ways that are influenced by the unique local conditions of the area [18]. Local climate, geology, and urban development all affect the evolution of karst formations [19]. This study dem-onstrates the utility of computer visualization and geo-graphic information system (GIS) software to develop a
more detailed karst map for Kinta valley region to assist in future planning initiatives.
2. Study Area Location
The Kinta Valley is located approximately at latitude
4.60˚N, longitude 101.07˚E, lies to the west of the Main
Range of the Peninsular Malaysia, and east of the
Kle-dang Range, in the state of Perak, Malaysia (Figure 1). It
is under laid by limestone of Devonian to Permian age. The topography reflects typical mature tropical karst with scattered steep-sided limestone hills protruding through-out the flat-lying valley. Only abthrough-out 23% of the lime-stone occurs as hills, while the rest is an over laid by the alluvium [20]. Since it is sandwiched between two gran-itic highlands, so it provides 1) constant water supply, 2) lowland, scattered wet areas?, 3) swampy areas. Swampy areas are believed to be a factor of high rate of karstifica-tion.
3. Materials and Methodology Used
3.1. Data Collection and Analysis ConceptThe data used in this study comprise of remotely sensed imageries and relevant ancillary data. The imageries ac-quired by SPOT 5 and LandSat 5 satellites over the study area, were collected from the Malaysian Centre for Re-mote Sensing (MACRES); Spot5 images on March 27, 2005 while LandSat 5 images in 2000. Aerial photogra-phy of the study area and its surrounding, acquired in 1981 and 2004, were collected from the Department of Survey and Mapping (JUPEM). The images provided information on karst surface features and facilitated the process of field investigations, especially when identify-ing surface features across large landscapes. Soil and land use maps (2000) of the study area were provided by the Department of Agriculture, Malaysia. The spatial data were geo-coded to conform to the Malaysian Recti-fied Skew Orthomorphic (RSO) projection and then con-verted to GIS format for multi-criteria analysis.
3.2. Data Pre-Processing
Prior to implementation of the automatic edge detection processing to map lineaments, SPOT 5 and Landsat TM data were enhanced and then geometrically corrected. Geometric errors were corrected using sensor character-istics and ephemeris data include scan skew, mirror-scan velocity variance, panoramic distortion, platform velocity, and perspective geometry. Visual screen digitizing of lineaments were done after performing proper image enhancements using the appropriate filters.
3.3. Image Enhancement
330000.0000 00
330000.0000 00
335000.000 000
335000.000 000
340000.00 0000
340000.00 0000
345000.0 00000
345000.0 00000
350000.00000 0
350000.00000 0
355000.0000 00
355000.0000 00
47
7
0
00
.000
0
00
4770
0
0
.000
00
0
484
000
.0
00
00
0
4840
00
.0
00
00
0
491
000
.0
00
00
0
49
10
00
.0
00
00
0
498
00
0
.0
00
00
0
4980
00
.0
00
00
0
505
000
.0
00
00
0
5
050
00
.0
00
00
0
/
[image:3.595.66.279.84.374.2]4,100 Kilometers
Figure 1. Location map of the study area.
best representation of the initial scene for clear visual presentation of the image and so improve its information content to the interpreter.
3.4. Lineament Visual Extraction
A reference map is required to validate the accuracy of the discontinuity map produced by automatic edge detec-tion algorithms. In addidetec-tion, to detect the non-geological lineaments such as roads with human eye [21]. Prior to image smoothing, the noise was eliminated by using an average low pass filter. Later, manual lineament extrac-tion was performed. In this process, direcextrac-tional filtering method was applied for the lineament extraction. Direc-tional nature method of Sobel kernels was applied on band 4 and this has generated an effective and faster way to evaluate lineaments in four principal directions [22].
3.5. Digital Terrain Model (DTM) Generation
DTM were derived using the SOCET TEM generation software from stereo-pairs of both Black-White and color scanned aerial photo. Image-matching techniques were used to locate conjugate points in the images and then determine the heights based on the image orientation data. The DTMs were generated for all areas of mining at a spatial resolution of 0.85 m. Given the reliability of the GCPs used, an accuracy of 99% in relative height differ-ences in stereo models was achieved. Ortho-images were then generated from the orientated Black-White and
[image:3.595.310.538.533.708.2]col-our images and the DTMs resampled at ground distance of 0.85 m to annotated grid spacing of 30 m as shown in
Figure 2.
Once the TINs were created, their surface area charac-teristics were determined using ARC GIS 3D Analyst extension. The two first-order derivatives of elevation
(slope measured in degrees, ranging from 0˚ to 90˚) and
aspect measured in compass bearings, from 0˚ to 360˚
were easily calculated from the DTM in ArcGIS using the Spatial Analyst extension.
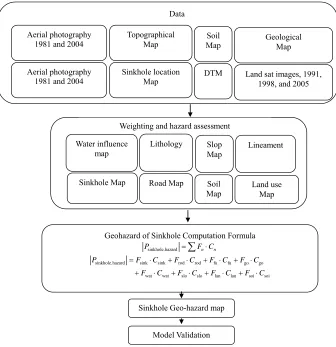
3.6. Geo-Hazard Map Generation Method
The production of sinkhole geohazard map requires summing the weightage of each hazard element. The preparation of the sinkhole geohazard map involved summing the weighted values for each hazard element, which permits the construction of: geohazard model. For this, the calculated and extracted factors were mapped into a 10 m × 10 m grid in ARC/INFO GRID format. Next, using the weights-of-evidence method, spatial rela-tionships between the landslide location and each of the landslide-related factors, soil distribution, the trends of major faults, sinkhole density, lithology, distribution of ponds and streams, main roads and highways and the distribution of slopes were analyzed. These themes were rastrized into GIS environment and supplied with weighted average.
The spatial relationships were used as each factor’s rating in the overlay analysis. Subsequently, tests of con-ditional independence were performed for the selection of the factors to be used in landslide susceptibility map-ping. The factors’ ratings were summed to calculate a sinkhole susceptibility index, and sinkhole susceptibility was mapped for 8 combinations of the factors. Finally, the results of a comparison of the 8 different combina-tions were validated using sinkhole test location data.
The contributed factors and their influence coefficients of
sinkhole occurrence are tabulated in Table 1. As
follow-ing:
tors have different influence. Thus, each factor Fn have a
coefficient Cn that determine the influence level on
sink-hole geo-hazard map. Therefore, the total contributed factors with it’s’ influence coefficients of sinkhole geo-
hazard map for each pixel, (Psinkhole.hazard ) is expressed as
follows: Geospatial data can be presented either in raster or
vector form. We have chosen to develop the sinkhole geo-hazard model as a raster model, because they are easier to manipulate and process. The calculation and determination of the sinkhole hazard map depend on the geospatial data presentation model (raster or vector) of its factors. The difference of these factors data model requires unification. Between the raster model and vector model, the raster data model are easy to manipulate and process compared with vector models. Thus, the output data model of the sinkhole geohazard map. The
calcula-tion unit of the raster data model is pixel (P); where the
pixel presents, in reality, a metric square. Each
contrib-uted hazard factor (F) is expressed in matrix of pixels
that present the raster model of that factor. Depending on
the number of the factors (n), the total contributed factors
in geo-hazards map are
Fn; for each pixel of thesinkhole geo-hazard map. However, the contributed fac-
sinkhole.hazard n n
P
F C (2)where P = final value of the pixel on the model;
Fn = value for that pixel of hazard factor n;
Cn = influence level coefficient associated with Fn.
Each hazard element is assigned a weight and the pres-ence or abspres-ence of the hazard element within the cell
determines if that weight is added to the sum (Figure 3).
We utilized the Model Builder in ArcGIS (Figure 4) to
[image:4.595.57.536.370.734.2]house the model. While the weighted sums are calculated as floating point variables, they were binned into ranges when inserted into the model’s grid. These ranges repre-sent ranks, and each rank is given an integer value. The higher values represent higher hazard levels. Each type of hazard will therefore have several rakes, depending on
Table 1. Weighting of controlling factors influence of hazard map.
Raster data type and it main classes Weighting Raster data type and it main classes Weighting
1) Sinkhole diameter 5) Water influence density map
0 - 2 1 Ponds 3
2 - 5 2 Rivers 3
5 - 10 3
>10 4
2) Road density map 6) soil type
Cross roads 1 Serdang-Kedah 1
T-junction 2 Holyrood-Lunas 2
Main road 3 Mined land 3
Urban area 4 Urban land 4
3)Avarage slope anagle 7) Geological map
>10 1 Sandstone and limestone… act 2
10 - 25 2 Schist, salt with limestone 3
26 - 50 3 Limestone/marble 4
>50 4
4) Landuse vulnerability to sinkholes 8) Faults density map
Forest 1 Discountiued faults 1
Agriculture 2 Faults cross roads 2
Mining area 3 Faults cross water bodies. 3
Weighting and hazard assessment
Geohazard of Sinkhole Computation Formula
sinkhole.hazard n n
P F C
sinkhole.hazard sink sink rod rod fu fu go go
wat wat slo slo lan lan soi soi
P F C F C F C F C
F C F C F C F C
Sinkhole Geo-hazard map
Model Validation DTM Topographical
Map Geological Map
Sinkhole location
Map Land sat images, 1991, 1998, and 2005 Soil
Map Aerial photography
1981 and 2004
Aerial photography 1981 and 2004
Data
Slop Map
Road Map Water influence
map Lithology
Sinkhole Map
Lineament
Land use Map Soil
[image:5.595.130.466.84.431.2]Map
Figure 3. Components of the sinkhole susceptibility method.
the specifics of that hazard type. For example, slopes are divided into four ranks; those with the lowest gradients have the value of “1”, and the highest gradients have the value “4”. The model was built by making criteria tree, where the conditioning parameter maps are grouped, standardized and weighted.
4. Results and Analysis
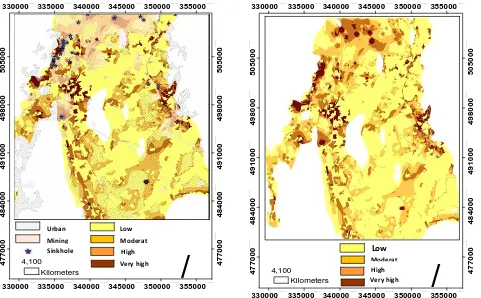
4.1. Geo-Hazard Map in the Kinta Valley
The most important factor of the geo-hazard map con-struction is the spatial distribution of sinkholes rence. Investigation on the history of sinkholes occur-rence, urban development, faults distribution and ex mining ponds are factors that are directly responsible on all sinkholes and land subsidence hazards. Most of sink-holes concentrated on the northwest across the urban areas and west along the granite-limestone contact as well as the area further south of Kinta Valley as shown
Figure 5. The waste chemical ponds of ex-mining, the
main streams, the vibration and noise of high ways roads that cross the hazards area are the possible factors found to indicate the highest number of sinkholes occurrence.
Surface mining and sinkholes occurred in the past and will be developed in the future. The south and southwest of the study area is characterized by low slope rate
vary-ing from 0˚ to 10˚. This indicates slow ground water
movement and probable low erosion (dissolution) in the limestone and more stability except in the locations of ex-mining.
Geological lineaments in terms of faults, joints and fractures, slope variation of limestone, sinkholes inten-sity, water table variation and urban distribution are sig-nificant parameters for the construction and the scoring of each location in geo-hazard map. The classification and the zoning of geo-hazard maps could be used as geotechnical reference for geologist and geotechnical engineers to identify the crucial location of high karst and dissolution rate as well as the buried sinkholes that could lead to unpredictable earth surface collapse.
Geo-hazard map has a vital role of sinkholes studies and management especially in area under laid of very sensitive carbonate rocks such as limestone and dolomite (Figure 5). In addition, it exposed to extreme high
inten-sive urbanization and ex-mining activities. Figure 6
Fault density map Road density map Geological map density map Slope map Geohazard Sinkhole density Land use Vurnability to sinkhole map Soil map Water influence density map Sinkhole density map Extent
boundary Weighted sum = ∑F
[image:6.595.125.474.76.385.2]n.Cn
Figure 4. A GIS-geoprocessing model for geohazard sinkhole map.
/
4,100 Kilometers 330000.000000 330000.000000 335000.000000 335000.000000 340000.000000 340000.000000 345000.000000 345000.000000 350000.000000 350000.000000 355000.000000 355000.000000 477 0 00 .0 00 00 0 477 0 00 .0 00 00 0 4 84000 .0 0 0 00 0 4 84000 .0 0 0 00 0 4 910 0 0 .000000 4 910 0 0 .000000 49 80 00 .0 00000 49 80 00 .0 00000 505 0 00 .0 00 0 00 505 0 00 .0 00 0 00 High ModeratVery high
Low
Urban
Mining
Sinkhole
Figure 5. The overlay of mining and urban areas to form a geo-hazard map for the Kinta Valley.
/
4,100
Kilometers
330000.000 000
330000.000 000
335000.0000 00
335000.0000 00
340000.000 000
340000.000 000
345000. 00000 0
345000. 00000 0
350000.00 0000
350000.00 0000
355000.0000 00
355000.0000 00
47 7 0 00 .000 000 47 7 0 00 .000 0 00 4 8 40 00 .0 00 000 48 40 00 .0 000 00 49 1 0 00 .000 00 0 49 1 0 00 .0000 0 0 49 8 0 00 .000 0 00 49 80 00 .0000 00 50 5 0 00 .000 000 50 5 0 00 .000 0 00 High Moderat Very high
[image:6.595.62.543.416.714.2]Low
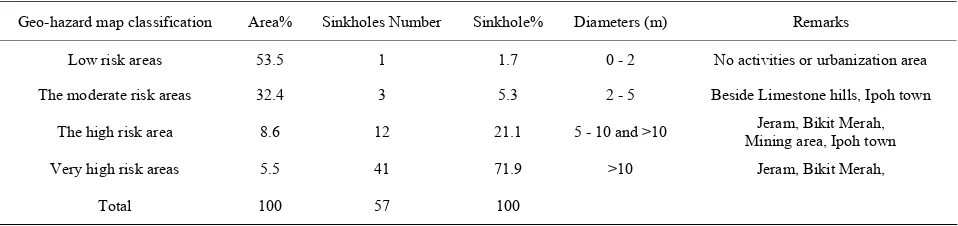
[image:6.595.296.538.416.720.2]on contributed factors and hazards densities maps. This map was classified into four categories:
4.1.1. Low Potential Hazard Areas
There is only one sinkhole observed on the map having low probability for sinkhole development. The low po-tential hazard areas characterized of low slope varying
from 0˚ to 10˚, less of human, less streams, mining/ex-
mining and agriculture activities. These areas actually extend from east to further south of Kinta Valley. One
sinkhole recorded in these areas during last decades (
Ta-ble 2).
4.1.2. Moderate Potential Hazard Areas
Containing only widely scattered individual sinkholes or isolated clusters of two or three sinkholes, these areas have moderate probability to sinkholes, earth subsidence/ collapse and even rock failure occurrence. These
how-ever, specified of low slope varies between 0˚ to 10˚,
quite number of streams and moderate urban develop-ment distributed in the north such as Ipoh city and south. This class covers most of the study area of weighted av-erage of sinkholes. These areas beside the low potential hazard areas could be recommended from authorities for further small buildings, planimetric elements and agri-culture.
4.1.3. High Potential Hazard Area
The high potential hazard areas which include steep
slope varies from 10˚ to 20˚, intense streams, high
den-sity fractures, high urbanization and ex mining activities as well as ponds and lakes distribution. These areas lie adjacent to granite ridges in the East-West and North of Kinta Valley. It shows many sinkholes and earth subsi-dence throughout the last two decades.
The high ways noise and vibrations in conjunction with streams/ponds distributions found to be responsible of Jeram Village sinkholes and local earthquake occur-rence in the south east of Kinta Valley. Furthermore the location of the study area near to ring of fire along Su-matra has directly influenced the development and oc-currence of sinkholes especially further south of Kinta
Valley far from granite ridge protection.
4.1.4. Very High Potential Hazard Areas
The crucial sites within the study area are located in the North, North-East and North-West especially near gran- ite ranges (limestone/granite contact) and high urban areas as well as the ex-mining areas in terms of ponds and lakes. In other words, Close to the very steep slope areas, the intersection of river and faults with ponds and urban areas are factors control most of the very high po-tential hazard areas of weighted average. An important number of sinkholes recorded and documented along high ways and industrial areas along the limestone-gran- ite contact for example, Bukit Merah exposed to 21 sinkholes and earth surface subsidence during the period from 1981 to 1998. These types of areas must be catego-rized as restricted areas for new and long towers con-structions.
4.2. Validation of the Geo-Hazard Maps
The accuracy of the hazard map was evaluated by com-paring the hazard map extracted from the model with actual ground observations. The recorded Global Posi-tioning Satellite (GPS) data was added to the hazard map to validate its accuracy. It was found that twenty (20) elements were located in their proper potential hazard
class (Table 3).
To validate the model of potential hazard of sinkhole occurrence we inspected twenty one ground truths. Ten locations of the actual field observation are located within the high potential hazard areas, and seven loca-tions are located within very high potential hazard areas.
Figure 7 shows the resulting Geohazard Map and the
locations of actual hazard based on sinkholes location in high and very high potential hazard areas. It can be con-cluded that the accuracy of the model is about 95% for the hazard area based on field observation location and report from The Malaysian Geological and Mineral De-partment. However, field observations, ground truths and geophysical data in Bukit Merah Village found that four locations of ground truth are located within very high
[image:7.595.60.539.622.735.2]potential hazard area (Figure 7).
Table 2. Percentage area of geo-hazard map classification.
Geo-hazard map classification Area% Sinkholes Number Sinkhole% Diameters (m) Remarks
Low risk areas 53.5 1 1.7 0 - 2 No activities or urbanization area
The moderate risk areas 32.4 3 5.3 2 - 5 Beside Limestone hills, Ipoh town
The high risk area 8.6 12 21.1 5 - 10 and >10 Mining area, Ipoh town Jeram, Bikit Merah,
Very high risk areas 5.5 41 71.9 >10 Jeram, Bikit Merah,
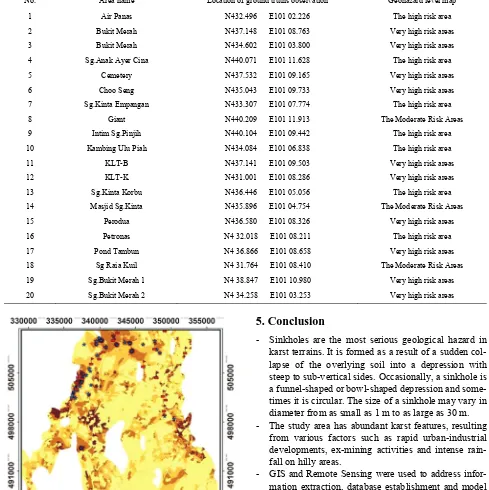
Table 3. Location of ground truths observations in Kinta Valley.
No. Area name Location of ground truths observation Geohazard level map
1 Air Panas N432.496 E101 02.226 The high risk area
2 Bukit Merah N437.148 E101 08.763 Very high risk areas
3 Bukit Merah N434.602 E101 03.800 Very high risk areas
4 Sg.Anak Ayer Cina N440.071 E101 11.628 The high risk area
5 Cemetery N437.532 E101 09.165 Very high risk areas
6 Choo Seng N435.043 E101 09.733 Very high risk areas
7 Sg.Kinta Empangan N433.307 E101 07.774 The high risk area
8 Giant N440.209 E101 11.913 The Moderate Risk Areas
9 Intim Sg.Pinjih N440.104 E101 09.442 The high risk area
10 Kambing Ulu Piah N434.084 E101 06.838 The high risk area
11 KLT-B N437.141 E101 09.503 Very high risk areas
12 KLT-K N431.001 E101 08.286 Very high risk areas
13 Sg.Kinta Korbu N436.446 E101 05.056 The high risk area 14 Masjid Sg.Kinta N435.896 E101 04.754 The Moderate Risk Areas
15 Perodua N436.580 E101 08.326 Very high risk areas
16 Petronas N4 32.018 E101 08.211 The high risk area
17 Pond Tambun N4 36.866 E101 08.658 Very high risk areas
18 Sg Raia Kuil N4 31.764 E101 08.410 The Moderate Risk Areas
19 Sg.Bukit Merah 1 N4 38.847 E101 10.980 Very high risk areas
20 Sg.Bukit Merah 2 N4 34.258 E101 03.253 Very high risk areas
Figure 7. Geohazard map validation in the Kinta Valley.
5. Conclusion
- Sinkholes are the most serious geological hazard in
karst terrains. It is formed as a result of a sudden col-lapse of the overlying soil into a depression with steep to sub-vertical sides. Occasionally, a sinkhole is a funnel-shaped or bowl-shaped depression and some-times it is circular. The size of a sinkhole may vary in diameter from as small as 1 m to as large as 30 m.
- The study area has abundant karst features, resulting
from various factors such as rapid urban-industrial developments, ex-mining activities and intense rain-fall on hilly areas.
- GIS and Remote Sensing were used to address
infor-mation extraction, database establishment and model development.
- The use of GIS model facilitated these updates.
Mi-crosoft Access and GIS software were used to de-velop the database application tools for data input. This helps the creation of a hazard map based on sinkholes distribution and controlling factors.
- Geospatial technologies were found to be quantitative
be processed in GIS.
- Quantitative sinkhole hazard (probability) allows as-
sessing the potential damage that may be caused by sinkholes hazard and performing cost-benefit analy-sis.
REFERENCES
[1] A. Klimchouk, “Morphogenesis of Hypogenic Caves,”
Geomorphology, Vol. 106, No. 1-2, 2009, pp. 100-117. http://dx.doi.org/10.1016/j.geomorph.2008.09.013 [2] R. Brinkmann, M. Parise and D. Dye, “Sinkhole Distribu-
tion in a Rapidly Developing Urban Environment: Hills- borough County, Tampa Bay Area, Florida,” Engineering Geology, Vol. 99, No. 3-4, 2008, pp. 169-184.
http://dx.doi.org/10.1016/j.enggeo.2007.11.020
[3] M. Parise, J. De Waele and F. Gutiérrez, “Current Per- spectives on the Environmental Impacts and Hazards in Karst,” Environmental Geology, Vol. 58, No. 2, 2009, pp.
235-237. http://dx.doi.org/10.1007/s00254-008-1608-2 [4] F. Gutierrez, A. H. Cooper and K. S. Johnson, “Identifi-
cation, Prediction, and Mitigation of Sinkhole Hazards in Evaporite Karst Areas,” Environmental Geology, Vol. 53,
No. 5, 2008, pp. 1007-1022.
http://dx.doi.org/10.1007/s00254-007-0728-4
[5] Y. Gao and E. C. Alexander, “Sinkhole Hazard Assess- ment in Minnesota Using a Decision Tree Model,” Envi- ron Geol Springer-Verlag Environmental Geology, 2008. [6] A. Bahtuarevic, “Sinkhole Density of the Forest City
Quadrangle: Proceeding of 3rd Multidisciplinary Confer- ence on Sinkholes,” PELA Barbados 1:2500 (Cartogra- phy) (1977), Ministry of Overseas Department, British Government, St. Petersburg Beach, 1989.
[7] A. Al Zoubi, A, Abueladas, R. Al Rzouq, C. Camerlynck, E. Akkawi, Z. S. H. Abu-Hamattah, W. Ali and B. S. Al Rawashdeh, “Use of 2D Multi Electrodes Resistivity Ima- gining for Sinkholes Assessment along the Eastern Part of the Dead Sea,” Science Publication, American Journal of Applied Science, 2007.
[8] Y. Gao and E. C. Alexander, “Sinkhole Hazard Assess- ment in Minnesota Using a Decision Tree Model,” Envi-ronmental Geology, Vol. 54, No. 5, 2007, pp. 945-956. http://dx.doi.org/10.1007/s00254-007-0897-1
[9] J. A. Green, W. J. Marken, E. C. Alexander Jr. and S. C. Alexander, “Karst Unit Mapping Using Geographic In- formation System Technology, Mower County, Minne- sota, USA,” Environmental Geology, Vol. 42, No. 5,
2002, pp. 457-461.
http://dx.doi.org/10.1007/s00254-001-0505-8
[10] D. A. Hubbard, “Use of Regional Sinkhole Mapping for Sinkhole Susceptibility Maps, 2003,” Sinkholes and the Engineering and Environmental Impacts of Karst, Geo-technical Special Publication No. 122, 2003, pp. 61-71.
[11] A. Rawashdeh, R. Ruzouq, A. Al-Fugara, B. Pradhan, S. H. Abu-Hamatteh Ziad and A. R. Ghayda, “Monitoring of Dead Sea Water Surface Variation Using Multi-Temporal Satellite Data and GIS,” Araabien Journal of Geosciences, 2012, 8 p.
[12] Y. Gao and E. C. Alexander, “Application of GIS Tech- nology to Study Karst Features of South-Eastern Minne- sota,” In: Beck & Herring, Eds., Geotechnical and Envi-ronmental Application of Karst Geology and Hydrology, Swets & Zeitlinger, Lisse, 2001.
[13] Y. Gao, “Karst Feature Distribution in Southeastern Min- nesota: Extending GIS-Based Database for Spatial Analy- sis and Resource Management,” Ph.D. Thesis, University of Minnesota, 2002.
[14] T. Waltham, F. Bell and M. Culshaw, “Karst and Cav- ernous Rocks in Engineering and Construction,” Springer Praxis Books Geophysical Sciences, 2004.
[15] A. AlFugura, L. Billa and B. Pradhan, “Semi-Automated Procedures for Shoreline Extraction Using Single Radar- sat-1 SAR Image,” Estuarine, Coastal and Shelf Science, Vol. 95, No. 4, 2011, pp. 395-400.
http://dx.doi.org/10.1016/j.ecss.2011.10.009
[16] P. Biswajeet and P. Saied, “Comparison between Predic- tion Capabilities of Neural Network and Fuzzy Logic Techniques for Landslide Susceptibility Mapping,” Dis- aster Advances, Vol. 3, No. 2, 2010, pp. 26-34.
[17] S. Pirasteh, B. Pradhan and S. M. Rizvi, “Tectonic Proc- ess Analysis in Zagros Mountain with the Aid of Drain- age Networks and Topography Maps Dated 1950-2001 in GIS,” Arabian Journal of Geosciences, Vol. 38, No. 4, 2011, pp. 171-180.
http://dx.doi.org/10.1007/s12517-009-0100-y
[18] D. A. Hubbard, “Sinkhole Distribution of the Valley and Ridge Province, Virginia,” Geotechnical and Environ- mental Applications of Karst Geology and Hydrology, 2001, pp. 33-36.
[19] A. C. Waltham and P. G. Fookes, “Engineering Classifi- cation of Karst Ground Conditions,” Quarterly Journal of Engineering Geology and Hydrogeology, Vol. 36, No. 2,
2003, pp. 101-118.
http://dx.doi.org/10.1144/1470-9236/2002-33
[20] C. Denizman, “Morphometric and Spatial Distribution Parameters of Karstic Depressions, Lower Suwanee River Basin, Florida,” Journal of Cave and Karst Studies, Vol.
65, No. 1, 2003, pp. 29-35.
[21] R. F. Muhammad and Y. Ee Beng, “Potential Conserva- tion on Some Important Karst Sites in the Kinta Valley and Lenggong: A Preliminary Study,” In: D. I. Komoo and M. S. Leman, Eds., Warisan Geologi, Malaysia, 2001. [22] A. Mah, G. R. Taylor, P. Lennox and L. Balia, “Linea-