| INVESTIGATION
A Comparison of One-Rate and Two-Rate Inference
Frameworks for Site-Speci
fi
c
dN/dS
Estimation
Stephanie J. Spielman,*,1Suyang Wan,†and Claus O. Wilke*
*Department of Integrative Biology, Center for Computational Biology and Bioinformatics, and Institute for Cellular and Molecular Biology, The University of Texas, Austin, Texas 78712, and†School of Physics and Astronomy, The University of Minnesota, Minneapolis, Minnesota 55455
ABSTRACT Two broad paradigms exist for inferringdN=dS;the ratio of nonsynonymous to synonymous substitution rates, from
coding sequences: (i) a one-rate approach, wheredN=dSis represented with a single parameter, or (ii) a two-rate approach, wheredN
anddSare estimated separately. The performances of these two approaches have been well studied in the specific context of proper
model specification,i.e., when the inference model matches the simulation model. By contrast, the relative performances of one-rate
vs.two-rate parameterizations when applied to data generated according to a different mechanism remain unclear. Here, we compare the relative merits of one-rate and two-rate approaches in the specific context of model misspecification by simulating alignments with mutation–selection models rather than withdN=dS-based models. Wefind that one-rate frameworks generally infer more accurate
dN=dSpoint estimates, even whendSvaries among sites. In other words, modelingdSvariation may substantially reduce accuracy of
dN=dSpoint estimates. These results appear to depend on the selective constraint operating at a given site. For sites under strong purifying selection (dN=dS ≲ 0:3), one-rate and two-rate models show comparable performances. However, one-rate models signif-icantly outperform two-rate models for sites under moderate-to-weak purifying selection. We attribute this distinction to the fact that, for these more quickly evolving sites, a given substitution is more likely to be nonsynonymous than synonymous. The data will therefore be relatively enriched for nonsynonymous changes, and modelingdScontributes excessive noise todN=dSestimates. We additionally
find that high levels of divergence among sequences, rather than the number of sequences in the alignment, are more critical for obtaining precise point estimates.
KEYWORDSdN/dS; mutation–selection models; evolutionary rate; sequence simulation; molecular evolution
A
variety of computational approaches have been devel-oped to infer selection pressure from protein-coding sequences in a phylogenetically aware context. Among the most commonly used methods are those that compute the evolutionary rate ratiodN=dS;which represents the ratio of nonsynonymous to synonymous substitution rates. Begin-ning in the mid-1990s, this value has been calculated using maximum-likelihood (ML) approaches (Goldman and Yang 1994; Muse and Gaut 1994), and since then, a wide variety of inference frameworks have been developed to inferdN=dSat individual sites in protein-coding sequences (Nielsen and Yang 1998; Yang et al.2000; Yang and Nielsen 2002; Yangand Swanson 2002; Kosakovsky Pond and Frost 2005; Kosakovsky Pond and Muse 2005; Lemeyet al.2012; Murrell et al.2012b, 2013).
Typically, the performance of evolutionary models is exam-ined using simulation-based approaches wherein sequences are simulated according to the model being examined, and infer-ences are subsequently performed on the simulated data. This approach ensures that simulated and inferred parameters cor-respond. Although useful, this strategy fundamentally assumes that the data being analyzed were generated by the same mechanism that the inference model used, and hence the model has been correctly specified. Crucially, this scenario does not apply to the analysis of natural sequence data. Indeed, real genomes evolve according to a variety of interacting evolution-ary forces, not according to a phylogenetic model of sequence evolution. As such, it remains unclear how well evolutionary models perform when they are applied to sequence data that have been technically misspecified, i.e., where the data do not conform to the inference model’s assumptions. Indeed,
Copyright © 2016 by the Genetics Society of America doi: 10.1534/genetics.115.185264
Manuscript received December 1, 2015; accepted for publication August 11, 2016; published Early Online August 17, 2016.
Supplemental material is available online atwww.genetics.org/lookup/suppl/doi:10.
1534/genetics.115.185264/-/DC1.
1Corresponding author: Institute for Genomics and Evolutionary Medicine, Temple
ML-based inference methods are guaranteed to converge upon the true parameter value when the model is properly specified (provided there are sufficient data), but there is no such guarantee when the data violate critical model as-sumptions and/or when the model is misspecified (White 1982; Yang 2006).
We therefore seek to we extend our understanding of dN=dS-based inference model performance by studying how well these models infer site-specific dN=dS point estimates when the model is mathematically misspecified. To this end, we simulate sequences not under adN=dS-based model, but instead using the mutation–selection (MutSel) modeling framework. UnlikedN=dS-based models, MutSel models are based on population genetics principles and describe the site-specific evolutionary process as a dynamic interplay between mutational and selective forces (Halpern and Bruno 1998; Yang and Nielsen 2008). Therefore, many regard MutSel models as more mechanistically representative of real coding-sequence evolution thandN=dS-based models, which are primarily phenomenological in nature (Thorne et al.2007, 2012; Holderet al.2008; Rodrigueet al.2010; Tamuriet al. 2012; Liberles et al. 2013). For this reason, MutSel-based simulation approaches have been used to study the behavior of phylogenetic and evolutionary rate inferences (Holder et al.2008; McCandlishet al.2013; dos Reis 2015; Spielman and Wilke 2015b).
Recently, we introduced a mathematical framework that allows us to accurately calculate adN=dSratio directly from the parameters of a MutSel model (Spielman and Wilke 2015b). This framework gives rise to a robust benchmarking strategy through which we can simulate sequences using a MutSel model, inferdN=dSon the simulated sequences using established approaches, and then compare the inferred to the expected dN=dS given by the parameters of the MutSel model. We have previously successfully used such an ap-proach to identify biases indN=dSinference approaches for whole-gene evolutionary rates (Spielman and Wilke 2015b). Here, we employ this approach to evaluate the performance of site-specificdN=dS-based inference approaches.
Because thedN=dSmodels used for inference are mathe-matically misspecified to the data, we can expect inferences to feature statistical biases, which in turn illuminate how these models might behave in more complex scenarios. Sev-eral important distinctions betweendN=dSand MutSel mod-els contribute to the model misspecification examined here. Most importantly, whiledN=dSmodels assume that all non-synonymous substitutions occur at the same rate, MutSel models assume different rates for each type of nonsynony-mous substitution and similarly for synonynonsynony-mous substitutions in certain contexts. This distinction gives rise to a key differ-ence in model assumptions. In particular, because thedN=dS parameter is a rate constant,dN=dSmodels implicitly assume that substitutions are Poisson distributed in time. By contrast, in the MutSel model,dN=dSis not a rate constant, and thus substitutions will be overdispersed relative to a Poisson process.
Two primary questions motivate the present study: (i) How accurate are various inference frameworks for dN=dSpoint estimation? And (ii) under what conditions doesdN=dScapture the long-term evolutionary dynamics of site-specific coding-sequence evolution? For the first question, we focus our efforts on distinguishing performance between two dN=dS inference paradigms: one-rate and two-rate models. One-rate models parameterizedN=dSwith a single parameter fordN; effectivelyfixingdS ¼1 at all sites, whereas two-rate models use separate parameters fordNanddSat each site. Some stud-ies have suggested that the two-rate paradigm leads to more robust positive-selection inference (Kosakovsky Pond and Muse 2005; Murrellet al.2013), whereas others have suggested that the extradS parameter may actually confound positive selec-tion inference (Yanget al.2005; Wolfet al.2009). Here, we do not benchmark positive-selection inference, but we instead ask how this parameterization affects dN=dSpoint estimation in the context of model misspecification. We therefore must em-phasize that this study applies primarily to sequences evolving under equilibrium conditions and not necessarily to sequences evolving under shifting selection pressures.
The second question arises naturally from our use of MutSel models, which describe the equilibrium site-specific codonfitness values. As a consequence, anydN=dScalculated from MutSel model parameters represents, by definition, the steady-state dN=dS (Spielman and Wilke 2015b). Since dN=dSis an inherently time-sensitive measurement (Rocha et al.2006; Kryazhimskiy and Plotkin 2008; Wolfet al.2009; Mugalet al.2014; Meyeret al.2015), it is not necessarily true thatdN=dSmeasured from a given data set will reflect the equilibrium value. Therefore, our approach additionally en-ables us to identify the conditions under which site-specific dN=dSratios are expected to reflect long-term, rather than transient, evolutionary dynamics.
Materials and Methods
Derivation of MutSel simulation parameters
We simulated heterogeneous alignments, such that each site evolved according to a distinct distribution of codonfitnesses, according to the Halpern and Bruno (1998) (HB98) MutSel model using Pyvolve (Spielman and Wilke 2015a). The HB98 rate matrix is given by
QðijkÞ¼
mxijyijFijðkÞ single-nucleotide change
0 multiple-nucleotide changes; (1)
wheremxijyijis the site-invariant mutation rate, wherexijis the
focal nucleotide before mutation andyijthe focal nucleotide
after mutation during the substitution from codonitoj.FðijkÞis
thefixation probability from codonitojat sitekand is de-fined as
FijðkÞ¼ S
ðkÞ
ij
12e2SðijkÞ
whereSðijkÞis the scaled selection coefficient from codonitoj
at sitek(Halpern and Bruno 1998). Thus, this model is spec-ified using a nucleotide-level mutation model (mxy
parame-ters) and codon-levelfitness values (Fijparameters).
We simulated four sets of alignments, all of which assumed a Hasegawaet al.(1985) (HKY85) mutation model with the transition–transversion bias parameterkset to 4. Two align-ment sets assumed equal nucleotide frequencies (pi¼0:25
for i2 fA;C;G;Tg), and the other two alignment sets as-sumed unequal nucleotide frequencies (arbitrarily set to pA¼0:32; pT¼0:28; pC¼0:18; pG¼0:22), to
incorpo-rate underlying nucleotide compositional bias. We refer to these parameterizations, respectively, asPequalandPunequal: For each mutational parameterization, we simulated an alignment set where all synonymous codons shared the same fitness value (no codon bias) and an alignment set where synonymous codons differed in fitnesses (codon bias). The
PequalandPunequalsimulations without codon bias used the same sets offitness parameters, and similarly thePequaland Punequalsimulations with codon bias used the same sets of
fitness parameters.
Following previous work showing that site-specific amino acid frequencies in natural protein alignments tend to follow a Boltzmann distribution (Porto et al. 2004; Ramsey et al. 2011), we simulated 100 site-specific amino acid frequency distributions from a Boltzmann distribution:
FðaÞ ¼Pexpð2laÞ bexpð2lbÞ:
(3)
Here, FðaÞ is the state frequency of amino acida, aand b index amino acids from 0 to 19, and the parameter l in-creases with evolutionary rate (Ramseyet al.2011). For each frequency distribution, we sampled a value forlfrom a uni-form distributionUð0;3Þ;and we selected a random rank-ing for all amino acids. These frequency calculations formed the basis of our derivation of fitness values used in all simulations.
Importantly, when a symmetric nucleotide mutation model is assumed (e.g.,mxy¼myx), codonfitness values can be
cal-culated directly as the logarithm of codon equilibrium fre-quency values (Sella and Hirsh 2005). Therefore, we directly computed codonfitness values from the derived fre-quency values, under the assumption that synonymous co-dons shared the samefitness. Thesefitness parameters were employed for both Pequal andPunequal simulations without codon bias.
To derive fitness parameters for simulations with codon bias, we randomly selected a preferred codon for each amino acid. We assigned a state frequency ofgFðaÞ;wheregwas drawn from a uniform distribution Uð0:5;0:8Þ;to the pre-ferred codon, and we assigned the remaining frequency ð12gÞFðaÞevenly to all remaining synonymous codons. In this way, the overall amino acid state frequency was un-changed, but its synonymous codons occurred with differing frequencies. Note that a single parametergwas selected for
each frequency distribution (i.e., each resulting alignment position) and not for each set of synonymous codons. Again, fitness distributions were directly computed from these resulting codon frequencies for use in both Pequal and Punequalsimulations with codon bias.
Unlike thePequalsimulations, thePunequalsimulations did not contain symmetric mutation rates. Therefore, we obtained stationary codon frequencies for thePunequal simu-lations, for use in dN=dS calculations, numerically as the dominant eigenvector of each MutSel model’s matrix, which was constructed from mutation rates and codonfitness val-ues. In this way, all stationary codon frequency distributions incorporated, by definition, information regarding both codon-levelfitness and nucleotide-level mutation.
We simulated heterogeneous alignments across an array of balanced phylogenies, containing 128, 256, 512, 1024, or 2048 sequences. For each number of taxa, we simulated se-quences with varying degrees of divergence, with all branch lengths equal to 0.0025, 0.01, 0.04, 0.16, or 0.64. Through-out, we useNto refer to a given simulation’s number of taxa andBto refer a given simulation’s branch length. We simu-lated 50 alignment replicates for each combination ofNand B. We additionally simulated alignments, using only the
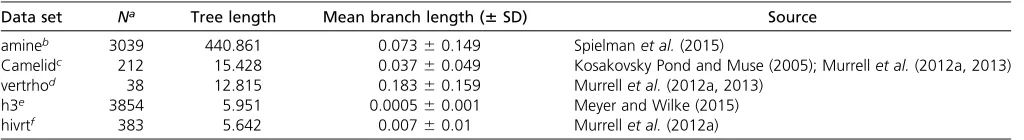
Punequal parameterizations, along five different empirical phylogenies (Table 1), again with 50 replicates each. For these simulations, we directly used the original empirical branch lengths.
dN=dS inference
For each simulated codon frequency distribution, we com-puteddN=dSaccording to the method outlined in Spielman and Wilke (2015b). For each simulated alignment, we inferred site-specificdN=dSvalues with the HyPhy software v2.2 (Kosakovsky Pond et al. 2005), using several ap-proaches: fixed-effects likelihood (FEL) (Kosakovsky Pond and Frost 2005), fast unconstrained Bayesian approximation (FUBAR) (Murrellet al.2013), and single ancestral counting (SLAC) (Kosakovsky Pond and Frost 2005). We specified the Muse and Gaut (1994) MG943HKY85 (Kosakovsky Pond and Frost 2005) rate matrix with F134 codon frequencies, which has been shown to reduce bias in dN=dSestimation (Spielman and Wilke 2015b). We provide customized HyPhy batchfiles, which enforce the F134 codon frequency
speci-fication, in the Github repository: https://github.com/ sjspielman/dnds_1rate_2rate.
there exist two ways to calculate site-wisedN=dS:dScan be considered site specific, ordS values can be globally aver-aged, and this mean can be used to normalize all site-specific dNestimates. The former calculations effectively correspond to a two-rate model (SLAC2), and the latter calculations cor-respond to a one-rate model (SLAC1). We conducted all in-ferences using the true tree along which we simulated each alignment.
As in Kosakovsky Pond and Frost (2005), we excluded all unreliabledN=dSinferences when correlating inferred and true dN=dSvalues. Specifically, we excluded FEL estimates where dN=dS¼1 and the P-value indicating whether the estimate differed significantly from 1 was also equal to 1. Such estimates represent uninformative sites where no mu-tation has occurred (Meyeret al.2015). In addition, we ex-cluded SLAC2 estimates if the number of synonymous mutations counted was 0, and hence the resulting dN=dS was undefined. Finally, we excluded all FEL and FUBAR in-ferences for which the algorithm did not converge as uninformative.
Statistical analysis
Statistics were conducted in the R statistical programming language. Linear modeling was conducted using the R pack-age lme4 (Bateset al.2012). We inferred effect magnitudes and significance, which we corrected for multiple testing, using the glht() function in the R package multcomp (Hothorn et al.2008). In particular, we built mixed-effects linear models in the lme4 package with the general code lmer(X method + (1|replicate) + (1|N:B)), whereX is either the Pearson correlation between inferred and true dN=dS or the root-mean-square deviation (RMSD) of the inferred from the true dN=dS: RMSD is calculated as
RMSDðuÞ ¼
ffiffiffiffiffiffiffiffiffiffiffiffiffiffiffi
ð^u2uÞ2
q
;where^uis the true parameter value anduis the estimated value. Note that, for all mixed-effects linear models, we excluded simulations under the B¼0:0025 branch length condition.
Data availability
All code and results are freely available from the Github re-pository:https://github.com/sjspielman/dnds_1rate_2rate.
Results
Approach
We simulated fully heterogeneous alignments under the HB98 MutSel model (Halpern and Bruno 1998), using the simulation software Pyvolve (Spielman and Wilke 2015a). Our simulation strategy is described in detail in Materials and Methods. Briefly, MutSel models are parameterized with a nucleotide-level mutation model and a distribution of codon fitness values. All simulations employed the HKY85 mutation model (Hasegawaet al.1985) with the transition–transversion bias parameter k¼4:0:We simulated data under four pri-mary conditions: specifying either equal or unequal nucleo-tide frequencies in the HKY85 model and specifying no codon bias or codon bias for the codonfitness values. Simulations without codon bias assumed that all synonymous codons had the samefitness, and simulations with codon bias assumed that synonymous codons differed infitness values. We refer to simulations with equal nucleotide frequencies as Pequal and to simulations with unequal nucleotide frequencies as
Punequal:
Each simulated alignment contained 100 sites, and simu-lations were conducted along balanced phylogenies with the number of sequences N set as 128, 256, 512, 1024, or 2048 and with branch lengths Bset as 0.0025, 0.01, 0.04, 0.16, or 0.64. For each of the 25 possible combinations of parametersNandB, we simulated 50 replicate alignments. Importantly, the site-specific evolutionary models were the same within each simulation set, making inferences across N andB conditions directly comparable. We note that the extremely high divergence level inB¼0:64 simulations does not represent real sequence data, but these simulations do allow us to studydN=dSinference method performance un-der the limiting condition of (approximately) infinite time.
We inferred site-specificdN=dSfor each simulated align-ment, using three approaches: FEL (Kosakovsky Pond and Frost 2005), SLAC (Kosakovsky Pond and Frost 2005), and FUBAR (Murrellet al.2013). Each of these methods employs a somewhat different approach when computing site-specific dN=dSvalues. FELfits a uniquedN=dSmodel to each align-ment site (Kosakovsky Pond and Frost 2005), SLAC directly counts nonsynonymous and synonymous changes along the Table 1 Empirical phylogenies
Data set Na Tree length Mean branch length (6SD) Source
amineb 3039 440.861 0.07360.149 Spielmanet al.(2015)
Camelidc 212 15.428 0.03760.049 Kosakovsky Pond and Muse (2005); Murrellet al.(2012a, 2013)
vertrhod 38 12.815 0.18360.159 Murrellet al.(2012a, 2013)
h3e 3854 5.951 0.000560.001 Meyer and Wilke (2015)
hivrtf 383 5.642 0.00760.01 Murrellet al.(2012a)
aNumber of taxa.
bVertebrate biogenic amine receptors.
cLlama and dromedary partial heavy-chain antibody sequences.
dVertebrate rhodopsin.
eInfluenza strain H3N2 hemagglutinin.
phylogeny where ancestral states are inferred with maxi-mum likelihood (Kosakovsky Pond and Frost 2005), and FUBAR employs a Bayesian approach to determinedN=dS ratios according to a prespecified grid of rates (Murrellet al. 2013).
For each inference method, we inferreddN=dSat each site in both a two-rate context (separatedNanddSparameters per site) and a one-rate context (a singledN=dSparameter per site). Although SLAC, as a counting-based method, always enumerates bothdNanddSon a per-site basis, one can derive an effectively one-rate SLAC by normalizing each site-wisedN estimate by the mean of all site-wisedSestimates. We refer to one-rate inferences with these methods as FEL1, FUBAR1, and SLAC1 and similarly to two-rate inferences as FEL2, FUBAR2, and SLAC2, respectively. Throughout, we use method to refer to distinct algorithmic approaches (FEL, FUBAR, and SLAC), and we usemodelto refer to a one-rate or a two-rate parameterization. We use either framework or ap-proachto more generally discuss one-ratevs.two rate methods. We performed alldN=dSinference using the HyPhy batch language (Kosakovsky Pondet al.2005). Note that we did not consider the popular random-effects likelihood methods in-troduced by Yanget al.(2000) (e.g., M3, M5, and M8) be-cause these methods are used predominantly in a one-rate context. Available two-rate extensions to this framework are computationally burdensome and cannot model the amount of rate heterogeneity required to calculate per-site rates (Kosakovsky Pond and Muse 2005). Finally, we computed
true dN=dS values from the MutSel parameters, using the approach described in Spielman and Wilke (2015b).
Modeling synonymous rate variation may reduce inference accuracy
After inferring site-wisedN=dSfor all simulated alignments, we quantified performance for all inference frameworks, us-ing several metrics, primarily the Pearson correlation be-tween true and inferreddN=dS:Importantly, our simulation strategy necessitates a somewhat different interpretation of results than would more traditional simulation approaches. The true dN=dSratios calculated from the MutSel parame-terizations used during simulation correspond to thedN=dS expected at steady state,i.e., the signature of natural selec-tion at evoluselec-tionary equilibrium. We can expect to recover this truedN=dSvalue only if the simulated data reflect the stationarity condition. When either the simulated divergence or the number of sequences analyzed is low, it not necessarily possible to capture the true equilibrium distribution of co-dons. Therefore, we considered the most accurate inference frameworks as those that produced the highestdN=dS corre-lations within a given choice ofNandB.
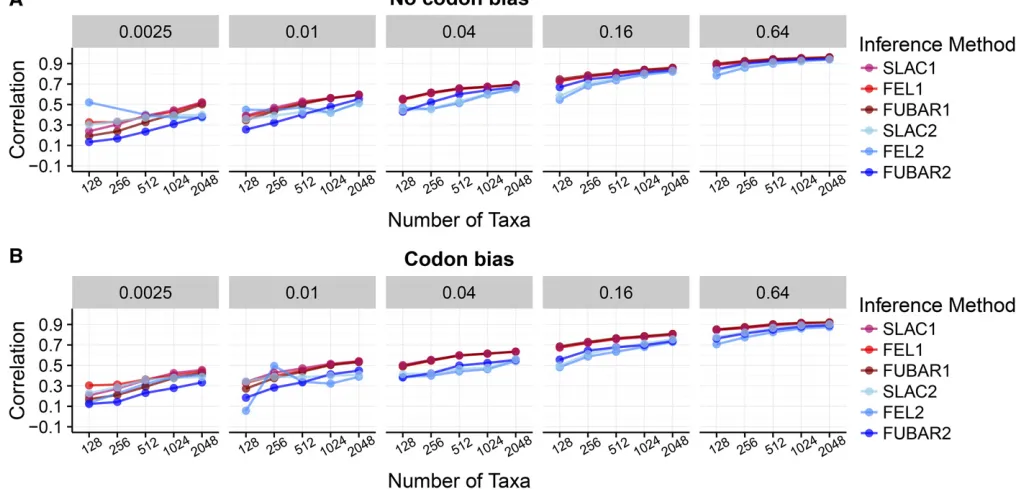
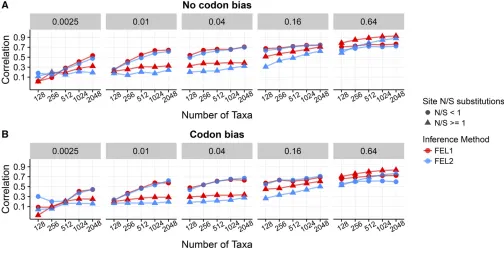
In Figure 1, we show resulting Pearson correlation coeffi -cients, averaged across all 50 replicates, between inferred and true dN=dS for each inference framework, specifically for Punequal simulations. Results for Pequal simulations showed virtually identical correlations (P¼0:68;ANOVA; Supplemental Material,Figure S1). In the absence of codon Figure 1 Pearson correlation coefficients between true and inferreddN=dSacross inference approaches andN-Bconditions, forPunequalsimulations.
(A) Correlations for alignments simulated without codon bias. (B) Correlations for alignments simulated with codon bias. The label above each panel indicates the branch lengthsBof the balanced phylogeny along which sequences were simulated, and thex-axes indicate the number of sequencesN. Each point represents the correlation coefficient averaged across 50 replicates.Figure S1shows correspondingPequalsimulations. Note that certain FEL2
bias,dS¼1 at all sites. As such, we expected that one-rate inference frameworks would outperform two-rate inference frameworks. We indeed found that one-rate inference frame-works showed the highest correlations when there was no synonymous selection (Figure 1A), in particular at low-to-intermediate divergence levels (B2 f0:01;0:04;0:16g). As the sequences became more diverged, and hence more in-formative, two-rate frameworks increasingly performed as well as one-rate frameworks did. Even so, two-rate frame-works almost never outperformed one-rate frameframe-works.
In the presence of codon bias, bothdNanddSvaried at each site, and therefore we expected that two-rate frameworks would be more well suited for these simulations. Surprisingly, however, one-rate frameworks still outperformed two-rate frameworks acrossNandBconditions, in spite of the pervasive site-wisedS variation across sites (Figure 1B andFigure S1). Moreover, cor-relation differences between one-rate and two-rate frameworks were more pronounced for simulations with codon bias than for simulations without codon bias. In other words, two-rate frame-works performed worse on data simulated with codon bias than they did on data simulated without codon bias.
To complement our correlation analysis, we calculated several additional metrics to quantify accuracy: (i) RMSD of the inferreddN=dSfrom the truedN=dS(Figure S2), (ii) estimator bias for each inference framework (Figure S3), and (iii) variance in residuals for a simple linear model regressing inferred on truedN=dS(Figure S4). These metrics displayed the same general trends as did correlation analysis: One-rate frameworks were generally more accurate and precise (lower RMSD, lower estimator bias, and lower residual variance) than were two-rate frameworks, and these overarching trends were more pronounced for simulations with codon bias (all P,2310216; ANOVA). As divergence increased, each metric dropped substantially for both one- and two-rate frameworks, with error and/or bias for one-rate frameworks dissipating more quickly than for two-rate frameworks. These patterns were consistent between the Punequal and Punequal simulations for estimator bias and residual variance (both P.0:2; ANOVA), although Pequal displayed marginally smaller RMSD values compared to Punequal (P¼0:04 with an average difference of 24:4531023; ANOVA). Thus,
dN=dS inference was robust to the presence of nucleotide compositional bias.
Rate parameterization affects dN=dS estimation more strongly than does inference method
We next quantified performance differences among inference frameworks more rigorously, using linear models. For each simulation set, we built mixed-effects linear models with either Pearson correlation or RMSD as the response, inference approach as afixed effect, and replicate as well as interaction betweenNandBas random effects. We performed multiple-comparisons tests, with correctedP-values, to ascertain the relative performances across inference approaches.
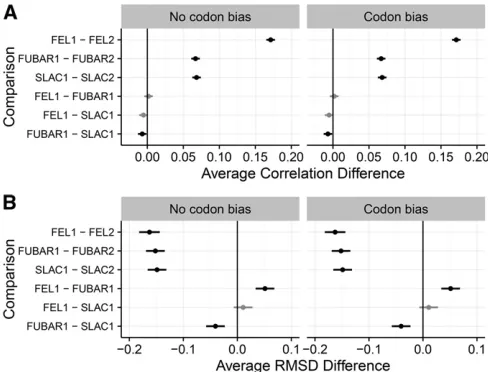
Linear model analysis confirmed prior observations that each one-rate method significantly outperformed its
respec-tive two-rate counterpart (Figure 2 for Punequalsimulations and Figure S5for Pequal simulations). In addition, correla-tions differences among one-rate methods were not statisti-cally significant for any inferences performed on Punequal simulations (Figure 2A). ForPequalsimulations, SLAC1 yielded significantly higher correlations than did FUBAR1, although the effect magnitude size was minimal, with a mean differ-ence ofr¼0:01 (Figure S5A).
For both Punequal and Pequal simulations, that one-rate methods yielded less error in point estimates than did two-rate methods (Figure 2B andFigure S5B). Unlike results from linear models with correlation as the response, however, RMSD analysis showed some more substantial differences among one-rate methods. Overall, SLAC1 and FEL1 per-formed comparably, but FUBAR1 showed lower RMSD than both SLAC1 and FEL1, albeit with a very small effect magni-tude. This result persisted across all simulation conditions. Together, thesefindings suggest the number of parameters used to model dN=dSmattered more than did the specific inference method chosen.
We next examined whether linear modeling results, spe-cifically those comparing correlation strength between meth-ods, were driven by particular simulation conditions. We directly compared correlations between one-rate and two-rate inferences, for each method (FEL, SLAC, and FUBAR) across Nand B conditions, specifically for Punequal simula-tions. These comparisons indicated that improvement of one-rate over two-rate parameterizations was largely driven by results for intermediate divergence levels (Figure S6). For Figure 2 Pairwise comparisons of correlation strength, RMSD, and vari-ance in residual across methods, determined through multiple-comparisons tests, forPunequalsimulations. (A) Results for multiple-comparison tests of
correlation strength. (B) Results for multiple-comparison tests of RMSD. Points indicate the estimated average difference between measurements for the respective inference approaches, and lines indicate 95% confi -dence intervals. Solid lines indicate that the performance difference be-tween methods differed significantly from 0 (allP,0:01). Shaded lines indicate that the difference was not statically significant (P.0:01). All
example, under FEL inference, the greatest improvement of FEL1 over FEL2 occurred where B2 f0:04;0:16g and N2 f128;256;512g:
Data contain insufficient information for precise site-wise dSestimation
We next sought to determine why one-rate frameworks out-performed two-rate frameworks. Given the broad similarity among inference methods and simulation sets, we considered only FEL inferences onPunequalsimulations for these analyses. To begin, we confirmed that simulations with codon bias indeed led todSvariation in the data by comparing distribu-tions of inferreddS;with FEL2, between simulations with and without codon bias. If our implementation of codon bias in-deed produceddSvariation, the inferreddSdistributions from codon bias simulations should contain more variation com-pared to the inferreddSdistributions for simulations without codon bias, whose inferences should be concentrated at dS1:Indeed, dS distributions for codon bias simulations displayed substantially more variation than diddS distribu-tions for simuladistribu-tions without codon bias (Figure S7).
We next compared the optimized branch lengths inferred by HyPhy during rate estimation to those used for simulation. Because branch length parameters influencedN=dS estima-tion, it is possible that biases in these parameters could infl u-ence the resulting rate inferu-ences. Importantly, we should not expect branch lengths used for a MutSel simulation to match precisely those optimized under adN=dS-based model, due to differences in model assumptions, although branch lengths should be consistently inferred across simulation conditions. Across simulations, we found no significant difference among distributions of optimized branch lengths, for a given set of simulations using the same branch length B (Figure S8). Therefore, differences in branch length optimization did not seem to affectdN=dSinferences.
We proceeded to compare directly the inferred dN=dS values across simulation conditions, for a single representa-tive replicate (Figure S9, A and B). The relationship between one-rate and two-rate dN=dSestimates featured consider-able noise, across all simulation conditions. To determine the source of this noise, we confirmed thatdNestimates be-tween one-rate and two-rate models were comparable. We examined individualdNestimates between FEL1 and FEL2, again for a single replicate. Aside from low-information con-ditions (e.g., B¼0:0025 and/or N¼128), dN estimates were virtually identical between FEL1 and FEL2, for simula-tions both with and without codon bias (Figure S9, C and D). This result demonstrated that the added dS parameter in two-rate inference methods did not affect dN estimation, but rather it contributed substantial noise to thefinaldN=dS estimate.
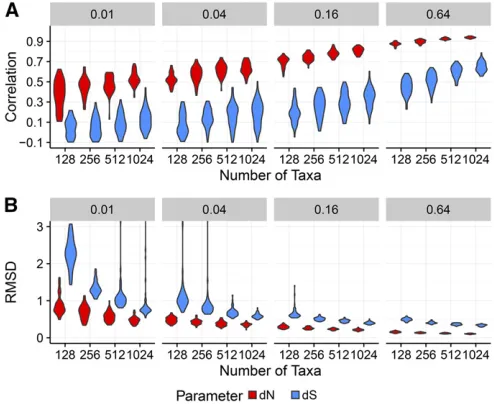
Finally, we assessed how well FEL2 estimateddNrelative to
dS;specifically for simulations with codon bias, in whichdS variation exists. We found that FEL2 consistently estimated dNmore precisely thandS;measured using both correlations and RMSD (Figure 3). Although accuracy for bothdNanddS
estimation increased as eitherBorNincreased,dNestimates universally displayed higher correlations and lower RMSD than diddSestimates. As such, it appeared thatdSwas simply statistically more difficult to estimate than wasdN:
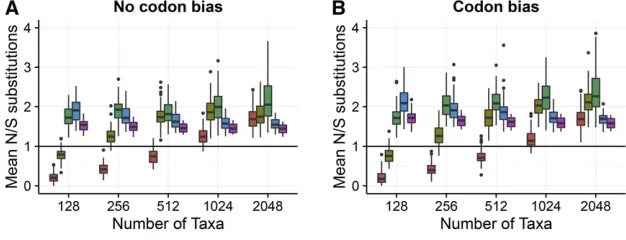
We hypothesized that this result was a direct consequence of the relative amount of information in the alignments for nonsynonymous vs. synonymous changes. Using the simu-lated ancestral sequences within each simusimu-lated alignment, we directly counted the number of nonsynonymous and syn-onymous changes that had occurred across the phylogeny. We observed that nonsynonymous changes occurred roughly twice as frequently over the course of a simulation than did synonymous changes (Figure 4). This result was fully com-patible with the notion that statistical estimation ofdS was more challenging than that of dN because of sample size: Alignments contained nearly double the amount of informa-tion contributing todNthan todS:As a consequence,dS esti-mation was less precise and noisier across simulation conditions, ultimately explaining why two-rate frameworks yielded less precise dN=dSestimates compared to one-rate frameworks.
One-rate frameworks outperform two-rate frameworks primarily at weakly constrained sites
All previous analyses compared inferences across alignment replicates. Yet each alignment featured an array of selective constraints, with each site evolving with a different underlying dN=dS: Whether the heterogeneous selective constraints across sites influenced our previous results was not immedi-ately clear. For example, according to the structure of the genetic code, 74% of all possible single-nucleotide changes are nonsynonymous, and the remaining 26% are Figure 3 dNestimates are more precise than aredSestimates. Results are
shown for a subset of conditions forPunequalsimulations with codon bias,
inferred with FEL2. (A) Violin plots of Pearson correlations between inferred and truedNanddSvalues. (B) Violin plots of RMSD of inferred
from truedNanddSvalues. Outlying points beyond they-axis ranges have
synonymous. Therefore, a neutrally evolving site, where both nonsynonymous and synonymous changes are equally likely to go to fixation, should experience approximately three times more nonsynonymous than synonymous substitutions. By contrast, sites under stringent selection pressure will tol-erate few amino acids, and thus these sites may feature more synonymous than nonsynonymous changes. Noting this dis-tinction, we next examined whether one-rate or two-rate frameworks performed differently, depending on a given site’s evolutionary constraint.
We therefore reanalyzed ourPunequalsimulations, specif-ically under FEL1 and FEL2 inference, while considering sites to be in one of two categories: having a relative enrichment for synonymous substitutions or having a relative enrichment for nonsynonymous substitutions (Figure 5). Across simula-tion condisimula-tions, FEL1 and FEL2 models yielded virtually identical correlations at sites enriched for synonymous sub-stitutions (linear model,P.0:4). By contrast, FEL1 consistently outperformed FEL2 when sites contained more nonsynonymous than synonymous substitutions, with an average correlation in-crease ofr¼0:1 (linear model,P,2310216). TheB¼0:64 condition did not adhere to this general pattern and consistently favored one-rate frameworks, likely due to difficulty in estimat-ingdS due to mutational saturation at such high divergences. Together, these results show that one-rate frameworks offered the most improvement, relative to two-rate frameworks, when sites had experienced more nonsynonymous changes. On the other hand, when the data were enriched for synonymous changes, one-rate and two-rate frameworks provided compara-ble estimates.
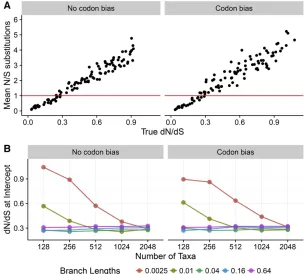
To ascertain more broadly at which sites a one-ratedN=dS inference framework may be preferred, we examined the re-lationship between substitution counts and truedN=dSacross simulations (Figure 6). Figure 6A shows the relationship be-tween truedN=dSand the mean ratio of nonsynonymous to synonymous substitution counts, along the simulated phylog-eny, specifically forN¼512 andB¼0:04:In Figure 6A, points below they¼1 line represent sites with, on average, a relative enrichment for synonymous compared to nonsynonymous changes, and similarly points above they¼1 line represent sites with an average enrichment for nonsynonymous com-pared to synonymous changes. We found that sites under stronger selective constraint indeed featured relatively more
nonsynonymous changes, and sites under weaker constraint featured relatively more synonymous changes.
To generalize across all simulation conditions, we calcu-lated the true dN=dSwhere, on average, sites transitioned from having more synonymous to more nonsynonymous changes (Figure 6B). In general, sites became enriched for nonsynonymous substitutions atdN=dS0:3:However, the transition point was substantially larger for simulation con-ditions with low levels of divergence, likely because substi-tutions did not have sufficient time to accumulate. Taken together, these results reveal that one-rate frameworks may offer the most improvement over two-rate frameworks when dN=dS$0:3; i.e., when sites are under moderate-to-weak purifying selection. By contrast, one-rate and two-rate frame-works showed minimal, if any, differences when applied to sites subject to strong purifying selection (dN=dS,0:3).
Divergence is more important than is the number of sequences for identifying long-term
evolutionary constraint
We additionally observed thatdN=dSinference accuracy in-creased as both the number of sequencesNand the branch lengthsB(divergence) grew (Figure 1,Figure S1,Figure S2, Figure S3, and Figure S4), suggesting that large and/or highly informative data sets are necessary for the inferred dN=dSto capture the actions of natural selection at evolu-tionary equilibrium. However, it was not immediately clear whetherN,B, or some combination of these conditions drove this trend. Therefore, we next assessed the relative impor-tance ofNandBon estimating the equilibriumdN=dSrate ratio.
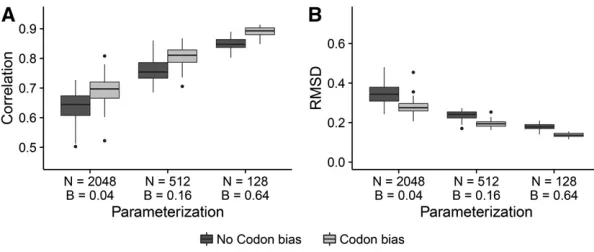
shown in Figure 7, we compared dN=dS correlations and RMSD from FEL1 for three combinations ofNandB condi-tions that all yielded virtually the same tree lengths (162– 164). Simulations with lowerNand higherBresulted in far more accuratedN=dSestimates, even though all simulations in Figure 7 experienced the same average number of substi-tutions. This increase was highly significant; for data simu-lated without codon bias, correlations increased an average of 28%, from B¼0:04 toB¼0:64, and similarly RMSD decreased an average of 50% (both P,10215; linear model). For data simulated with codon bias, correlations in-creased an average of33%, fromB¼0:04 toB¼0:64;and RMSD decreased an average of52% (bothP,10215;linear model). Therefore, the relative importance of divergence over number of taxa held for simulations with and without codon bias alike.
Simulations along empirical phylogenies recapitulate observed trends
While the balanced-tree simulations described above pro-vided a useful framework for examining overarching patterns in inference-framework behaviors, they did not necessarily reflect the properties of empirical data sets. We therefore assessed how applicable our results were to real data analysis by simulating an additional set of alignments along five empirical phylogenies (Table 1). Importantly, we considered the original empirical branch lengths for this analysis, so these phylogenies featured a range of number of taxa and divergence levels representative of empirical studies. We sim-ulated alignments using the Punequal MutSel
parameteriza-tions, with both no codon bias and codon bias. We simulated 50 replicate alignments for each phylogeny and parameteriza-tion, and for efficiency we inferreddN=dSusing only FUBAR1 and FUBAR2.
We identified the same general trends in these empirical simulations as we observed for simulations along balanced trees: FUBAR1 estimated dN=dS more precisely than did FUBAR2, and phylogenies with higher divergence levels yielded more accurate estimates (Figure 8). Furthermore, FUBAR2 estimated dN more accurately than dS (Figure S10), again reflecting the relative difficulty in estimatingdS compared to dN: Importantly, most empirical phylogenies showed mean correlations with truedN=dSof 0:4,r,0:6; with the key exception of the biogenic amine receptor phy-logeny (“amine”), whose extremely high number of taxa and divergence yield exceptionally high correlations with both FUBAR1 and FUBAR2. Therefore, we found that under more realistic conditions, estimateddN=dSwill correlate with the equilibriumdN=dSratio with only moderate strength.
In addition, results for simulations along the empirical phylogenies supported our findings regarding the relative importance of divergence vs. number of taxa, in particular through the juxtaposition of results for camelid and verte-brate rhodopsin (“vertrho”) simulations. These phylogenies showed similar tree lengths, but the camelid tree length was driven by the number of sequences, and the vertebrate rho-dopsin tree length was driven by its larger branch lengths (Table 1). Correlations and RMSD revealed a far higher in-ference accuracy for the vertebrate rhodopsin simulations than for the camelid simulations. On average, vertebrate Figure 5 Mean Pearson correlations between inferred and truedN=dS;specifically forPunequalsimulations analyzed with FEL1 and FEL2. Sites that have
rhodopsin correlations were 0.08 higher than were camelid correlations, and vertebrate rhodopsin RMSD was 0.1 lower than was camelid RMSD (bothP,5310211;linear model). These metrics were consistent between simulations with and without codon bias (both P.0:5; linear model test for in-teraction effect of presence of codon bias). Therefore, even for data simulated along empirical phylogenies, sequence di-vergence proved more important than did the number of taxa for accurately estimating the equilibriumdN=dSrate ratio.
Discussion
In this study, we have examined the relative accuracy of one-rate and two-one-rate site-specificdN=dSinference approaches. Importantly, we performed these analyses in the specific con-text ofdN=dSpoint estimation in the presence of model mis-specification. We have found that one-rate inference models usually yielded more accurate inferences than did two-rate models, across a variety of inference algorithms. More spe-cifically, we provide evidence that one-rate models may im-prove upon two-rate models predominantly for sites subject to moderate-to-weak purifying selection. By contrast, one-rate and two-one-rate models infer dN=dSpoint estimates with comparable accuracy when sites are under stronger purifying selection. These results hold for sequences both without co-don bias (synonymous coco-dons are equallyfit) and with codon bias (synonymous codons differ in fitness), suggesting that two-rate models are not necessarily more reliable than are one-rate models even whendSvariation exists. We attribute these results to the relative amounts of information present in the data used for estimating dN and dS parameters. When
relatively more information is available to estimatedN;the dSparameter becomes overly influenced by noise and hence reduces accuracy indN=dSestimates.
Our study provides novel insight into howdN=dSinference frameworks behave specifically when they are misspecified to the data. Indeed, real genomes do not evolve according to a dN=dS model, and thus virtually all applications ofdN=dS models will be misspecified to some degree. Although it is certainly true that mutation–selection models also do not precisely capture real sequence evolution, this simulation framework provides a starting place to uncover model prop-erties and limitations in an explicitly misspecified context.
We have demonstrated that two-rate frameworks do not necessarily accomplish their intended goal of modeling syn-onymous rate variation. Logically, one would presume that, whendSdiffers among sites, estimatingdSseparately across sites would produce more accurate dN=dS estimates than wouldfixingdSto a constant value. Indeed, an assumed pres-ence of synonymous substitution-rate variation is the very justification for using a two-ratedN=dSmodel (Kosakovsky Pond and Muse 2005). However, if the data do not contain sufficient information for inferringdS;then two-rate param-eterizations may suffer from excessive amounts of noise, and hence in certain circumstances, one-rate models may be preferable.
Our use of MutSel models for simulations raises several important caveats that directly affect how to interpret our results. As described, our results are contingent on the fact that our simulation model did not match our inference model, and hence the inference model was mathematically misspecified. In other words, we ask howdN=dS-based models perform in Figure 6 Relationship between truedN=dSand the ratio of the number of nonsynonymous to synonymous changes that occurred during simulations, counted di-rectly from simulated ancestral sequences. Results are shown forPunequalsimulations. (A) Regression of the ratio
estimating a parameter that the MutSel model does not ex-plicitly contain, although it can be calculated from the MutSel parameters. As a consequence, certain biases arise during dN=dSinference. For example, comparable performance of SLAC, an approximate counting-based method, with FEL and FUBAR, both of which employ more rigorous statistical pro-cedures, may be directly attributed to model misspecification. Indeed, previous studies using data simulated under the in-ference model have suggested that SLAC may be a biased estimator when correctly specified, particularly at high diver-gences (Kosakovsky Pond and Frost 2005). Therefore, it is certainly possible that a two-ratedN=dS framework would outperform a one-ratedN=dSframework if the model were correctly specified. Indeed, previous studies have shown that two-ratedN=dSmodels perform well for data simulated with explicit dN and dS constant parameters (Kosakovsky Pond and Frost 2005; Kosakovsky Pond and Muse 2005; Murrell et al.2012b, 2013).
Second, the substitution process under a MutSel models is not necessarily temporally homogeneous, whereas in dN=dS-based models, substitutions are Poisson distributed over time. As a consequence, sequence divergence will have a strong effect on inference accuracy for data generated in a MutSel framework. Indeed, dN=dS can be calculated only based on the substitutions that have occurred in the sequence data examined. If, for example, sequences were not highly diverged, then dN=dS estimates will be biased based on which substitutions have had an opportunity to occur. Con-versely, for data simulated under adN=dSframework, which particular substitutions had a chance to occur will matter far less, as all nonsynonymous changes occur at the same rate. Because the temporal inhomogeneity of the MutSel process does not match the corresponding homogeneity of the dN=dS-based model process, our observed correlations be-tween inferred and true dN=dS (Figure 1) were generally lower than they would have been if sequences were simu-lated with adN=dS-based model.
Third, because MutSel models can correspond only to sites evolving under an evolutionary equilibrium [i.e., under either purifying selection or neutral evolution where dN=dS#1 (Spielman and Wilke 2015b)], our results do not immedi-ately apply to contexts where sequences do not evolve under equilibrium or for the specific application of positive-selection inference (dN=dS#1). For example,dN=dSinference is perhaps
most commonly used to study sequences evolving along a changing fitness landscape, as would be the case for viral and/or pathogen evolution (Delport et al. 2008; Murrell et al. 2012a; Demogines et al. 2013; Meyer et al. 2015; Meyer and Wilke 2015) By contrast, the MutSel model used here assumes that thefitness landscape is static across the phylogeny. As such, our results may or may not have any bearing on parameterizations used for positive-selection inference.
Finally, our codon bias simulations assumed thatdS vari-ation was driven by selection on synonymous codons. In other circumstances, synonymous rate variation might emerge when a given gene contains mutational hotspots,e.g., regions with a strongly elevated nucleotide mutation rate. In such circumstances, it is possible that a two-rate model would outperform a one-rate model if the variation in mutational processes were sufficiently large (Kosakovsky Pond and Frost 2005).
Our results build on the well-documented time depen-dency of thedN=dSmetric, a phenomenon studied primarily in the context of polymorphic data (Rocha et al. 2006; Kryazhimskiy and Plotkin 2008; Wolf et al.2009; Mugal et al. 2014; Meyer et al. 2015). Our results extend these findings and indicate that this time dependency is more gen-eral and pertains also to circumstances where the data con-tain onlyfixed differences. Thisfinding makes intuitive sense: As divergence increases, sites will be more likely to visit the full range of selectively tolerated states, at which time the long-term evolutionary constraints will become apparent. It is therefore likely that most dN=dS measurements will be biased by time to some degree, even if all differences arefixed and not polymorphic. Our results suggest that this bias can be ameliorated by focusing data set collection to include fewer, more divergent sequences rather than as many sequences as one can obtain. Increasing the number of taxa in a given analysis may be beneficial only if the new sequences are sub-stantially diverged from the existing sequences. These fi nd-ings should also inform studies that seek to relate site-specific protein evolutionary rate (i.e.,dN=dS) to structural proper-ties, such as relative-solvent accessibility or weighted contact number (Echaveet al.2016). Ourfindings predict that more diverged data sets should provide more meaningful informa-tion about long-term evoluinforma-tionary constraints, which struc-tural quantities reflect.
Figure 7 The amount of divergence is more important than the number of sequences for obtaining the equilib-riumdN=dSvalue. Boxplots represent either (A) correla-tion or (B) RMSD across the 50 respective simulacorrela-tion replicates. Results shown correspond toPunequal
Acknowledgments
Computational resources were provided by the University of Texas at Austin’s Center for Computational Biology and Bio-informatics and the Stampede cluster at the Texas Advanced Computing Center. We thank Julian Echave for insightful dis-cussion and helpful feedback. This work was supported in part by National Institutes of Health (NIH) grant F31 GM113622-01 (to S.J.S.), NIH grant RGM113622-01 GM088344 (to C.O.W.), Army Research Office grant W911NF-12-1-0390 (to C.O.W.), De-fense Threat Reduction Agency grant HDTRA1-12-C-0007 (to C.O.W.), and National Science Foundation Cooperative Agreement no. DBI-0939454 (BEACON Center) (to C.O.W.).
Literature Cited
Bates, D., M. Maechler, and B. Bolker, 2012 lme4: Linear
Mixed-Effects Models Using S4 Classes(R package version 0.999999-0).
Delport, W., K. Scheffler, and C. Seoighe, 2008 Frequent toggling
between alternative amino acids is driven by selection in HIV-1. PLoS Pathog. 4: e1000242.
Demogines, A., J. Abraham, H. Choe, M. Farzan, and S. L. Sawyer,
2013 Dual host-virus arms races shape an essential
house-keeping protein. PLoS Biol. 11: e1001571.
dos Reis, M., 2015 How to calculate the non-synonymous to
syn-onymous rate ratio of protein-coding genes under the Fisher-Wright mutation-selection framework. Biol. Lett. 11: 20141031.
Echave, J., S. J. Spielman, and C. O. Wilke, 2016 Causes of
evo-lutionary rate variation among protein sites. Nat. Rev. Genet.
17: 109–121.
Goldman, N., and Z. Yang, 1994 A codon-based model of
nucle-otide substitution for protein-coding DNA sequences. Mol. Biol.
Evol. 11: 725–736.
Halpern, A. L., and W. J. Bruno, 1998 Evolutionary distances for
protein-coding sequences: modeling site-specific residue
fre-quencies. Mol. Biol. Evol. 15: 910–917.
Hasegawa, M., H. Kishino, and T. Yano, 1985 Dating the
human-ape splitting by a molecular clock of mitochondrial DNA. J. Mol.
Evol. 22: 160–174.
Holder, M., D. Zwickl, and C. Dessimoz, 2008 Evaluating the
ro-bustness of phylogenetic methods to among-site variability in
substitution processes. Philos. Trans. R. Soc. B 363: 4013–4021.
Hothorn, T., F. Bretz, and P. Westfall, 2008 Simultaneous
infer-ence in general parametric models. Biom. J. 50: 346–363.
Kosakovsky Pond, S. L., and S. W. D. Frost, 2005 Not so different
after all: a comparison of methods for detecting amino acid sites
under selection. Mol. Biol. Evol. 22: 1208–1222.
Kosakovsky Pond, S. L., and S. V. Muse, 2005 Site-to-site
varia-tion of synonymous substituvaria-tion rates. Mol. Biol. Evol. 22:
2375–2385.
Kosakovsky Pond, S. L., S. W. D. Frost, and S. V. Muse,
2005 HyPhy: hypothesis testing using phylogenetics.
Bioinfor-matics 21: 676–679.
Kryazhimskiy, S., and J. B. Plotkin, 2008 The population genetics
ofdN/dS. PLoS Genet. 4: e1000304.
Lemey, P., V. N. Minin, F. Bielejec, S. L. Kosakovsky Pond, and M. A.
Suchard, 2012 A counting renaissance: combining stochastic
mapping and empirical Bayes to quickly detect amino acid
sites under positive selection. Bioinformatics 28: 3248–
3256.
Liberles, D. A., A. Teufel, L. Liu, and T. Stadler, 2013 On the need
for mechanistic models in computational genomics and
metage-nomics. Genome Biol. Evol. 5: 2008–2018.
McCandlish, D. M., E. Rajon, P. Shah, Y. Ding, and J. B. Plotkin,
2013 The role of epistasis in protein evolution. Nature 497:
E1–E2.
Meyer, A. G., and C. O. Wilke, 2015 Geometric constraints
dom-inate the antigenic evolution of influenza H3N2 hemagglutinin.
PLoS Pathog. 11: e1004940.
Meyer, A. G., S. J. Spielman, T. Bedford, and C. O. Wilke, 2015 Time
dependence of evolutionary metrics during the 2009 pandemic
influenza virus outbreak. Virus Evol. 1: vev006–vev010.
Mugal, C. F., J. B. W. Wolf, and I. Kaj, 2014 Why time matters:
codon evolution and the temporal dynamics ofdN/dS. Mol. Biol.
Evol. 31: 212–231.
Murrell, B., T. de Oliveira, C. Seebregts, S. L. Kosakovsky Pond, and
K. Scheffleret al., 2012a Modeling HIV-1 drug resistance as
episodic directional selection. PLoS Comput. Biol. 8: e1002507.
Murrell, B., J. O. Wertheim, S. Moola, T. Weighill, K. Scheffler
et al., 2012b Detecting individual sites subject to episodic di-versifying selection. PLoS Genet. 8: e1002764.
Murrell, B., S. Moola, A. Mabona, T. Weighill, D. Schewardet al.,
2013 FUBAR: a Fast, Unconstrained Bayesian AppRoximation
for inferring selection. Mol. Biol. Evol. 30: 1196–1205.
Muse, S. V., and B. S. Gaut, 1994 A likelihood approach for
com-paring synonymous and nonsynonymous nucleotide substitution rates, with application to the chloroplast genome. Mol. Biol.
Evol. 11: 715–724.
Nielsen, R., and Z. Yang, 1998 Likelihood models for detecting
positive selected amino acid sites and applications to the HIV-1
envelope gene. Genetics 148: 929–936.
Porto, M., H. E. Roman, M. Vendruscolo, and U. Bastolla,
2004 Prediction of site-specific amino acid distributions and
limits of divergent evolutionary changes in protein sequences.
Mol. Biol. Evol. 22: 630–638.
Ramsey, D. C., M. P. Scherrer, T. Zhou, and C. O. Wilke, 2011 The
relationship between relative solvent accessibility and
evolu-tionary rate in protein evolution. Genetics 188: 479–488.
Rocha, E. P. C., J. Maynard Smith, L. D. Hurst, M. T. G. Holden, J. E.
Cooperet al., 2006 Comparisons ofdN/dSare time dependent
for closely related bacterial genomes. J. Theor. Biol. 239: 226–
235.
Rodrigue, N., H. Philippe, and N. Lartillot, 2010 Mutation-selection
models of coding sequence evolution with site-heterogeneous
amino acidfitness profiles. Proc. Natl. Acad. Sci. USA 107: 4629–
4634.
Sella, G., and A. E. Hirsh, 2005 The application of statistical
phys-ics to evolutionary biology. Proc. Natl. Acad. Sci. USA 102:
9541–9546.
Figure 8 Inference results for simulations performed along empirical phylogenies (Table 1). (A) Pearson correlations between inferred and true
Spielman, S. J., and C. O. Wilke, 2015a Pyvolve: aflexible python module for simulating sequences along phylogenies. PLoS One 10: e0139047.
Spielman, S. J., and C. O. Wilke, 2015b The relationship between
dN=dS and scaled selection coefficients. Mol. Biol. Evol. 32:
1097–1108.
Spielman, S. J., K. Kumar, and C. O. Wilke, 2015 Comprehensive,
structurally-informed alignment and phylogeny of vertebrate biogenic amine receptors. PeerJ 3: e773.
Tamuri, A. U., M. dos Reis, and R. A. Goldstein, 2012 Estimating
the distribution of selection coefficients from phylogenetic data
using sitewise mutation-selection models. Genetics 190: 1101–
1115.
Thorne, J. L., S. C. Choi, J. Yu, P. G. Higgs, and H. Kishino,
2007 Population genetics without intraspecific data. Mol. Biol.
Evol. 24: 1667–1677.
Thorne, J. L., N. Lartillot, N. Rodrigue, and S. C. Choi,
2012 Codon models as vehicles for reconciling population
ge-netics with inter-specific data, pp. 97–110 inCodon Evolution:
Mechanisms and Models, edited by G. Cannarozzi, and A. Schneider. Oxford University Press, New York.
White, H., 1982 Maximum likelihood estimation of misspecified
models. Econometrica 50: 1–25.
Wolf, J. B. W., A. Kunstner, K. Nam, M. Jakobsson, and H. Ellegren,
2009 Nonlinear dynamics of nonsynonymousdN and
synony-mous dS substitution rates affects inference of selection.
Ge-nome Biol. Evol. 1: 308–319.
Yang, Z., 2006 Computational Molecular Evolution. Oxford
Uni-versity Press, London/New York/Oxford.
Yang, Z., and R. Nielsen, 2002 Codon-substitution models for
detecting molecular adaptation at individual sites along specific
lineages. Mol. Biol. Evol. 19: 908–917.
Yang, Z., and R. Nielsen, 2008 Mutation-selection models of
co-don substitution and their use to estimate selective strengths on
codon usage. Mol. Biol. Evol. 25: 568–579.
Yang, Z., and W. J. Swanson, 2002 Codon-substitution models to
detect adaptive evolution that account for heterogeneous
selec-tive pressures among site classes. Mol. Biol. Evol. 19: 49–57.
Yang, Z., W. S. W. Wong, and R. Nielsen, 2005 Bayes Empirical
Bayes inference of amino acid sites under positive selection.
Mol. Biol. Evol. 22: 1107–1118.
Yang, Z. H., R. Nielsen, N. Goldman, and A. M. K. Pedersen,
2000 Codon-substitution models for heterogeneous selection
pressure at amino acid sites. Genetics 155: 431–449.
0.0025 0.01 0.04 0.16 0.64
0.1 0.3 0.5 0.7 0.9
128 256 512 1024 2048 128 256 512 1024 2048 128 256 512 1024 2048 128 256 512 1024 2048 128 256 512 1024 2048
Number of Taxa
Correlation
Inference Method
SLAC1 FEL1 FUBAR1 SLAC2 FEL2 FUBAR2
No codon bias
A
0.0025 0.01 0.04 0.16 0.64
0.1 0.3 0.5 0.7 0.9
128 256 512 1024 2048 128 256 512 1024 2048 128 256 512 1024 2048 128 256 512 1024 2048 128 256 512 1024 2048
Number of Taxa
Correlation
Inference Method
SLAC1 FEL1 FUBAR1 SLAC2 FEL2 FUBAR2
Codon bias
B
Figure S1 Pearson correlation between true and inferred dN/dS across methods and simulation conditions. Data shown
in this figure corresponds to Πequal simulations. A) Correlation between true and inferred dN/dS for simulations with no
codon bias. B) Correlation between true and inferreddN/dS for simulations with codon bias. Note that certain FEL2 points
(B = 0.0025/N∈ {128,256}andB= 0.01/N= 128, for codon bias simulations) are not present because FEL2 generally failed
0.0025 0.01 0.04 0.16 0.64
−0.50 −0.250.00 0.25 0.50 0.75
128 256 512 10242048 128 256 512 10242048 128 256 512 10242048 128 256 512 10242048 128 256 512 10242048 Number of Taxa
Est. Bias
No codon bias A
0.0025 0.01 0.04 0.16 0.64
−0.50 −0.25 0.00 0.25 0.50 0.75
128 256 512 10242 128 256 512 10242 128 256 512 10242 128 256 512 10242 128 256 512 10242048 Number of Taxa
Est. Bias
Codon bias B
0.0025 0.01 0.04 0.16 0.64
−0.50 −0.250.00 0.25 0.50 0.75
128 256 512 10242 128 256 512 10242 128 256 512 10242 128 256 512 10242 128 256 512 10242 Number of Taxa
Est. Bias
No codon bias C
0.0025 0.01 0.04 0.16 0.64
−0.50 −0.25 0.00 0.25 0.50 0.75
128 256 512 10242 128 256 512 10242 128 256 512 10242 128 256 512 10242 128 256 512 10242 Number of Taxa
Est. Bias
Codon bias D
Inference Method SLAC1 SLAC2 FEL1FEL2 FUBAR1FUBAR2
Figure S2dN/dSestimator bias of each inference method inferred across simulation conditions. A) Πequalsimulations with no
codon bias. B) Πequalsimulations with codon bias and equal nucleotide frequencies. C) Πunequalsimulations with no codon bias.
D) Πunequal simulations with codon bias. Note that certain FEL1 and FEL2 points are not present in the figure for conditions
0.01 0.04 0.16 0.64
0.0 0.5 1.0 1.5
128 256 512 1024 2048 128 256 512 1024 2048 128 256 512 1024 2048 128 256 512 1024 2048 Number of Taxa
RMSD
No codon bias A
0.01 0.04 0.16 0.64
0.0 0.5 1.0 1.5
128 256 512 1024 2048 128 256 512 1024 2048 128 256 512 1024 2048 128 256 512 1024 2048 Number of Taxa
RMSD
Codon bias B
0.01 0.04 0.16 0.64
0.0 0.5 1.0 1.5
128 256 512 1024 2048 128 256 512 1024 2048 128 256 512 1024 2048 128 256 512 1024 2048 Number of Taxa
RMSD
No codon bias C
0.01 0.04 0.16 0.64
0.0 0.5 1.0 1.5
128 256 512 1024 2048 128 256 512 1024 2048 128 256 512 1024 2048 128 256 512 1024 2048 Number of Taxa
RMSD
Codon bias D
Inference Method SLAC1 SLAC2 FEL1 FEL2 FUBAR1FUBAR2
Figure S3RMSD of inferred from truedN/dSacross inference methods and simulation conditions. A) Πequalsimulations with
no codon bias. B) Πequalsimulations with codon bias and equal nucleotide frequencies. C) Πunequal simulations with no codon
bias. D) Πunequalsimulations with codon bias. Note that certain FEL2 points are not present in the figure for conditions where
0.01 0.04 0.16 0.64
0.0 0.5 1.0 1.5 2.0 2.5
128 256 512 1024 2048 128 256 512 1024 2048 128 256 512 1024 2048 128 256 512 1024 2048 Number of Taxa
Res
. V
ar
iance
No codon bias A
0.01 0.04 0.16 0.64
0.0 0.5 1.0 1.5 2.0 2.5
128 256 512 1024 2048 128 256 512 1024 2048 128 256 512 1024 2048 128 256 512 1024 2048 Number of Taxa
Res
. V
ar
iance
Codon bias B
0.01 0.04 0.16 0.64
0.0 0.5 1.0 1.5 2.0
128 256 512 1024 2048 128 256 512 1024 2048 128 256 512 1024 2048 128 256 512 1024 2048 Number of Taxa
Res
. V
ar
iance
No codon bias C
0.01 0.04 0.16 0.64
0.0 0.5 1.0 1.5 2.0
128 256 512 1024 2048 128 256 512 1024 2048 128 256 512 1024 2048 128 256 512 1024 2048 Number of Taxa
Res
. V
ar
iance
Codon bias D
Inference Method SLAC1 SLAC2 FEL1FEL2 FUBAR1FUBAR2
Figure S4 Variance in residuals for a linear model of inferreddN/dS regressed on true dN/dS across inference methods and
simulation conditions. A) Πequal simulations with no codon bias. B) Πequal simulations with codon bias and equal nucleotide
frequencies. C) Πunequal simulations with no codon bias. D) Πunequal simulations with codon bias. Note that certain FEL2
No codon bias Codon bias
FUBAR1 − SLAC1 FEL1 − SLAC1 FEL1 − FUBAR1 SLAC1 − SLAC2 FUBAR1 − FUBAR2 FEL1 − FEL2
0.00 0.05 0.10 0.15 0.20 0.00 0.05 0.10 0.15 0.20
Average Correlation Difference
Compar
ison
A No codon bias Codon bias
FUBAR1 − SLAC1 FEL1 − SLAC1 FEL1 − FUBAR1 SLAC1 − SLAC2 FUBAR1 − FUBAR2 FEL1 − FEL2
−0.2 −0.1 0.0 0.1 −0.2 −0.1 0.0 0.1
Average RMSD Difference
Compar
ison
B
Figure S5Pairwise comparisons of correlation strength and RMSD inference across methods, as determined through multiple
comparisons tests. Results shown correspond to Πequal simulations. A) Results for multiple comparison tests of correlation
No codon bias Codon bias 0.12 0.13 0.081 0.16 0.08 0.05 0.099 0.05 0.031 0.086 0.072 0.038 0.022 0.067 0.03 0.028 0.014 0.058 0.097 0.101 0.055 0.041 0.058 0.097 0.1 0.043 0.023 0.107 0.104 0.051 0.027 0.017 0.1 0.062 0.027 0.024 0.015 0.101 0.026 0.017 0.02 0.016 0.058 0.003 0.103 0.107 0.038 −0.011 0.077 0.152 0.057 0.024 0.014 0.119 0.091 0.033 0.016 0.071 0.116 0.057 0.021 0.012 0.109 0.062 0.022 0.013 0.009 0.089 0.229 0.126 0.11 0.132 0.085 0.149 0.112 0.062 0.114 0.108 0.091 0.043 0.135 0.085 0.068 0.032 0.037 0.07 0.099 0.144 0.085 0.056 0.08 0.113 0.08 0.059 0.066 0.088 0.095 0.073 0.049 0.076 0.097 0.072 0.076 0.032 0.078 0.102 0.072 0.066 0.025 −0.034 −0.012 0.097 0.199 0.053 −0.076 0.048 0.118 0.099 0.03 −0.031 0.079 0.142 0.059 0.015 0.026 0.089 0.085 0.051 0.003 0.065 0.149 0.059 0.035 0.001 0.0025 0.01 0.04 0.16 0.64 0.0025 0.01 0.04 0.16 0.64 0.0025 0.01 0.04 0.16 0.64 FEL FUBAR SLA C
128 256 512 1024 2048 128 256 512 1024 2048
Number of Taxa
Br
anch lengths
A No codon bias Codon bias
0.092 0.182 0.105 0.151 0.091 0.06 0.135 0.07 0.04 0.156 0.071 0.043 0.027 0.074 0.044 0.036 0.018 0.06 0.09 0.124 0.078 0.055 0.071 0.114 0.095 0.039 0.026 0.092 0.103 0.058 0.039 0.019 0.097 0.084 0.035 0.028 0.015 0.119 0.04 0.024 0.024 0.016 −0.061 0.032 0.112 0.15 0.052 −0.031 0.077 0.158 0.07 0.03 0.018 0.101 0.124 0.047 0.017 0.05 0.139 0.069 0.026 0.012 0.124 0.085 0.038 0.018 0.007 0.111 0.196 0.141 0.138 0.133 0.097 0.156 0.126 0.074 0.138 0.153 0.103 0.052 0.133 0.093 0.079 0.043 0.047 0.088 0.112 0.13 0.09 0.067 0.093 0.128 0.086 0.063 0.061 0.105 0.1 0.088 0.054 0.098 0.09 0.092 0.088 0.037 0.092 0.084 0.079 0.071 0.03 −0.024 −0.004 0.088 0.18 0.069 −0.013 0.038 0.133 0.109 0.043 −0.002 0.086 0.133 0.085 0.024 0.047 0.117 0.138 0.061 0.013 0.068 0.132 0.074 0.043 0.007 0.0025 0.01 0.04 0.16 0.64 0.0025 0.01 0.04 0.16 0.64 0.0025 0.01 0.04 0.16 0.64 FEL FUBAR SLA C
128 256 512 1024 2048 128 256 512 1024 2048
Number of Taxa
Br
anch lengths
B
−0.05 0.00 0.05 0.10 0.15 0.20 0.25 R difference
Figure S6Correlation differences between one-rate and two-rate inference frameworks across simulation conditions, specifically
for Πunequal simulations. Each cell indicates the average correlation increase from a two-rate to a one-rate platform, meaning
that red cells represent conditions where one-rate methods outperform two-rate methods. Correlations were compared using
paired t-tests, and significance was determined as Bonferroni-corrected P < 0.01. Bold values indicate that the difference is
0.01 0.04 0.16 0.64
0 1 2 3 4
0 1 2 3 4
0 1 2 3 4
0 1 2 3 4
256
512
1024
2048
0 1 2 3 0 1 2 3 0 1 2 3 0 1 2 3
dS estimate by FEL2
Density
Simulation set
No codon bias Codon bias
Figure S7 Inferred distributions of dS parameters by FEL2 for Πunequal simulations. Simulations with codon bias contained
0.0025 0.01 0.04 0.16 0.64
0.0 0.1 0.2
0.0 0.1 0.2
No codon bias
Codon bias
128 256 512 10242 128 256 512 10242 128 256 512 10242 128 256 512 10242 128 256 512 10242
Number of Taxa
Mean optimiz
ed br
anch length
Figure S8Optimized branch lengths across Πunequal simulations. For a given set of simulations using the same branch length,
0.0025 0.01 0.04 0.16 0.64
0.0 0.5 1.0
0.0 0.5 1.0
0.0 0.5 1.0
0.0 0.5 1.0
0.0 0.5 1.0
128
256
512
1024
2048
0.0 0.5 1.00.0 0.5 1.00.0 0.5 1.00.0 0.5 1.00.0 0.5 1.0 dN/dS, FEL1
dN/dS
, FEL2
No codon bias A
0.01 0.04 0.16 0.64
0.0 0.5 1.0
0.0 0.5 1.0
0.0 0.5 1.0
0.0 0.5 1.0
0.0 0.5 1.0
128
256
512
1024
2048
0.0 0.5 1.00.0 0.5 1.00.0 0.5 1.00.0 0.5 1.0 dN/dS, FEL1
dN/dS
, FEL2
Codon bias B
0.0025 0.01 0.04 0.16 0.64
0.0 0.5 1.0
0.0 0.5 1.0
0.0 0.5 1.0
0.0 0.5 1.0
0.0 0.5 1.0
128
256
512
1024
2048
0.0 0.5 1.00.0 0.5 1.00.0 0.5 1.00.0 0.5 1.00.0 0.5 1.0 dN, FEL1
dN, FEL2
No codon bias C
0.0025 0.01 0.04 0.16 0.64
0.0 0.5 1.0
0.0 0.5 1.0
0.0 0.5 1.0
0.0 0.5 1.0
0.0 0.5 1.0
128
256
512
1024
2048
0.0 0.5 1.00.0 0.5 1.00.0 0.5 1.00.0 0.5 1.00.0 0.5 1.0 dN, FEL1
dN, FEL2
Codon bias D
Figure S9Direct comparison ofdN/dSanddN estimates each between one-rate and two-rate frameworks. Results correspond
to a single Πunequal simulation replicate, for each simulation condition. Each panel compares either the pointdN/dS (A,B) or
dN (C,D) estimate for each simulation condition, with branch lengths from left to right and number of taxa from top to bottom.
048 048 048 048 048
0.0 0.5 1.0
amine vertrho camelid h3 hivrt
Dataset
Correlation
A
0 1 2 3
amine vertrho camelid h3 hivrt
Dataset
RMSD
B
Parameter dN dS