Circuits of Dynamically Interacting Sigma Factors in Single
Cells
Thesis by
Jin Park
In Partial Fulfillment of the Requirements For the Degree of
Doctor of Philosophy
California Institute of Technology Pasadena, California
2018
© 2017
Jin Park
Acknowledgements
I am indebted to my advisor Michael Elowitz for all his guidance. I first heard of Michael when I was an undergraduate and assigned his paperStochastic Gene Expression in a Single Cell . This paper sparked my interest in systems biology, and the seed of the idea that I might want to pursue this field. When I came to Caltech as a graduate student and met in Michael in person, I was struck by his zeal for pursuing new, innovative ideas and his relentless drive toward clarifying and defining elegant science. I learned from Michael that clear expression of ideas is equivalent to understanding those ideas, and I take away his many lessons on scientific pursuit and presentation. More personally, I’d like to thank Michael for his patience in guiding a naive graduate student through a complicated project. It couldn’t have been easy, and over the years I’ve become more aware of the thought he puts into mentoring. Thank you for the opportunity, this experience has been invaluable.
I would like to thank James Locke, a former postdoc who was my immediate mentor in the lab during my first two years. James trained me in the day of day to work of B. subtilis, and to this day I still use the basic lessons he showed me on data analysis. His supportive messages from abroad in Cambridge were much appreciated, especially because he offered support even after he had no longer official obligation to do so.
I also had the fortune of working with great summer and rotation students, Jihoon Lee, Kibeom Kim, and Suzy Beeler. It’s amazing how fun and easy things can be when you work with smart and hardworking people, and I thank them for all their insights and hard effort.
And to my Committee: Richard Murray, Paul Sternberg, and Lea Goentoro, I need to my express my thanks. It may not seem like much to you all, but your support has been valuable throughout this process.
Abstract
How do cells integrate multiple, dynamic genetic circuits? I study this question in the context of the alternative sigma factors of B. subtilis.
The first project proposes a novel mode of gene regulation called timesharing. The key idea is that a limited resource is shared dynamically in time. Here we show that the alternative sigma factors of B. subtilisuse dynamic sharing to share a limited supply of core RNA Polymerase (RNAP). We show that 5 alternative sigma factors activate in pulses, and that these pulses operate in a competitive regime. Interestingly, we found that pairwise correlations between these sigma factors contained a mixture of positive and negative correlations, whereas one may naively expect all correlations to be negative. We show with a mathematical model that competitive pulsing can lead to non-intuitive sets of mixed correlations.
The second project take a closer, quantitative look at sigma factor competition. Although competition between the housekeeping sigma and a single alternative sigma has been well studied, competition between alternative sigmas themselves has been relatively unexplored. To address this issue, we systematically investigated the pairwise competitive relationships between 7 alternative sigma factors in B. subtilis. The main experimental tool was a 7x7 ‘deletion’ matrix of strains, where every matrix strain was deleted for one sigma, and reported on another sigma via a fluorescent reporter. The deletion matrix revealed that competition is highly asymmetric. Deletion of any given sigma factor increased σ Wactivity,
but did not affect other sigma factors. These results are recreated by a minimal mathematical model of sigma factor competition, where importantly σW is relatively high in abundance but weak in affinity for
The third project reports a novel activator for alternative sigma factors. Alternative sigmas factors are activated by many forms of stress, such as nutrient limitation, temperature shifts, and molecular stresses like antibiotics. Here we show that surprisingly, cell lysis causes adjacent cells to specifically activate σ X.
This cell lysis-σX response is a general phenomenon, as it is observed under multiple experimental
conditions. We show this relationship between cell death and σX is causal, since harvested cell extract
activates σX. Finally, we hypothesize that cell death and σX play an important role in biofilm wrinkle
PUBLISHED CONTENT AND CONTRIBUTIONS
Park J, Dies M, Lin Y, Hormoz S, Smith-Unna SE, Quinodoz S, Hernández-Jiménez MJ,
Garcia-Ojalvo J, Locke JCW, Elowitz MB. Molecular Time Sharing through Dynamic Pulsing in Single
Cells. Cell Syst. 2018 Mar 28;6:1-14. doi: 10.1016/j.cels.2018.01.011
J.P participated in conception, experiments, analysis, mathematical modeling, and writing
of the manuscript.
Contents
Chapter 1. Introduction 1
1.1 Molecular time-sharing through dynamic pulsing in single cells 1
1.2 σW creates asymmetry in sigma factor competition 5
1.3 Cell death activates σX in neighboring cells, a novel mode of activation for sigma factors 7
Chapter 2. Molecular time-sharing through dynamic pulsing in single cells 9
2.1 Abstract 9
2.2 Introduction 9
2.3 Results 12
2.4 Discussion 22
2.5 Supplementary Figures 24
2.6 Assessing sigma factor correlation with RNA FISH 32
2.6.1 Introduction 32
2.6.2 Results 33
2.6.3 RNA FISH Protocol 36
2.7 Materials and Methods 39
2.7.1 Table of Strains and Plasmids 39
2.7.2. Strain and Plasmid Construction 41
2.7.3. Microscopy and Sample Preparation 44
2.7.4 Quantification and Statistical Analysis 53
Chapter 3 σW creates asymmetry in sigma factor competition 59
3.1 Results 59
3.2 Discussion and Future Directions 65
3.3. Materials and Methods 68
Chapter 4. Cell death activates σX in neighboring cells, a novel mode of sigma activation 72
4.1 Introduction 72
4.2 Results 72
4.3 Future Directions 76
4.4 Materials and Methods 79
Chapter 5 Conclusion 80
5.1 Summary 80
5.2 Future Work 81
Chapter 1. Introduction
I divide this Introduction into 3 parts, each part an Introduction for Chapters 2-4 of this thesis. Chapters 2-4 are the 3 main projects I present, which are:
1) Molecular time-sharing through dynamic pulsing in single cells 2) σW creates asymmetry in sigma factor competition
3) Cell death activates σX in neighboring cells, a novel mode of sigma factor activation
1.1 Molecular time-sharing through dynamic pulsing in single cells
In the 1960’s, it had been shown that mixing purified RNA Polymerase (RNAP) with double-stranded DNA and ribonucleoside triphosphates in a test tube would result in RNA synthesis1. These experiments
were exciting because they suggested a key fact now taken for granted, that RNAP performs the first step of the central dogma, transcribing DNA into messenger RNA (and that’s why the enzyme was so named). This discovery of RNAP’s central function opened up another important question: how does RNAP discriminate among different target DNA sites in vivo?
A clue to answering this question came from Richard Burgess and Andrew Travers in 1969, when they showed that a subunit of RNAP in E. coli, which they deemed sigma factor, was responsible for promoter recognition2. In their discussion they hypothesized that “switching sigma factor could provide the
This hypothesis was borne out when the first alternative sigma factor was identified by Richard Losick’s group in soil bacterium Bacillus subtilis in 19793,4. They critically took advantage of B. subtilis cells’
ability to turn into spores, hypothesizing that if alternative sigma factors existed, sporulation would represent an ideal space to identify them, as sporulation would likely utilize a very different set of sigma factors versus those used in exponential growth. This study resulted in the first identification an
alternative sigma factor, named σB. The alternative sigma factor stands in contrast to the housekeeping
sigma factor, σA, which is active during exponential growth (and which was first purified by Robert Tijan
and Richard Losick5)
In subsequent decades, a total of 17 alternative sigma factors have been identified in B. subtilis, and each sigma factor is associated with different functions. Five of these 17 sigma factors are associated with sporulation, and the remaining 12 are associated with a variety of stress conditions. These sigma factors are generally inactive when cells are grown in rich media, and turn on in response to their cognate stresses. For instance, σB is known as the general stress response factor because it activates in response to
variety of stresses, including heat, pH, and osmotic stress6. In contrast, other sigma factors respond to a
more limited set of conditions. For instance, σV responds to lysozyme, an antimicrobial peptide, but does
not otherwise activate in response to a variety of other stresses7,8.
stress, the anti-sigma factor releases the sigma factor such that the sigma factor is bound. There are a variety of molecular mechanisms by which the anti-sigma factor ‘releases’ the sigma factor. For instance, the anti-sigma factor of σ W is proteolytically degraded9,10. In contrast, the anti-sigma factor for σ D is
exported from the cell.
In addition, it has become appreciated that core RNAP may exist in limited supply in B. subtilis. Michael Hecker’s group performed single cell proteomics on B. subtilis and found that measured the concentration of RNAP was less than the total concentration of sigma factors in single cells 11. In a functional approach
to study sigma factor competition, a paper from Carol Gross’s group demonstrated that overexpression of σA downregulated the activity of another sigma, σ H, a result consistent with competition 12. Outside of B.
subtilis, many papers have demonstrated in E. colithat overexpression or underexpression of one sigma results in the opposite effect in another sigma, another result that suggests sigma factors compete13–15.
RNAP is not the only core enzyme that may shared inside the cell. Other examples of shared core enzymatic machinery include protein degradation complexes and the ribosome. Here we study how cells approach the problem of a limited resource in the context of the alternative sigma factors of B. subtilis, which share a common pool of core RNAP.
Studies of sigma factor competition typically assume that sharing of RNAP is static 16,17. In these studies,
the proportion of core RNAP taken up by any given sigma class is relatively constant over time. However, previous work from our lab has shown that sigma factor activity can be time-dynamic 18. That sigma
Here we propose a novel mode of sharing, which we call timesharing. In timesharing, a single class of sigma takes up most of the available RNAP for some set amount of time, and then switches to another class of sigma taking up most of available RNAP, and then this process repeats itself. This represents a completely different approach to sharing a limited resource, since at any given moment of time, most of the resource is devoted towards a single agent, rather than being spread across multiple agents.
The experimental stress we use to induce sigma factors is the small molecule Mycophenolic Acid (MPA), which critically activates at least 5 classes of alternative sigma factors. And in this condition we make three claims that together constitute Timesharing:
1) Sigma factors activate in pulses. We follow 5 sigmas’ transcriptional dynamics with fluorescent reporters and single cell microscopy, and show sigmas’ activities in MPA is dynamic in time. Pulsing is a key feature of the time dynamic nature of Timesharing.
2) Sigma factors compete for core RNAP. We present data that sigma factors compete for limited amounts of core RNAP in our conditions.
3) Sigma factor pulses present with a mixture of negative and positive correlations. The negative correlations between sigma pulses represent different sigma classes accessing core RNAP at different times. With regards to the positive correlations, we show with a mathematical model that counter-intuitively, positive correlations can also arise in a timesharing system.
complex circuits may begin to deplete common cellular resources. Finally, we emphasize that timesharing does not contradict previously reported modes of sharing core RNAP. Cells may choose different regulation modes in different contexts.
1.2 σ
Wcreates asymmetry in sigma factor competition
Although the literature on sigma factor competition is extensive, it is mostly focused on competition between the housekeeping σ70(of E. coli) and one other alternative sigma. The underlying reason is that
the main question in the literature has been, how do alternative sigmas snatch away disproportionate amounts of RNAP from σ 70 as cells transition to stationary phase? Thus there are studies on competition
between σ70 and σ38, σ70 and σ32 , and σ70 and σ54 13,15,19,20, but few studies on competition between
alternative sigmas. In addition, much of the literature is focused on small molecules or proteins that can shift the balance between σ70and the alternative sigmas, such as ppGpp and DksA 21. But although a few
studies acknowledge competition between alternative sigmas can exist15, how alternative sigmas compete
against each other has largely been unexplored.
In addition, the vast majority of studies on sigma competition have been in E. coli, but the number of papers on competition in B. subtilisare quite few. In fact, I could only find 3 papers in sigma competition in B. subtilis. Two papers from Michael Hecker’s group showed that in some media conditions, the total concentration of all sigmas exceeded that of core RNAP 11,12,22. And another study from Carol Gross’s
group showed that overexpression of the housekeeping σA decreased activity of a σH reporter12.
Although the numbers make competition plausible, they do not imply it outright. A complicating issue is that is unclear how many of the measured sigmas are functionally active. For instance, many sigmas have cognate anti-sigmas, which would lower the number of sigmas actively attempting to bind RNAP. One might then imagine considering the quantity N RNAP − Σ(Nσ−Nanti−σ ), i.e. comparing the number of core RNAP molecules to the total number of sigmas minus the total number of antisigmas. However, the situation is even further complicated by the presence of anti-anti-sigmas 23, many of whom are only
putative24. Do to these issues, any measurements of molecule numbers are ideally accompanied by
functional experimentsin vivo, where one shows that perturbation of sigma, by under or overexpression, has the opposite effect on another sigma.
An example of such a functional experiment is the result that σAoverexpression decreases activity of a σ
H
reporter12. But although this result is consistent with competition, it does not completely rule out other
possible mechanisms. For instance, this effect could be due to a σ Atarget gene antagonizing σ Hactivity.
For instance, in E. coli σ38drives transcription of rsd, an anti-sigma for σ
7014. To be fair, there is no known
such antagonist between σ Aand σH. But nevertheless, there are many possible pleiotropic effects besides
competition that could account for the result that σA overexpression decreases σH activity.
There are at least 3 ways around this problem of pleiotropic effects when studying competition:
1) Overexpress a sigma factor whose DNA binding site is mutated such that it can no longer bind it cognate DNA site, but whose RNAP binding site is intact.
2) Study sigma factor competition in a cell extract system, e.g. TX-TL25
These approaches are not mutually exclusive, and would provide multiple, supporting lines of evidence.
In this project, I take the 3rd strategy, and set out to answer whether 1) sigma factors compete in B. subtilis, and 2) if so, how alternative sigmas compete against each other. I consider 7 alternative sigmas of B. subtilisactivated by a single stress condition, namely the drug Mycophenolic Acid (MPA). I study how these 7 sigmas interact in vivovia a ‘deletion’ matrix, in which I measure how the activity of any given sigma responds to the effect of deleting any other sigma. In this way, I systematically study all 42 pairwise relationships between 7 sigmas, which represents widespread, quantitative study of sigma factor competition.
The main claims are:
1) The deletion matrix reveals that deletion of any sigma increases σW activity.
2) A minimal mathematical model competition recreates the results of the deletion matrix. 3) Finally, as this is a work in progress, I discuss the future direction of this project.
1.3 Cell death activates σ
Xin neighboring cells, a novel mode of
activation for sigma factors
There are two broad categories of sigma factors, the ‘housekeeping’ sigma and the ‘alternative’ sigma factors. Each bacterial species has one type of housekeeping sigma, e.g. σ70in
E. colior σAin
B. subtilis,
and this housekeeping sigma is responsible for most basal transcription inside the cell26.
simply because they are not the housekeeping sigma. And unlike the housekeeping sigma, these alternative sigmas typically are not active in rich media conditions, and activate in response to stress27.
The literature has identified a wide variety stress conditions that activate alternative sigmas. A commonly studied stress condition is stationary phase of bacterial growth, during which B. subtilis activates the general stress response sigma σ B28. In addition, nutrient limitation can induce sigma activity, e.g. nitrogen
deprivation activates σY . And heat shock activates σ
B, while cold shock activates σL
29,30. Small molecules
or proteins are another major class of activators, and examples include: lysozyme induces σ V31, cell wall
antibiotics induce σW and σM32 , branched chain amino acids induce σL33.
Here I present a novel activator of sigma factors. I report that cell lysis causes adjacent cells to activate σX, a previously unreported activator for σ Xand more broadly for sigma factors. This effect is independent
of the cause of cell lysis, i.e. this effect exists in multiple experimental conditions. In addition, isolated cell extract activates σX, suggesting that cell lysis contains some chemical(s) or agent(s) that is a σ X
activator. This effect is specific to σX, as cell lysis only has minimal effects on other sigmas.
The identity of the chemicals inside cell extract that activate σ X is an open question. Previous studies
implicate multiple possible roles for σX. σ Xhas been implicated in defense against cationic antimicrobial
peptides, and also against H2O2 34However, these roles overlap with other sigma factors. The identity of
the cell extract agent may not reflect either of these 2 possibilities and may be something else entirely.
Finally, I hypothesize and discuss how cell death and σ Xmay play a major role in wrinkle formation of
Chapter 2. Molecular time-sharing through dynamic
pulsing in single cells
2.1 Abstract
In bacteria, alternative sigma factors regulate diverse stress responses and developmental programs. Sigma factors share a common pool of core RNA polymerase (RNAP). Sharing has been assumed to occur through partitioning of RNAP molecules among sigma factors. Using quantitative time-lapse microscopy, we analyzed sigma factor activity dynamics in individual Bacillus subtiliscells under energy stress conditions. We found that multiple alternative sigma factors activated in ~1 hour pulses in a stochastic and repetitive fashion. Analysis of sigma factor pairs revealed that two sigma factors rarely pulse simultaneously, and some pairs are anti-correlated. These results indicate that alternative sigma factor species effectively ‘time-share,’ or take turns utilizing, RNAP. Mathematical modeling revealed how time-sharing can emerge from noise-driven pulse-generating gene circuits actively competing for RNAP. Time-sharing provides a mechanism for cells to dynamically control the distribution of cell states within a population. Since core molecular components are limiting in many other biological systems, time-sharing may represent a general mode of regulation.
2.2 Introduction
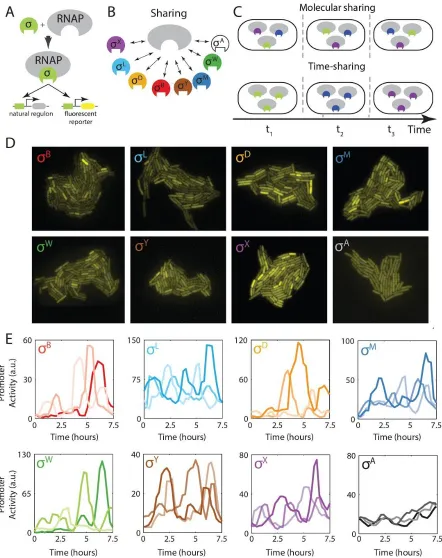
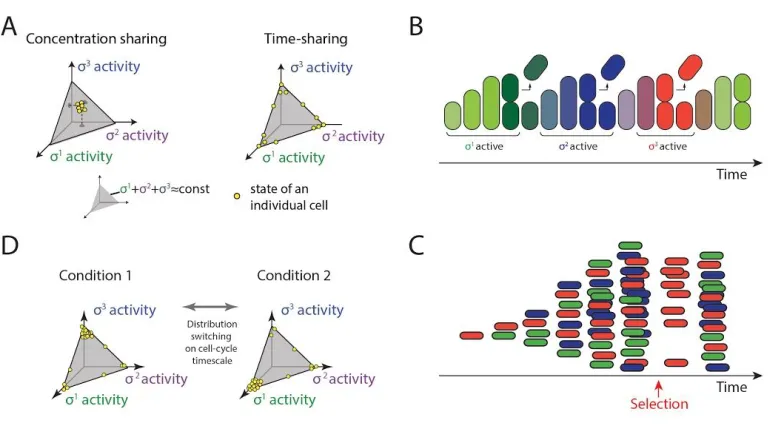
time-sharing system, the core component would effectively take turns, interacting predominantly with only one or a few of its many potential partner species at any given time (Figure 1C). Despite the familiarity of time-sharing strategies in engineered systems such as computers and communication networks, it is unknown whether, or how, time-sharing could occur in cells.
In bacteria, alternative sigma factors represent a classic example of molecular sharing. They function as subunits of the RNA polymerase holoenzyme, directing it to specific sets of target promoters 28,32,35–37
(Figure 1A). Alternative sigma factors are typically regulated through cognate anti-sigma factors, which prevent their association with core RNAP. These anti-sigma factors can be inhibited by stresses to enable sigma factor activation 38. Recently it was shown that the alternative sigma factor σ BinBacillus subtilis is
activated in a sustained series of stochastic pulses in response to energy stress 17,18. These pulses represent
events in which many σ Bmolecules simultaneously become active, associate with core RNAP to initiate
transcription of target genes, and then deactivate. However, σ Bis only one of 17 alternative sigma factors
inB. subtilis 38(Table S1). It has remained unclear whether pulsing is specific to σ
Bor occurs across the
species could share core RNAP either in concentration (molecular sharing, top) or in time (time-sharing, bottom). Only 3 distinct species are shown here for simplicity. ( D) Fluorescent reporter expression shows heterogeneous activation of seven alternative sigma factors, as indicated, and homogeneous activation of σ A(bottom right) under
energy stress conditions. (E) The heterogeneous expression of YFP in D reflects pulsing of alternative sigma factors, but not the housekeeping sigma factor σA, whose activity was more constant. Each plot shows sigma
factor activity time traces derived from analysis of the rate of production of corresponding fluorescent reporter genes in 3 different cell lineages (different line shades).
2.3 Results
To address these issues, we constructed a set of reporter strains, each containing a fluorescent protein gene specifically activated by one of the B. subtilis alternative sigma factors not involved in sporulation (Figure 2.1A and 2.S1A, Table S1). We analyzed these strains in a minimal medium containing 40 µg/ml mycophenolic acid (MPA), a drug that reduces cellular ATP levels and stimulates a broad energy stress response 39(Figure 2.S1B). Single-cell analysis of these reporter strains revealed markedly heterogeneous
activation of seven alternative sigma factors in these conditions (Figure 1D). The distributions of fluorescent protein expression exhibited long tails for some sigma factors (Figure 2.S1C), similar to those previously observed under conditions of pulsatile activation of σ B18. In contrast, the housekeeping sigma
factor σA, which has higher affinity for core RNAP and lacks an anti-sigma factor 40, was activated in a
more homogeneous manner, suggesting that this type of heterogeneous activation was not general to all sigma factors (Figures 2.1D and 2.S1C).
STAR Methods). This activity reflects the rate at which free sigma factor (not sequestered by its cognate anti-sigma factor) can associate with available core RNAP and initiate transcription at target promoters. It therefore depends on sigma factor protein levels, anti-sigma factor levels, and the availability of core RNAP. This analysis revealed that the seven alternative sigma factors mentioned above were activated in a pulsatile fashion (Figures 2.1E and S1D). Pulses appeared to be generated stochastically, as no significant correlations were observed in sister cell pairs (Figure S2A), or between a parent cell and its two daughters (Figure 2.S2B). Widespread stochastic pulsing of this type was not specific to MPA-induced stress, as stationary phase conditioned media also caused pulsing of many sigma factors (Figure 2.S3A), which did not require σB, a factor previously shown to pulse (Figure 2.S3B) 18.
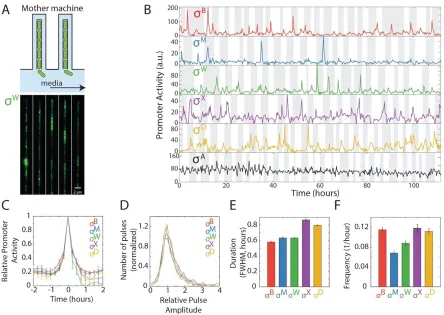
Figure 2.2. Five alternative sigma factors exhibit pulsatile dynamics over extended timescales in the mother
machine. (A) The mother machine microfluidic device enables long-term analysis of a single cell lineage, as a
averaged (n≥320). (D) Distribution of normalized pulse amplitudes for the indicated sigma factors. (E) Mean pulse durations, quantified as full-width at half maximum (FWHM) for each of the sigma factors. (F) Pulse frequencies for the indicated sigma factors.
We next sought to characterize the pulse dynamics more precisely. Because pulses occur much less than once per cell cycle, this required analysis over many generations. Exponential accumulation of cells on agarose pads limits the number of generations that can be analyzed, and leads to non-stationary environmental conditions. To circumvent these issues, we turned to the mother machine, a microfluidic device that enables analysis of a single cell over many cell division events 43–45 (Figure 2.2A). In the
mother machine, we observed qualitatively similar dynamics as on agarose pads, with 5 alternative sigma factors exhibiting pulsatile behavior (Figure 2.2B), with strikingly similar pulse shapes (Figure 2.2C) and amplitudes (Figure 2.2D). Pulse had durations on the order of 1 hour (Figure 2.2E) and varying frequencies (Figure 2.2F). σY and σ
L were not active under these conditions, and were therefore not
considered further.
is part of the sigma operon (Figures 2.3B and 2.S4B). These results show that the simple sigma/anti-sigma operon architecture is capable of generating pulsatile dynamics under physiologically reasonable conditions.
We next asked how multiple pulsatile sigma factor species interact dynamically under conditions of limiting RNAP. We expanded the model to include five identical, but orthogonal, pulsatile sigma factor systems (Figure 2.3C). Additionally, to represent the constitutive, non-pulsatile σ A (Figure 2.1E), the
model also incorporated an additional sigma factor species with no anti-sigma factor. All sigma factors were coupled to one another exclusively through competition for limiting amounts of shared core RNAP (STAR methods). Such competition has been established in previous work 12,46–48, and is further supported
by experiments in which ectopic expression of σ B repressed σW and σD activity under these conditions
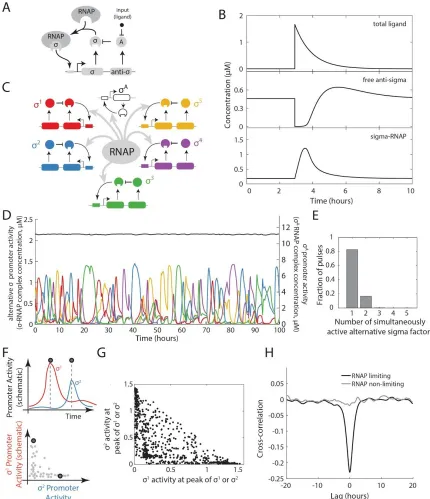
Figure 2.3. A mathematical model shows time-sharing in alternative sigma factor dynamics. (A) Schematic of model of a single pulsatile alternative sigma factor species. The sigma factor autoregulates its own operon, which contains genes for the sigma factor and its cognate anti-sigma factor. An input, taken to be a small molecule ligand (black dot), induces pulses by inhibiting the sigma factor inhibitory activity of the anti-sigma factor. (B) The simple sigma factor model can generate a pulsatile response to a sudden increase in ligand. (C) Multiple alternative sigma factor circuits identical to the one in (A), along with a constitutive sigma factor representing σA, are coupled through sharing of core RNA polymerase (gray arrows). (D) The multi-sigma factor
pulses in the dynamics shown in (D). Most of the time, only one or two alternative sigma factors are active simultaneously. (F) Quantifying the co-occurrence of pulses (schematic). A pulse detection algorithm (Figure S1D) recognizes pulses in either of two sigma factors (vertical dashed lines, upper panel). Sigma factor activities at these points can then be plotted, as shown in lower panel. (G) Pulse amplitudes for all detected events, plotted as in the lower panel of F. Note the diagonal edge, representing the constraint of fixed total RNA polymerase. (H) Cross-correlation functions between the activities of two alternative sigma factors show anti-correlation between pairs of sigma factors when RNA polymerase is limiting (black) but not when it is in excess (gray).
The model generated pulsatile dynamics for each of the alternative sigma factors, and an approximately constant activity for σA, consistent with experiments (Figures 2.3D and 2.S5D). In this regime, nearly all
core RNAP not bound to σ A was occupied by just the 2 most active alternative sigma factors (Figure
2.3E). Furthermore, the sigma factors actively excluded one another, suppressing simultaneous pulses of multiple sigma factors (Figures 2.3F,G), and generating an overall anti-correlation in their activity when RNAP was limiting but not when it was in excess (Figure 2.3H). These anti-correlations arise because each sigma factor pulse reduces the amount of core RNAP available for other sigma factors over a typical pulse duration (~1 hour). Subsequent termination of the pulse causes the sigma factor to relinquish core RNAP, allowing other sigma factors to initiate pulses (Figure 2.S4B,2.S5D). While the overall rate of pulsing in this parameter regime is controlled by underlying stochastic inputs, represented in the model by ligand species, the exclusion of simultaneous pulsing results from competition for core RNAP. These modeling results show that time-sharing dynamics can emerge from the combination of pulsatile activation dynamics from individual sigma factor operons and coupling through competition for core RNAP.
The matrix also included ‘diagonal’ strains containing two distinguishable reporters for the same sigma factor to establish the upper limit of possible correlation 49. Finally, all strains contained a third
fluorescent protein (mCherry) reporter for σAactivity (see STAR Methods). Using the mother machine,
we recorded movies of individual cells from each of these 15 strains (Figure 2.4B). We then quantified mean fluorescence and protein production rates for all reporter pairs over time in each individual cell lineage (Figure 2.4C).
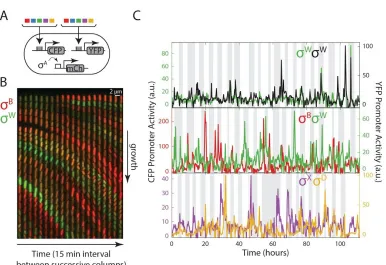
Figure 2.4. A matrix of multi-reporter strains enables analysis of dynamic correlations between different
alternative sigma factors. (A) A matrix of strains, each of which contains a chromosomally integrated CFP
reporter for one sigma factor and a chromosomally integrated YFP reporter for another, along with mCherry under the control of σ A. (B) Filmstrip from a mother machine movie, showing one lane at 15 minute intervals.
PB-CFP is shown in red, overlaid with P W-YFP in the green channel (see Movie S3). Anti-correlations between
channels are apparent from the lack of cells showing similar intensities in green and red channels (i.e. yellow cells). (C) Typical traces showing the dynamics of different pairs of alternative sigma factors, including strains with two reporters for the same sigma factor (top), and other pairs (lower 2 panels).
correlations (Figure 2.5A). By contrast, 4 of the 10 off-diagonal strains showed negative correlation between two different sigma factors, as predicted by the model (Figure 2.5A,B). These negative correlations were striking, given the many factors expected to positively correlate the signals, including extrinsic fluctuations in cell growth rate and global gene expression parameters (e.g. transcription and translation efficiencies) 49–53, and the co-activation of multiple sigma factors by overlapping stresses,
including MPA 18,39. The same negative correlations also appeared when using a “pulse-triggered
averaging” approach that specifically focuses on pulses 54 (Figure 2.S6). Of the remaining 6 pairs, 5
Together, these results provide strong evidence for time-sharing under these conditions, but they also reveal a complex dynamical structure. This can be seen in the correlation graph (Figure 2.5B), where no two sigma factors share the same pattern of correlations with other sigma factors 55. Even σBand σD,
which show similar (though not identical) interactions with the other sigma factors, are anti-correlated with one another. Could such dynamic complexity arise from competitive interactions between sigma factors? To address this question, we constructed a minimal, analytically solvable model of sigma factors competing for a common pool of core RNAP, dispensing with the regulatory features incorporated in the computational model discussed above (Figure 2.S7A). We solved this model for an arbitrary number of sigma factors under the simplifying assumption of small equilibrium fluctuations (see STAR Methods). We obtained analytical expressions for the cross-correlation functions between all sigma factor pairs in terms of the binding/unbinding rates of the sigma factors to core RNAP and their abundances. These results show that competitive binding interactions alone are sufficient to generate complex correlation graphs with mixtures of positive and negative correlations (see STAR Methods). For example, in the case of three sigma factors, it is possible for two of the sigma factors, σ1and σ
2, to exhibit positive correlations
with each other, and negative correlations with σ 3 (Figure 2.S7B,C). This occurs when σ3has slower
binding and unbinding rates to core RNAP compared with those of the other two. In this regime, the fraction of core RNAP bound by σ 3 fluctuates at a time scale longer than that of the other two sigma
factors. At shorter time scales, σ 1and σ 2are both more likely to be found bound to core RNAP when the
fraction of bound σ3is lower than its steady state value, resulting in a positive correlation between σ
1and
σ2 (Figure 2.S7D). The analytical minimal model thus demonstrates that complex correlation patterns,
2.4 Discussion
Time-sharing causes cells to focus the limited resource of core RNAP on a few alternative sigma factor regulons at a time, rather than spreading it across all sigma factors at lower, constant levels (Figure 2.1C). Consider three hypothetical alternative sigma factors. With molecular sharing, all cells would exhibit relatively similar phenotypic states, with intermediate activities of each sigma factor, constrained by the total amount of core RNAP (Figure 2.6A, left simplex). By contrast, time-sharing causes sigma factor activities to mainly occupy the edges and vertices of the allowed state-space (Figure 2.6A, right simplex), and to dynamically transition from one such state to another in a stochastic fashion.
Figure 2.6. Time-sharing affects the distribution of cell states in a population. (A)Two distinct modes of
pulses, the distribution of cell states can recover within a cell cycle from a perturbation to the cell state distribution (red arrow).(D)In the time-sharing system, dynamic switching among states enables changes to the environment to rapidly shift the population from one distribution to another (left and right spaces, schematic).
Because the pulse durations observed here, of ~1 hour, are comparable to the duration of the cell cycle, time-sharing can cause successive cell cycles to be dominated by different sigma factor programs and corresponding phenotypes (Figure 2.6B). Because of the stochastic nature of pulsing, this distribution is dynamic, allowing cells to control the distribution of activity states in the population, and regenerate the entire distribution of states after a perturbation (Figure 2.6C,D). The time-sharing dynamics observed here could thus enable cells to implement a multi-dimensional bet-hedging system in which environmental conditions modulate the relative numbers of cells in which different sigma factor combinations are active
56–59. Bet-hedging strategies can be advantageous when future events are uncertain 60and have been shown
to evolve in variable environments 61. Pulsatile time-sharing could also provide other functional
capabilities such as avoiding conflicts between incompatible regulatory programs, and increasing coordination of target operons by concentrating most target gene expression into brief periods of high sigma factor activation 62–65.
Time-sharing strategies are common solutions to the allocation of limited resources in diverse contexts. For example, time division multiplexing is used in communication systems to share limited bandwidth by switching among different users 66. Similarly, time-sharing computer systems were developed to increase
the efficiency of a core processor when the activities of individual users fluctuate 67. Because many
2.6 Assessing sigma factor correlation with RNA FISH
2.6.1 Introduction
Here I describe my efforts to use RNA Fluorescence In Situ Hybridization (FISH) to answer whether pairs of sigma factors are anti-correlated in their activities. Anti-correlation between sigma factors, as described previously in this chapter, is a central component of timesharing.
I will start by describing the historical context for these FISH experiments. I had previously measured correlations between sigma factor activities using the ‘matrix’ of fluorescent reporter strains, where each strain reports on 2 alternative sigma factors using yfp and cfp (this is the same matrix described in this chapter). These matrix strains were grown in liquid culture with 40 µg/ml Mycophenolic Acid (MPA),
and then spotted onto agarose pads for microscopy. Quantification of the fluorescent signals revealed that
sigma factors did not reveal any anti-correlation.
However, the absence of anti-correlation was not definitive. There is an an important limitation to this
experiment, which is that the yfp and cfp proteins are stable. This stability could lead to obscuring of any
weak negative correlations. To illustrate, let us consider the following scenario: Consider 2 sigma factors
σ1 and σ
2, where they drive yfp and cfp expression respectively. And let’s say that a σ 1 pulse was
immediately followed by a σ 2 pulse, where importantly the two pulses do not overlap. The σ 1 and σ 2
pulses lead to production of yfp and cfp protein. But since these are 2 proteins are stable, they hang
around in the cell even when their respective pulses that generated have since ceased, meaning this cell
has both high yfp and cfp signal even though the underlying σ 1and σ 2pulses did not overlap at all. In
plausibility of this effect. Although the intuition behind this caveat is quite believable, whether the caveat
would have strong enough effects to erase underlying negative correlation would be better demonstrated
with a model.
Yet this was the caveat that led to the birth of the RNA FISH experiments. The key idea in these
experiments is that transcripts in bacteria are relatively unstable, with a half-life of ~5-10 minutes. In
addition, RNA FISH can quantify at least 4 different kinds of transcripts per cell by using different
fluorescent dyes, and even hundreds of transcripts with multiplexing.
2.6.2 Results
The first step in this subproject was to establish the RNA FISH protocol in B. subtilis. Although this
protocol has previously been described in B. subtilis, many protocols leave out key details and thus are
difficult to execute from scratch. Yet after many months and several people’s help, we were able to
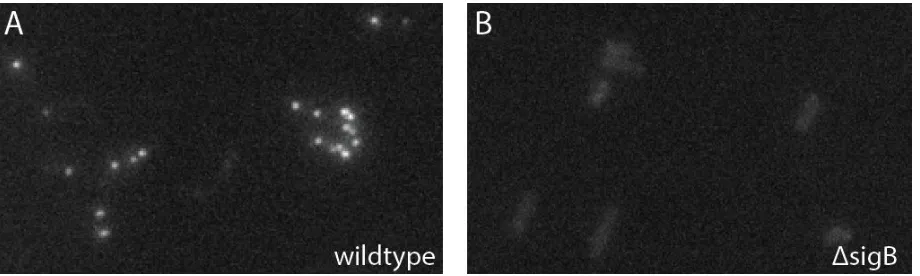
successfully run RNA FISH in our B. subtilis strains (Figure 2.6.1)
Figure 2.6.1. FISH specifically detectssigB transcript.(A) FISH signal from cells hybridized with probes that
FISH probes were linked to Alexa 647.
Using this protocol, we next asked whether σB and σ
W activities are anti-correlated when assayed by
FISH. To answer this question, we took the matrix strain ‘PB-cfp,PW-yfp’ and grew it in SMM plus 40
µg/ml MPA. Then we ran the FISH protocol to measure the cfp and yfp transcripts levels, which
respectively reflect σB and σW activity (Figure 2.6.2).
The resulting data were quantified by first automatically segmenting individual cells on the phase channel
images. From each cell, we quantified the transcript levels by taking the difference between the 95th
percentile pixel brightness and the 50th percentile pixel brightness in the cell. We visually confirmed that this metric reflects the total number of transcripts per cell. The resulting scatter plot had a characteristic ‘L-shape’, suggesting that σB and σW do not typically pulse together (Figure 2.6.2B). To answer
statistically whether σBand σ
W are in fact anti-correlated, we employed the Fisher Exact Test, which is a
categorical statistical test that can assess anti-correlation. When we applied it, however, we found that no evidence of anti-correlation (Figure 2.6.2B).
The intuition behind this result can be found in the low frequency effect. The scatter in Figure 2.6.2B
contains very few points in the upper right quadrant, where the upper right quadrant represents cells that
are pulsing in both sigmas. However, the expectednumber of points in the upper right is also very low,
the frequency of high signal points in either sigma is very low. So although we don’t see many cells
pulsing together, we don’t expect that many cells anyway. One might argue that the statistical power of
the test is then low. However, the number of cells assayed in (Figure 2.6.B) is ~40,000. I argue that
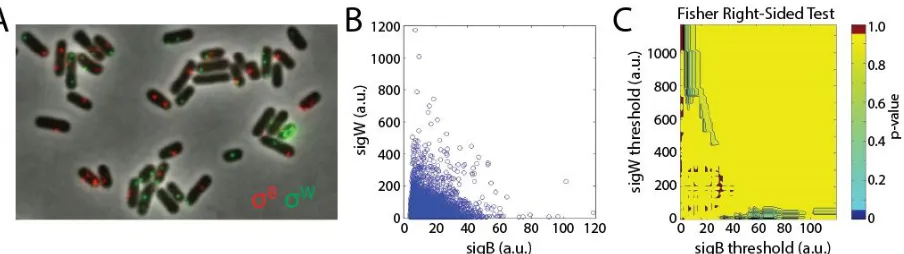
Figure 2.6.2. σ B and σWactivity are not anti-correlated when assayed with FISH.(A) Sample image from FISH against cfp and yfp transcripts in the matrix strain ‘P B-cfp,PW-yfp’. We probed against the fluorescent
reporter transcripts rather than the endogenous sigB and sigW transcripts, since the cfp and yfp transcripts represent more pure reporters of σ B and σ Wactivity, respectively. Thecfp andyfpprobes were bound to Alexa 555
and Alexa 647, respectively. (B) Scatter plot of single cell σ Band σ Wactivity as measured by FISH. Each circle in
the scatter represents a single cell. The signal from each cell was quantified by taking the difference between the 95th percentile pixel brightness and the 50th percentile pixel brightness in the cell. There are ~40,000 cells in the scatter. (C) P-values from a right-sided Fisher exact test are plotted. We ran the on the Fisher exact test on the data in panel B. To run this test, we needed to first define 4 quadrants on the scatter plot, where the 4 quadrants are defined by a horizontal boundary and a vertical boundary. We then counted the number of points in each quadrant, and ran these counts through the Fisher exact test, which yielded a p-value. However, there are many choices for how to define the vertical and horizontal boundaries. To account for all possible boundary choices, we ran the Fisher test for a 2-d dimensional matrix of boundary choices. Thus each point in the panel C represents the choice of vertical and horizontal boundary, and the color of that point is the resulting p-value. Importantly, virtually none of the p-values are below 0.05.
We next wondered whether the transcriptional burstiness combined with the short half-life of transcripts
could be obscuring our assay for negative correlation. To control for this possibility, we ran the FISH
experiment on the matrix strain ‘PW-cfp,PW-yfp’. If burstiness is not playing a major role, then we expect
cfp and yfp transcripts levels to be well correlated with each other. However, we observed cells high in cfp
Figure 2.6.3. Transcripts of cfp andyfpare not well correlated when when driven by σW.(A) Scatter plot from FISH against cfp andyfptranscripts in the matrix strain ‘P W-cfp,PW-yfp’. Each circle in the scatter represents a single cell, whose coordinate are determined by its cfp and yfp transcript levels. Transcript levels were quantified by taking the difference between the 95th percentile pixel brightness and the 50th percentile pixel brightness in the cell. Since cfp and yfp transcription are driven by the same sigma, we expect their respective transcript levels to be well-correlated. In the scatter plot, this would manifest as all dots lying on a diagonal line. However, there exist points in the scatter than are high in cfpbut low in yfp, and vice versa.
This lack of correlation raised the possibility that any negative correlation could be obscured. For
instance, let us consider a cell that is pulsing in σ 1but not in σ 2. This is a cell exhibiting anti-correlated
sigma activity. But assayed by FISH, it’s possible the σ 1 signal would appear ‘off’, and the σ2 signal
would also be off. Thus FISH would tell us this cell is off in both signals. By reducing the number of
anti-correlated cells and increasing the number of cells in which both signals are off, any underlying
negative correlation could be obscured. However, admittedly this argument would be more convincing
with a simulation; in addition, it could also be a cell pulsing in both σ1and σ
2appears to be pulsing in
only one of them. In any case, we moved on to experiments with the mother machine, which for various
reasons are preferable to the FISH experiment for our purposes.
2.6.3 RNA FISH Protocol
The protocol for RNA FISH in B. subtilis is described below. All other procedures not listed here were as
described in this study.
General Considerations: Try to buy components that are nuclease-free, e.g. water and PBS. Many steps
involve spinning cells, and removing supernatant. I try to be relatively aggressive in removing the
supernatant since we are working with relatively small volumes. FISH probes from Stellaris and the
Alexa series dyes have worked well for us. Many thanks to Timur Zhiyentayev, on whose protocol this
document is heavily based.
70% HB Buffer: 1 part dextran sulfate, 2 part Nuclease-Free H2O, and 7 part formamide,
all by mass
35% HB Buffer 1 part dextran sulfate, 5.5 part Nuclease-Free H2O, and 3.5 part
formamide, all by mass
Above 2 solutions can be kept at -20 C for a few months.
Lysozyme http://www.epibio.com/enzymes/lysozymes/ready-lyse-lysozyme-solution, store at -20 C
Dextran Sulfate Sigma D4911
Formaldehyde polysciences.com, #18814
Cell Preparation
Grow 10 ml of cells in orbital shaker until OD ~0.3
Fix cells
Add 5.5% formaldehyde directly to your culture flask, s.t. the final formaldehyde concentration is 0.5%
For instance, if your culture volume is 10 ml, then add 1 ml of 5.5% formaldehyde
5.5% Formaldehyde solution is diluted from 16% stock solution using PBS Mix culture by shaking the flask by hand, I generally avoid vortexing in case this affects the cell internal state
Spin down cells, 2.5 min at 6000 rcf --> Remove supernatant --> Resuspend pellet in 1 ml 0.02 SSC. Use pipet to resuspend pellet
Spin down cells, 2.5 min at 6000 rcf --> Remove supernatant --> Resuspend cells in 200 µl of MAAM (4:1 methanol/acetic acid mixture by volume). Use pipet to resuspend pellet.
MAAM can be kept at -20 C.
Cells can be kept in MAAM at -80 C for 1-2 days without loss in RNA hybridization efficiency.
Cell Hybridization and Washing
Spin cell suspension(50-100 µl), remove sup, and resuspend thoroughly in 50 µl of 70% hybridization buffer.
Heat for 1 hr at 65 C to denature target nucleic acid. (not necessary for RNA FISH, may be necessary for DNA FISH)
You may want to test this step for yourself.
Spin down cells in tabletop centrifuge, remove sup, and replace 70% hybr buffer with 100 µl of lysozyme for 10 min at RT.
Spin down cells in tabletop centrifuge, remove sup, add 50 µl of 70% hybr buffer. Then add 50 µl of 35% hybr buffer. Mix using Pipet Tip
Add 1 µl of probe solution, and resuspend cells using pipet.
2.7 Materials and Methods
2.7.1 Table of Strains and Plasmids
Identifier Plasmid Source Identifier
Plasmid 1 ppsB::PtrpE-mCherry ErmR This work Plasmid 1
Plasmid 2 sacA::P?-yfp CmR This work Plasmid 2
Plasmid 3 amyE::P?-3Xcfp SpectR. This work Plasmid 3
Plasmid 4 amyE::Phyperspank-sigB SpectR This work Plasmid 4
Plasmid 5 pyrD::PB-cfp kanR This work Plasmid 5
ID Bacterial Strain Genotype Construction/Source
PY79
trpC2 (this genotype omitted in derived
strains, below) BGSC 1A776
JP1 ppsB::PtrpE-mCherry PhleoR 68
JP2 JP1;ytvA::NeoR JJB751→JP1 (NeoR selection)68
JP3 JP2;sacA::PB-yfp CmR Plasmid (2)→JP2 JP4 JP2;sacA::PM-yfp CmR Plasmid (2)→JP2 JP5 JP2;sacA::PW-yfp CmR Plasmid (2)→JP2 JP6 JP2;sacA::PX-yfp CmR Plasmid (2)→JP2 JP7 JP2;sacA::PD-yfp CmR Plasmid (2)→JP2 JP8 JP2;sacA::PL-yfp CmR Plasmid (2)→JP2 JP9 JP2;sacA::PY-yfp CmR Plasmid (2)→JP2 JP10 JP2;sacA::PA-yfp CmR Plasmid (2)→JP2
JP11 JP3;rsbU-rsbX::TetR
68
68
JP12 JP4; sigM::TetR 69
JP13 JP4; sigW::ErmR 69
JP14 JP6;sigX::SpectR 70
JP15 sigD::TetR 71,72
JP16 JP7; sigD::TetR JP15→JP7 (TetR selection)
JP17 JP1; sacA::PL-yfp CmR JP8→JP1 (CmR selection)
JP19 JP1; sacA::PY-yfp CmR JP9→JP1 (CmR selection)
JP20 JP19;sigY::KanR 73
JP21 JP3;amyE::PB-3Xcfp SpectR Plasmid (3)→JP3 JP22 JP3;amyE::PM-3Xcfp SpectR Plasmid (3)→JP3 JP23 JP3;amyE::PW-3Xcfp SpectR Plasmid (3)→JP3 JP24 JP3;amyE::PX-3Xcfp SpectR Plasmid (3)→JP3 JP25 JP3;amyE::PD-3Xcfp SpectR Plasmid (3)→JP3 JP26 JP4;amyE::PB-3Xcfp SpectR Plasmid (3)→JP4 JP27 JP4;amyE::PM-3Xcfp SpectR Plasmid (3)→JP4 JP28 JP4;amyE::PW-3Xcfp SpectR Plasmid (3)→JP4 JP29 JP4;amyE::PX-3Xcfp SpectR Plasmid (3)→JP4 JP30 JP4;amyE::PD-3Xcfp SpectR Plasmid (3)→JP4 JP31 JP5;amyE::PB-3Xcfp SpectR Plasmid (3)→JP5 JP32 JP5;amyE::PM-3Xcfp SpectR Plasmid (3)→JP5 JP33 JP5;amyE::PW-3Xcfp SpectR Plasmid (3)→JP5 JP34 JP5;amyE::PX-3Xcfp SpectR Plasmid (3)→JP5 JP35 JP5;amyE::PD-3Xcfp SpectR Plasmid (3)→JP5 JP36 JP6;amyE::PB-3Xcfp SpectR Plasmid (3)→JP6 JP37 JP6;amyE::PM-3Xcfp SpectR Plasmid (3)→JP6 JP38 JP6;amyE::PW-3Xcfp SpectR Plasmid (3)→JP6 JP39 JP6;amyE::PX-3Xcfp SpectR Plasmid (3)→JP6 JP40 JP6;amyE::PD-3Xcfp SpectR Plasmid (3)→JP6 JP41 JP7;amyE::PB-3Xcfp SpectR Plasmid (3)→JP7 JP42 JP7;amyE::PM-3Xcfp SpectR Plasmid (3)→JP7 JP43 JP7;amyE::PW-3Xcfp SpectR Plasmid (3)→JP7 JP44 JP7;amyE::PX-3Xcfp SpectR Plasmid (3)→JP7 JP45 JP7;amyE::PD-3Xcfp SpectR Plasmid (3)→JP7
JP46 JJB213; rsbU-rsbX::TetR 68
JP47 JP1 ; rsbU-rsbX::TetR JP46→JP1 (TetR selection)
JP50 JP49; sacA::PW-yfp CmR Plasmid (2)→JP49 JP51 JP49; sacA::PD-yfp CmR Plasmid (2)→JP49
JP52 JP50; hag::ErmR BGSC BKEHAG→JP5074
JP53 JP51; hag::ErmR BGSC BKEHAG→JP5174
JP54 JP11;hag∷ErmR BGSC BKEHAG→JP26 74
JP55 JP16;hag∷ErmR BGSC BKEHAG→JP26 74
JP56 JP21;hag∷ErmR BGSC BKEHAG→JP31 74
JP57 JP26;hag∷ErmR BGSC BKEHAG→JP36 74
JP58 JP31;hag∷ErmR BGSC BKEHAG→JP41 74
JP59 JP17;hag∷ErmR BGSC BKEHAG→JP27 74
JP60 JP22;hag∷ErmR BGSC BKEHAG→JP32 74
JP61 JP27;hag∷ErmR BGSC BKEHAG→JP37 74
JP62 JP32;hag∷ErmR BGSC BKEHAG→JP42 74
JP63 JP23;hag∷ErmR BGSC BKEHAG→JP33 74
JP64 JP28;hag∷ErmR BGSC BKEHAG→JP38 74
JP65 JP33;hag∷ErmR BGSC BKEHAG→JP43 74
JP66 JP29;hag∷ErmR BGSC BKEHAG→JP39 74
JP67 JP34;hag∷ErmR BGSC BKEHAG→JP44 74
JP68 JP35;hag∷ErmR BGSC BKEHAG→JP45 74
2.7.2. Strain and Plasmid Construction
In above table, in the column labeled “Construction Procedure”, the ‘ →’ symbol indicates an integration event from plasmid or genomic DNA into the strain after the arrow. For example, in strain JP2, the construction procedure is listed as “ JJB751→JP1 (with NeoRselection)”, meaning that the genomic DNA of JJB751 was prepared and transformed into JP1 with selection on neomycin.
Antibiotic resistance was switched using a previously described antibiotic switching vector system 71.
Deletions were made by replacing genes of interest with a selection marker via a linear DNA fragment homologous to the region of interest.
All plasmids were cloned using E.coli strain DH5α and a combination of standard molecular cloning techniques and non-ligase dependent cloning using Clontech In-Fusion Advantage PCR Cloning kits. Plasmid constructs were integrated into B. subtilis chromosomal regions via double crossover using standard techniques. The following list provides a description of each plasmid constructed, with details on integration position/cassette and selection marker given at the beginning. Note that all plasmids below replicate in E. coli but not in B. subtilis.
Plasmid list:
1) ppsB::PtrpE-mCherry ErmR - This plasmid was used to provide uniform expression of mCherry from a σ A-dependent promoter, enabling automatic image segmentation (cell identification) in time-lapse
movie analysis. A minimal σ A promoter was used from thetrpEgene and cloned into a vector with ppsB
homology regions 68. The original integration vector was a gift from A. Eldar 75. For some strains, the
selection marker was subsequently changed, in B. subtilis, to either KanRor PhleoR.
2) sacA::P?-yfp CmR-Target promoters of each alternative sigma factor, ? = B, D, L, M, W, X, Y, A were cloned into the EcoRI/BamHI sites of AEC127 75. For σA, a minimal σ Apromoter was used from the
3) amyE::P?-3Xcfp SpectR. Target promoters of each alternative sigma factor, ? = B, D, L, M, W, X, Y, were cloned into the EcoRI/Nhe1 sites of plasmid amyE::3XCFP SpectR68. This plasmid, based on
pDL30, contains 3 separate copies of cfp, each with its own RBS. Target promoter sequences are described in a later section.
4) amyE::Phyperspank-sigB SpectR - The coding region of sigB, along with a 5’ transcriptional terminator, was cloned behind the Phyperspank IPTG-inducible promoter in plasmid pDR-111 (gift of D. Rudner, Harvard).
5) pyrD::PB-cfp kanR. Target promoter of σ B, followed by the CFP fluorescent protein gene, was
cloned into the EcoRI/BseRI site of the ECE171 plasmid 76.
Target Promoters for Sigma Factors
Below is a list of the promoters used to report on each sigma factor’s activity. Each sequence below contains a binding site for the given sigma factor, and were cloned into the requisite targeting plasmid. Note restriction enzyme sites are not included in the displayed sequences.
1) σ
B: Sequence was chosen from the σ
Bbinding site upstream of the
rsbV
gene
77,78.
5’-GTTTCTTGGAGCGTCCTGATCTGCAGAAGCTCATTGAGGAACATATGTGTTCCTCTGCGCAGGAAATGGTCAAA
AACATTTATGACAGCCTCCTCAAATTGCAGGATTTTCAGCTTCACGATGATTTTACGTTAATTGTTTTGCGGAGAAA
GGTTTAACGTCTGTCAGACGAGGGTATAAAGCAACTAGTGATTTGAAGGAAAATTTG - 3’
2) σ
D: Sequence was chosen from the σ
Dbinding site upstream of the
flgB
gene
795’ – TTTTGCATTTTTCTTCAAAAAGTTTCAAAAATGCCGAAAAGAAAGGAGAAAAAACAGAAATTCTG –3’
5’-
AATATGGCCTTGCAAATGAAGGCATGCAATAATTTGCAGAATAAACGCAAACATCTGCACGAATGTTTCGGTATAC
CTGGTATGACAGCACCCTTAAGAGCTGGCATGGAACTTGCATAATAAAAGGCGGAG – 3’
4) σ
M: Sequence was chosen from the σ
Mbinding site upstream of the
sigM
gene
80.
5’ – TTTGCATGTAATGTGCAACTTTAAACCTTTCTTATGCGTGTATAACATAGAGG-3’
5) σ
W: Sequence was chosen from the σ
Wbinding site upstream of the
ydbS
gene
81.
5’ – TTAAGAATGAAACCTTTCTGTAAAAGAGACGTATAAATAACGACGAAAAAAAG – 3’
6) σ
X: Sequence was chosen from the σ
Xbinding site upstream of the
sigX
gene
82.
5’ – TTGTAATGTAACTTTTCAAGCTATTCATACGACAAAAAAGTGAACGGAGGG – 3’
7) σ
Y: Sequence was chosen from the σ
Ybinding site upstream of the
sigY
gene
73.
5’ – GAATTGTAAAAAAGATGAACGCTTTTGAATCCGGTGTCGTCTCATAAGGCAGAAAAACA – 3’ ww
2.7.3. Microscopy and Sample Preparation
mean intensity. Exposure times were then adjusted to keep per exposure light levels constant between experiments. For experiments in the mother machine, epi-illumination was provided by a solid state white light source (Lumencor SOLA, Lumencor SOLA). Phase contrast illumination was provided by a halogen bulb to allow verification of cell focus and cell shape. Temperature control was achieved using an enclosed microscope chamber (Nikon) attached to a temperature sensitive heat exchanger set to 37 °C. All experiments used a Phase 100x Plan Apo (NA 1.4) objective. Chroma filter sets used were as follows: #41027 (mCherry), #41028 (YFP), and #31044v2 (CFP). The interval between