On the Potential for Recognising of Social Interaction and Social Learning in Modelling Travellers’ Change of Behaviour under Uncertainty
Yos Sunitiyoso1, Erel Avineri, Kiron Chatterjee
Centre for Transport and Society, University of the West of England, Frenchay Campus, Bristol BS16 1QY
Abstract
This study aims to investigate the potential of incorporating social interaction and social learning in modelling travellers’ change of behaviour under uncertainty. The interdependent situation between travellers in using the road as a public good is considered a source of uncertainty to be studied. The role of social information in reducing the level of uncertainty is investigated. The research methodology utilizes laboratory and simulation experiments. A social interdependency situation which is formulated as a hypothetical employer-based demand management initiative in reducing car use is used as the case study. A laboratory experiment demonstrates the dynamic processes of travel behaviour in making repeated travel decisions. Analyses on group and individual behaviours of travellers provide some indications about the existence of some types of social and individual learning mechanism in their decision making. The results of the laboratory experiment also provide basic information for developing a simulation model in the next stage of the study. The simulation experiment utilizes an agent-based simulation model to simulate and analyse behaviours of individuals in larger environments, larger group sizes, longer time periods, and various situational settings. The simulation experiments provide indications, which are supported by the evidence obtained from the laboratory experiment, that social information may have both positive and negative effects on individuals’ behaviour, depending on the form of social learning mechanisms that are used by travellers. Providing social information does not necessarily reduce the uncertainty level, however, it is shown to do so when social learning strongly exists among travellers.
Keywords: social interaction, social learning, uncertainty, agent-based simulation
1. INTRODUCTION
Uncertainty in a transport system can originate from the stochastic nature of the system due to the effects of natural events (e.g. rain, snow) as well as human-made events (e.g. accident, roadworks). Interaction between (anonymous) travellers in using public goods (e.g. roads) is also a source of uncertainty since travellers’ choices of travel mode, route or departure time has an impact on the system state (e.g. traffic volume), hence all road users’ outcomes (e.g. travel time). Another source of uncertainty can originate from travel information provided to travellers which is actually intended to reduce uncertainty. Providing information to travellers may not necessarily lead to reduction of uncertainty, but it may also increase uncertainty and hence make travellers unexpectedly behave in different ways from that expected. For example it has been found in route choice decisions that providing travellers with information about expected travel times increases the heterogeneity of choices (hence increases uncertainty) and also reduces travellers’ learning rate to prefer the alternative that minimizes travel time
1Corresponding author. Current affiliation: Transportation Research Group, University of
(Avineri and Prashker, 2006). Different information schemes may also result in different changes of travellers’ behaviour. For example, dynamic information may result in different behavioural responses from static information. Also social information regarding the choices of other travellers may influence the behaviour of the travellers exposed to such information.
These uncertainties contribute to the complex and dynamic process of travel behavioural change involving a sequence of adaptation over time. Differences in timing and frequency of many events experienced by travellers may lead to different patterns of travel behaviour. These may also depend on whether the traveller interacts with other travellers and whether the traveller is influenced by others’ behaviours. Interactions between travellers may occur in various interaction domains (neighbourhood, school, workplace, etc) using various types of social network (lattice structured, random network, etc. - see Nakamaru and Levin (2004) for reference). Travellers are also heterogeneous with diverse characteristics. Some travellers interact with other travellers and take other travellers’ behaviour into consideration before making a travel choice decision. Other travellers may always make the same travel choice at all times. They are not easily influenced to change their choice. The aggregate interactions of the interacting travellers ultimately contributes to the dynamics of the aggregate behaviour of travellers in the transport system. The large number of aspects involved and the variety of their interactions contribute to the complexity of travel behaviour.
In everyday life, and in scientific research, people use the concept ‘uncertainty’ in many different ways. In this paper, we focus on the ‘uncertainty’ in the mind of travellers regarding the choices of other travellers in the context of a social interdependency situation. To enable focusing the study on this type of uncertainty, no stochastic variable is introduced in the system. It is argued that providing social information would reduce uncertainty in the travellers’ mind, as suggested in previous studies. For example, Artigiani (1998) argued that social information reduces uncertainties individuals have about the systemic effects of each other’s behaviour. In social interdependency situation, information about each other’s action may help individuals to have reciprocal behaviours with each other that would benefit them (e.g. cooperative behaviours). Thus individuals store information about each other’s actions. However, this does not guarantee that they will be able predict what others would do. Instead this might help them to adjust to what others did. The process of acquiring, storing and using the information about other individuals’ choices in making decision represents a social learning process. The availability of information to travellers may not necessarily lead to reduction of uncertainty, but it may also increase uncertainty and hence make travellers unexpectedly behave in different ways from the expectation.
We initiate a way of incorporating social interaction and social learning in modelling travellers’ behaviour under uncertainty in order to understand the changes of behaviour as well as to consider ways to influence the changes. These two social aspects are interrelated since social interaction is a medium for social learning to happen. There are many social learning mechanisms that are possible to happen in the real world during direct or indirect interaction between people. Direct interaction occurs between people who conduct peer-to-peer communication, whether it is face-to-face or through communication media (e.g. telephone, email, and short messaging service). Indirect interaction is interaction mediated by mass media (e.g. newspaper, radio, TV) as often used in social marketing campaigns (e.g. DeJong, 2002). In this study, we specifically focus on direct social interaction.
travellers’ behaviour using an inductive methodology. Inductive methodology is often called a ‘bottom-up’ approach, which begins from specific observations, then detects patterns and regularities, and finally ends up developing some general conclusions or theories. The research tools are expected to help us understand behavioural change mechanisms at system and individual levels.
The methodology of our research consists of two stages of study, employing a laboratory experiment and a simulation experiment. In the first stage, a laboratory experiment is used to reveal the learning process of travellers when making repeated travel decisions. It also allows investigation of the dynamics of each individual’s behaviour as well as group behaviour. Experimental settings, such as interaction between participants and flow of information, can be controlled according to the objective of the experiment. In the second stage of this study, the simulation experiment utilizes an agent-based simulation model to simulate and analyse behaviours of individuals in larger environments, larger group sizes, longer time periods, and various situational settings. It also enables us to observe whether individuals’ choices converge to an equilibrium point, or not, as well as the dynamic processes before convergence.
The structure of this paper consists of six sections. Following the introduction, a brief discussion regarding social interaction and social learning is presented in Section 2. It is followed by Sections 3 and 4 which discuss the first and second stage of study respectively: laboratory and simulation experiments. The experimental designs, results, and analyses are provided in these sections. Section 5 discusses some limitations of the study. Conclusions and further research are discussed in Section 6.
2. SOCIAL INTERACTION AND SOCIAL LEARNING IN TRAVEL BEHAVIOUR According to Simon (1956) in his Satisficing Theory, it is stated that even if it appears that a decision is made by an individual independently of others, it often involves influence from family, friends or peers. Different people in a group may have different weight (of influence). This may change as the decision process evolves. This argument highlights the potential role that social aspects have in the dynamics of travellers’ behaviour. While there are many other social aspects (e.g. social norm, altruism, group identity) that may exist in real life, in this study we focus on two social aspects: social interaction and social learning. We are particularly interested in these aspects as they could have a central role in the dynamics of travellers’ decision making and behaviour under uncertainty.
change of behaviour in a car-sharing programme. These studies highlight some indications that forms of social interaction and social learning might have an important role in the dynamics of travellers’ change of behaviour.
2.1 Social interaction
Social interaction is necessary for the occurrence of social learning (explained in Section 2.2). There are three levels of social interaction that are being considered in this study. The first level of social interaction may due to an interdependent situation where travellers are in a similar transport system with other travellers and their decisions affect the whole system, not only themselves but also other travellers (e.g. traffic congestion caused by excessive number of car users on the road). This interdependent situation can be explained by a collective action (e.g. social dilemma) where no member of group engaged in collective action can be excluded from enjoying the benefits (or costs) of the group’s efforts (Huberman and Glance, 1993). The second level of social interaction may happen through observation by a traveller of other travellers’ choices without involving processes of communication. The third level of social interaction is through communication between travellers regarding their travel choices. Both the second and third levels of social interaction may be due to the fact that individuals are not indifferent to the outcomes received by others (Messick, 1985). Travellers sometimes take into account and are concerned about choices by other travellers (Van Lange et al., 2000). In this study, we focus on the first two levels of interaction.
The scale of interaction depends on the size of group (or society), which is part of the population. In a group, actions of a group member receive higher influence than those of the wider population, since inside a group there exists a feeling of belonging and responsibility as a group member. In the population, those feelings may not strongly exist. Within a group, each individual has more responsible feelings about participating in a cooperative action according to the group-interest, without thinking to ‘free-ride’ by being an opportunist since it will be easily seen by other group members. In relation to ‘soft’ measures, such as travel awareness campaigns, a more local and personalized campaign aimed at groups of people, such as schools, companies or communities, may be more useful than a broad and national campaign aimed at the whole population.
2.2 Social learning
Change of behaviour is a dynamic process that occurs over time, which may involve a learning process. The concept of individual learning suggests that individuals learn from their past experience and utilise an adaptive decision making process to cope with uncertainty (Timmermans et al., 2003). There is another form of learning, social learning, where individuals learn from others’ experiences or observed behaviours. In travel behaviour modelling, the individual learning concept has often been studied (for a review, see Arentze and Timmermans, 2005), while social learning has rarely been investigated. This is an important gap, since evidence from other disciplines (e.g. economics and behavioural sciences) have shown that this kind of learning process is influential and important (e.g. Pingle, 1995; Offerman and Sonnemans, 1998; Kameda and Nakanishi, 2002).
In social learning, decision makers may have the opportunity to observe the behaviours or preferences of others prior to making a choice, therefore they can reduce decision costs associated with comparing alternatives. Also, the choice resulting from social learning may be of high quality since it would be learnt from other individuals with better performance in decision making. Individuals can use several mechanisms in order to learn from others as suggested by Henrich (2004); these include conformist transmission (imitating high frequency behaviours), payoff-biased transmission (imitating other individuals who are more successful), self-similarity transmission (imitating other individuals with similarity in some traits) or normative transmission (following the most common behaviour in the group according to social norm).
3. LABORATORY EXPERIMENT
The experiment, which utilizes a computer interface developed based on Z-tree (Fischbacher, 2007), simulates a repeated decision making environment. In the experiment, participants face a situation of whether or not to contribute to an employer-based demand management initiative to reduce employees’ car-use. Interaction between travellers is mediated by the server/experimenter which provides participants with two schemes of social information about other participants’ behaviour. Further details of the experimental design are discussed in the following subsection.
3.1 Experimental design
The employer-based initiative asks each employee (each participant in the experiment) to contribute by using bus, as an alternative to car, for a number of days (0-25 days) in the month. In each month an employee is given a budget to pay for transport (both car and bus expenses). Based on the participants’ choices, a reward (bonus) is given by the simulated employer to all employees, where the amount of the reward depends on the total contribution (collective bus-use) of the employees. In this experiment, the reward is half of the total expenses of the collective bus use. The reward is then distributed equally to each of the participants, regardless of the amount of their individual contribution. The payoff function of each participant can be formulated in Equation 1. This hypothetical situation demonstrates a social (public goods) dilemma in a group of individuals where payoff for non-cooperative choice (car-use) is higher than the payoff for cooperative choice (bus-use), regardless of what other individuals choose. However, everyone will receive higher payoff when all individuals in the group are cooperative.
(1)
Ei(t) is the earning received by individual i at time period t (representing one month), K is the
fixed amount of money to spend on transport in each month (£75 per month), KB and KC are
out-of-pocket costs of using bus (£3 per day) and of using car (£2 per day) respectively, Ci(t)
is individual i’s choice which is the number of days per month of using bus ( ), and N is the number of employees in the company (the number of participants in a group).
The case study used in the laboratory experiment is based on the current situation in the city of Bristol where travelling by car is relatively cheap and there is no congestion pricing operating in the city and the cost of parking in the University of the West of England campus is very low (£15 per year). It is also common in the UK that employers provide free parking. Public transport in the UK, and especially in Bristol, is not very cheap - mainly due to the absence of government subsidy. According to a UK transport statistics document, Transport Trends 2007 (DfT, 2007, p. 31), in 1980-2006 the cost of public transport (bus/coach and rail fares) has risen year-by-year (in 2006 it is 40% higher than in 1980 in real terms). In contrast, the real cost of motoring (cars and other private vehicles, which include purchase, maintenance, petrol and oil, and tax and insurance) has remained at or below its 1980 level in real terms, although the real cost of fuel in 2006 was 19% higher than in 1980.
While the numerical example and analysis are based on the case study’s environment, in different situations the cost of travelling by car is likely to be higher (compared with the costs of public transport), particularly when pricing measures are already introduced (congestion charging, parking costs increased, etc.), such as the situation in London. Choosing between travelling by private car and bus is often framed as social dilemma (e.g. Van Vugt et al., 1995, 1996; Van Lange et al., 1998; Kitamura et al., 1999) and structural approach such as congestion pricing is intended to eliminate the dilemma (e.g. reducing car use and congestion).
The hypothetical situation used in the laboratory experiment, in a simple way, resembles some features of travel voucher programmes to encourage public transport use in countries such as USA, Germany, and France. The basic model is that the employer issues travel vouchers to be used to pay for travel on public transport. These vouchers are tax free, thus providing an incentive to use since the employers can save payroll-related taxes and employees save on after-tax values. Travel vouchers operate like luncheon vouchers, but for travel. The Commuter Check (one of travel voucher schemes operating in the USA) allows employees to use tax-free vouchers, arranged by their employers, on public transport. In the hypothetical situation, to frame this situation as a social dilemma, the employers’ cost-saving is reimbursed to all employees as a bonus. This type of employer initiative has potential to be implemented as part of employer travel plans in the UK in encouraging the use of public transport (bus).
The system optimum can be reached if all participants use bus 25 days per month, producing an earning of £37.5 for each of them. The user dominant strategy is never to use bus since this strategy will always give the participant the highest earning by ‘free-riding’ on other’s contributions. If a participant uses this strategy, while in extreme situation all other participants keep using bus 25 days per month, then they will receive £58.3 while the others receive only £33.3 each. However, the more people choose this strategy, the less the earning will be received by each participant since less amount of bonus will be received from a lower total contribution. If all participants adopt the strategy (of never using bus), then they will all receive an earning of £25. This will give system efficiency of 67% (=25/37.5).
final rounds (Hypothesis 1). In this session, each participant is given information about her own experience (bus-use, expenses, earning).
Table 1: Experimental sessions
Rounds Own experience Social information
Session 1 1-10 Yes No
Session 2 11-20 Yes Yes (info about another participant only) Session 3 21-30 Yes Yes (info about all
other participants)
In Session 2, another hypothesis is introduced, which is providing participants with opportunity to access social information about choices of others. This encourages social learning process to exist between participants and influences them to contribute more or less than in Session 1 (Hypothesis 2). Similar to the treatment in Session 1, in this session participants are still provided with feedback about their choices and outputs. In addition to that, they have an opportunity for observing previous contributions and earning of another participant. In other words, there is an option to access (limited) social information. In Session 3, the hypothesis is regarding majority/plurality influence and is whether the majority/plurality choice influences the choice of participants in a process of social learning and encourage them to contribute more or less than in Sessions 1 and 2 (Hypothesis 3). In this session, a similar type of information as given in the first session is provided and added with the new treatment where participants are given information about the contributions of all other participants (full social information).
The first experimental treatment tests how the participants would behave (e.g. whether they would contribute to collective action or not, how much they would contribute) in an interdependent situation when they are uncertain about the state of system resulted from their decisions as well as other participants’ decisions. No information about other participants’ choices is provided in this treatment. In the second and third experiments the treatments are used to investigate whether or not the social information about other participants’ choices (limited information in second treatment and full information in third treatment) would reduce the uncertainty individuals have about each other’s choices and thus influence their behaviours.
In the experiment, participants are presented with a travel choice situation and they are asked to make decision (input). After all participants make decision, payoff (output) is calculated and provided to participants as feedback. For particular treatments where the effects of social information are investigated, the server/experimenter provides participants with information about other participants’ behaviour. Verbal communication between participants is not allowed during the experiment.
3.2 Experimental results
All participants have been asked about their willingness to participate and they all agreed to participate. There is no financial incentive (payment) given to participants, however, they are asked to behave as they would have done if the hypothetical situation is real. The participants consist of 4 females and 5 males.
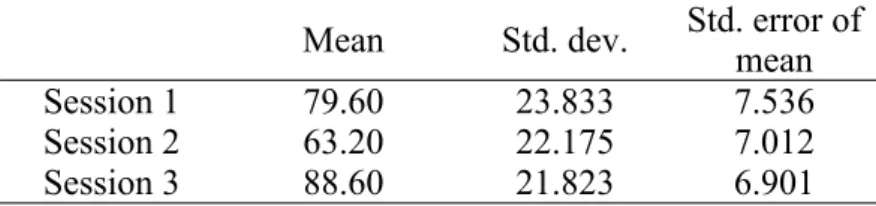
Figure 1 shows the dynamics of total contribution (collective bus-use of the group of participants) in each round of decision making for all three sessions. Since all participants in the group take part in all sessions, in addition to the effects of experimental treatments their behaviours in a succeeding session might also be influenced by their experiences in the preceding session. Hence, in the analysis we may consider the rounds as 30 continuous rounds with a different treatment in each 10-round session. On initial inspection, it can be seen from the graph that providing an option to access social information, as in Sessions 2 and 3, appears to have influenced participants to behave differently by contributing more or less than in the previous session(s). In these sessions, forms of social learning may exist when participants observe the behaviours of others. Table 2 presents descriptive statistics (mean, standard deviation, and standard error of mean) of experimental results in all three sessions. The total bus use in each round has never reached the system optimum, which is 225 days (=9 x 25), and the user equilibrium, when the total bus use is 0, has never occurred either.
0 20 40 60 80 100 120 140
1 2 3 4 5 6 7 8 9 10 11 12 13 14 15 16 17 18 19 20 21 22 23 24 25 26 27 28 29 30 Round
C
ol
le
ct
iv
e
bu
s-us
e
(i
n
da
ys
)
Session 1 Session 2 Session 3
Figure 1: Dynamics of total contribution ( ) in Sessions 1, 2 and 3.
Table 2: Descriptive statistics of total contribution Mean Std. dev. Std. error ofmean Session 1 79.60 23.833 7.536 Session 2 63.20 22.175 7.012 Session 3 88.60 21.823 6.901
is statistically significant (t=-2.582; =0.05; t-critical = 2.100). This result shows that, by looking at group behaviour, individuals significantly contribute more in Session 3 than in Session 2, which partially confirms Hypothesis 3. It gives an indication that providing social information about all other participants’ choice (in Session 3) may encourage participants to give higher contributions than those of a situation when social information is restricted to only information about another participant (in Session 2). Full confirmation of Hypothesis 3 could not be obtained since the total contributions in Session 3 are not statistically significantly higher than Session 1.
There is an indication that participants contribute higher in Session 1 than Session 2 based on the means of total contributions shown in Table 2. However, the statistical test shows that the difference is not significant. Hence, Hypothesis 2, which states that the opportunity for accessing social information would influence participants to contribute more or less in Session 2 than in Session 1, could not be confirmed.
One of the simple tests to know whether participants learn during the experiment is by investigating their absolute changes of contribution ( ) between rounds in each session. If the changes in the succeeding rounds are smaller than in the preceding rounds then it is likely that individuals learn about choices that satisfy their goals. In a social interdependency situation, if participants are economically rational, one of the goals can be maximizing outcomes/earnings by being ‘selfish’ (minimizing contributions) or being ‘cooperative' (maximizing contributions). Using the changes of contribution as an indicator of the existence of a learning process gives a better measurement than using the amount of contribution since it can capture both learning processes (of being selfish or cooperative) in maximizing outcomes. The absolute changes of contribution can also be used as a measure of individuals’ stability of choices, which indicates the change of uncertainty level. The greater the changes, the less stable individuals’ choices are. When individuals modify their choices, the state of system is affected and it increases the level of uncertainty. We conduct t-tests comparing the average change of contribution in the first 5 rounds with the average change in the last 5 rounds of each session.
Table 3 shows that only in the first session the average change of contribution is significantly lower in the rounds 6-10 than that of rounds 1-5, which means that in Session 1 individuals might have learnt to make choices that satisfy their goals. In the other sessions, the learning process within the sessions could not be clearly observed. The possible reasons could be that they have learnt about the ‘best’ choices in Session 1 and/or have been subsequently influenced by the social information about other participants’ behaviours. The social information provided could have generated more cognitive effort thus reducing participants’ capacity to process large amount of information and thus decreasing their learning rate. Another reason could be that the social information provided to participants might have increased uncertainty, especially in Session 3 where information about the choices of all other participants was provided. As shown in Table 3, the absolute changes in both first five and last five rounds of Session 3 are higher than those of other sessions.
Table 3: Mean of average absolute-change of contribution
Rounds t
1-5 6-10
Session 1 6.222 (0.912) 3.778 (1.284) 3.198a
Session 3 7.111 (1.800) 7.178 (3.941) -0.034
Note: asignificant at = 0.05 (t-critical = 2.306); standard deviation in parentheses
Between-session learning processes are measured by comparing the last 5 rounds of a preceding session with the first 5 rounds of the succeeding session. The differences between Sessions 1 and 2 (t = -0.320) and between Sessions 2 and 3 (t = -1.757) are not significant. One possible reason could be that the effect of the learning processes in the preceding session continues to the succeeding section.
3.3 Individual learning models
To investigate which kind of learning process may exist within participants, models of individual learning and social learning are fit to the empirical data. In the first session, participants were only using their own experience to make a decision so that only individual learning would possibly occur in the session. There are three models of individual learning which are used to investigate the type of individual learning that is likely to be used by participants.
We decide to use a simple method for modelling participants’ choice making, which is based on the probability P of a choice to be made by an individual. The higher the probability is, the more likely the choice will be selected. In the analysis of laboratory experimental results, the initial probabilities are randomly assigned based on a uniform distribution U[0,1]. When data about initial probabilities are available (for example, obtained from a pre-experiment questionnaire), they can be used as the analysis of the laboratory experiment result and also as input in the multi-agent simulation model described in Section 4.
The first individual learning model is based on a simple heuristic rule developed by Harley (1981) which specifies the probability of making a choice as a function of the payoffs obtained by making the choice in the past. The probability of choice x being made by individual i at time period t is the ratio between individual i’s accumulated payoff of choice x
and the individual’s total payoff earned until time period t-1. In general travel behaviour context, the payoff can be reduced travel time or cost. However, in this study, a payoff is represented by the earning that an individual receives after making a choice in the laboratory experiment presented in the previous section. The rule can be represented in this equation:
(2)
where Pix(t) is probability of choice x ( ; ) being made by individual i
( ; ) at time period t and Eix(r) is individual i’s earning received from choosing x
at time period r ( ). S is set of individuals and N is the number of individuals in set
S.
The second model is a simple Bayesian model based on Herrnstein (1970)’s law of effect. The model, which is called the average return model, assumes that the probability of a choice being made depends on the average outcomes of selecting the choice. If x is chosen (Ci(t)=x)
at time period t and an outcome Eix(t) is obtained, then the expected utility to choose x at time
(3)
The probability of choice x being made by individual i at time period t is then calculated using this equation:
(4)
where Nix(t) is the frequency of x being selected by individual i at time period t.
The third individual learning model that is used in this study is another type of Bayesian learning model, the weighted average return model (March, 1996). In this model, the probability of each choice being made is a function of the weighted past outcomes. After a specific choice is made, the memory of the choice’s outcomes is updated by weighting the current outcome experienced and the former memory of the choice. If choice x is selected at time period t and an outcome Eix(t) is obtained, then the expected utility to choose x at time
period t+1 is updated as following:
(5)
where is the weight of recent experience on the expected utility of making a choice (please note that here is not the same as used in the statistic test in the previous section). An individual with a low value of is more influenced by her recent experience than previous experiences. The probability of choosing x at time period t can be calculated using the following equation:
(6)
There are many other individual learning models which can also be used to model learning process of travellers. In this study, we limit the models only to these three simple models. These models have been used in studying the dynamics in travel choice decision making, for example: simple heuristic model (Klügl and Bazzan, 2004), average return and weighted average return models (Avineri and Prashker, 2005). These models together with social learning models, which are explained in the next section, are used to analyse the results of the experiment.
3.4 Social learning models
In the second and third session of the experiment there are opportunities for each participant to access information about the choices and outcomes of other participants. In these conditions, social learning may occur between participants. Many social learning mechanisms may be available to people in the real world. In this study, we use three social learning models used in McElreath et al. (2005) to analyse the data obtained in the experiment.
The model is basically a combination of individual learning and social learning mechanisms. As seen in Equation 7, the first term is the individual learning term and second one is the social learning term. The strength of reliance on the social learning against individual learning mechanism depends on the value of parameter (0≤≤1). When i=0, individual i relies only upon individual learning, whereas i =1 means individual i relies only upon social learning. In the linear imitation model, Psix(t), the probability of choice x being made by individual i at
time period t after considering social learning process is calculated as following:
(7)
(8)
(9) wherethe probability Pix(t) may be obtained from any individual learning model (Equation 2,
4 or 6), Nsix(t) is the number of other individuals being observed by individual i who chose x
at time period t, Nsi(t) isthe total number of observed individuals, and j is an individual being
observed by individual i.
The second model is called the confirmation model. It is based on the idea that each individual is not simply imitating the choice of the target individual(s) but also practicing confirmation, which means that the individual is keeping her previous behaviour when the target individual(s) also previously chose the same choice. Otherwise, the individual relies only upon their own judgement. The probability of choice x being made by individual i at time period t is:
(10)
The following example illustrates the use of the confirmation model (Equation 10). There are 9 individuals in a group, where each of them selects travel mode x among available alternatives ( ; ). Individual i is able to observe the choices of the other eight individuals (Nsi(t)=8). Individual i’s strength of reliance on social learning is i is
assumed to be 0.3. At t=2, individual i chose b. At that time, among eight individuals who are being observed by individual i, the number of those who selected choice a is Nsia(2)=4, the
number of those who selected choice b is Nsib(2)=3, and the number of those who selected
choice c is Nsic(2)=1. Pia(3), Pib(3) and Pic(3) are individual i’s probabilities of making choices
If we assume that Pia(3)=Pib(3)=Pic(3)=1/3, then Psia(3)=0.28, Psib(3)=0.41, and Psic(3)=0.25.
Please note that the sum of probabilities resulted from Equation 10 is not always 1 as the equation is asymmetric; in this example . Thus, relative probabilities are used when an individual makes a decision (Psia’(3)= , Psib’(3)= and
Psic’(3)= ).
The last model is the conformity model which is based on the concept of majority/plurality influence. The model is applicable if the number of target individuals to be observed is at least three individuals. It is based on the idea that the choice of an individual may be influenced by the majority/plurality choice of target individuals. If there is no clear majority/plurality found, the individual depends only on her own judgement. In this study, there are more than two choices (26 choices) available so that a plurality is more likely to exist than a majority. The conformity model used in McElreath et al. (2005) is then modified to deal with it. When a plurality exists, the probability of choice x being made by individual i at time period t is:
(11)
When there is no plurality, the decision of individual i relies only upon the probability obtained in the individual learning model ( ).
Utilizing the same valuesof i, Nsix(t) and Pix(t) used in the example for Equation 10, we give
an example for calculating the probabilities of each choice being made by individual i. The plurality of other individuals’ choices is a, so that the probabilities of a, b and c being chosen by individual i at t=3 are:
The first two social learning models, the linear imitation and confirmation model, are used to analyse the results in Sessions 2 and 3 of the experiment. The conformity model is only applicable for Session 3 (with eight observed individuals for each participant) and not for Session 2 since the number of observed individuals in Session 2 is only one individual per round, which is less than the requirement of the conformity model (at least three individuals).
3.5 Analysis using the learning models
the payoff of choosing the lowest choice (0) and the highest choice (25) is £25, so that the difference between payoffs for two consecutive choices is only £1 (4% increment). This creates difficulties since the choices would seem continuous rather than discrete and participants might be indifferent to slightly different choices. For example, choosing 21, 22 or 23 days might not be perceived as different for the participant. It is also difficult to know how choices were categorized by the participants. For example: 0-10 days as one category (low contribution), then 11-19 as another category (medium contribution) and 20-25 as the final category (high contribution). Providing participants with fewer choices would be a better practice in further studies in order to ease the analytical process. For example by using weeks (0-5) as options may be better than using days (0-25).
Hit ratio (HR) is used as a measure of a model’s performance in fitting the empirical data obtained in the laboratory experiment. Parameter K is used to allow tolerance between the estimated value Ci’(t) and the measured value Ci(t) (Equation 12). The parameter may
represent participants’ sensitivity to the difference between choices. A higher value of K
represents a lower sensitivity. The value of K varies from 0 to 5. Hit-ratio is then calculated based on the correspondence of estimated choice of individual i in the model, Ci’(t), with
measured choice from the experiment plus/minus tolerance, Ci(t) ± K. We developed a small
computer application to ease the model fitting process in 500 runs with K = {0,1,2,…,5}.
(12)
The results of model fitting on the data obtained in Session 1 using three individual learning models: heuristic (H), average return (AR),and weighted return (WR, =0.5) provide almost the same performance so that in further analyses all of these models are used. Their average
HRs range from 0.2 at K=1 up to 0.65 at K=5.
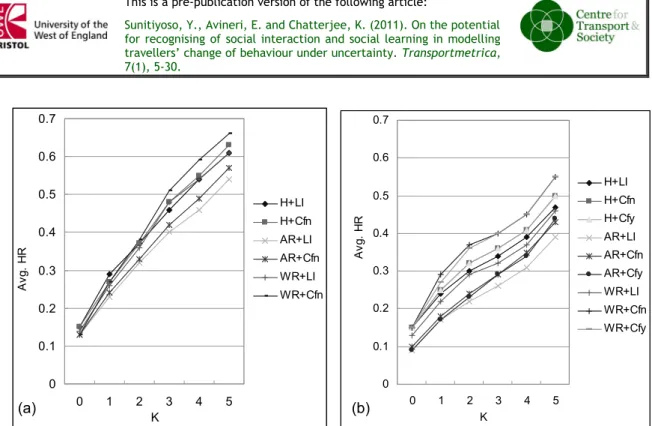
We then tested the combined models of individual and social learning on the data of Session 2 (Figure 2a). The strength of reliance on social learning (), for both the linear imitation and
0 0.1 0.2 0.3 0.4 0.5 0.6 0.7
0 1 2 3 4 5
K A vg . H R H+LI H+Cfn AR+LI AR+Cfn WR+LI WR+Cfn 0 0.1 0.2 0.3 0.4 0.5 0.6 0.7
0 1 2 3 4 5
K A vg . H R H+LI H+Cfn H+Cfy AR+LI AR+Cfn AR+Cfy WR+LI WR+Cfn WR+Cfy
Figure 2: Average HR for (a) Session 2 and (b) Session3 (H=heuristic, AR=average return,
WR=weighted return, LI=linear imitation, Cfn=Confirmation, Cfy=Conformity)
In Session 3, all combinations of individual and social learning model are tested (Figure 2b). The value of for the conformity (Cfy) model is derived from the relative strength between the score given by each participant in the post-experiment questionnaire to the variable ‘influence of the majority/plurality choice’ and the score of the variable ‘influence of own experiences’. Each combined model involving the Cfn model has a comparable performance to that of the Cfy model in all sets of combination with the individual learning models. Among all combined models, those involving the WR model (WR+Cfy and WR+Cfn) perform relatively better than other combined models. Again, the combined models involving the AR
model (AR+LI, AR+Cfn and AR+Cfy) have the lowest performance.
The results of model fitting show the performance of the individual learning models and the combined individual and social learning models for estimating the choices of the participants. Some forms of individual learning may exist in Session 1. However, it is not clear which form of individual learning exists since all three individual learning models give almost the same results. In Session 2, the combined individual and social learning models involving the
confirmation model perform better than those involving the linear imitation model. This gives an informed insight that participants might have adopted the confirmation model by keeping their previous choice if the observed individual(s) also previously made the same choice. This social learning model also gives a good performance in fitting the combined learning models with the results of Session 3. The confirmation model along with the conformity model, especially when they are combined with the weighted return model, provide relatively better performances than other combined models.
4. SIMULATION EXPERIMENT
In the simulation model, we simulate the situation presented in the laboratory experiment to a larger system with more individuals (the number of agents represented in the simulation is 4096), more repetitions (rounds), and various experimental settings. The motivation to have a large-scale simulation experiment is to test theoretical concepts and insights gathered from the literature review as well as the laboratory experiment rather than to compare or validate the
empirical findings of the small-scale laboratory experiment. These two approaches help illustrate conceptual issues related to social interactions and social learning.
The laboratory experiment and simulation experiment complement each other. While the laboratory experiment sought to measure social learning processes in a small group environment, the simulation experiment incorporated these social learning processes and tested different learning models and parameter values. The parameter, δ (introduced in section 3.4), represents the weighting on individual experience versus social information, and its value was estimated for each individual in the laboratory experiment with an average of 0.51 for the linear imitation and confirmation models and 0.64 for the conformity model. This is a rather high value, indicating reliance on social information. While it has not been tested in the laboratory environment on the lines of Olson’s (1971) study, it is likely that in a large group the value of δ will be lower than in small groups. A range of values of δ and the effects of different types of social learning (linear imitation, confirmation or conformity) were tested in the simulation experiments to examine the implications of different levels of reliance on social information.
An agent-based simulation approach is used given that it is able to simulate the behaviour of each person individually. The applications of this approach in travel behaviour modelling have shown promising potentials (e.g. Kitamura et al., 1999; Sunitiyoso et al., 2009; Sunitiyoso and Matsumoto, 2007; Zou and Levinson, 2006). A multi-agent simulation experiment is able to elucidate the dynamics of decision making processes, showing what course of ‘evolution’ a certain behaviour could have looked like over time.
4.1 Experimental design
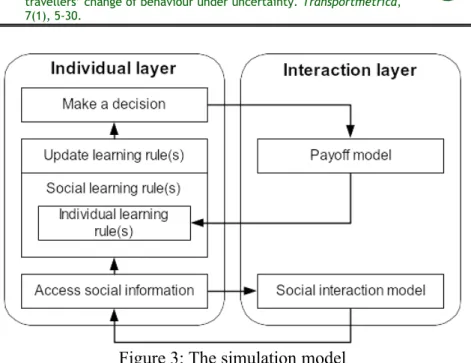
The simulation model consists of two layers (Figure 3): an individual layer where each traveller, who is modelled as an agent, updates their decision rules based on information collected from individual experience and social information about other agents’ behaviour, and then makes a decision; and an interaction layer where agents interact with each other and transmission of social information occurs between them. These two layers are connected by feedback mechanisms which exist between them.
In the individual layer, each agent undertakes cognitive process of individual learning and social learning, utilizing the results of information gained from the system about the outcome of the agent’s previous choice as well as information about other agents’ choices and outcomes gained from social interaction in the interaction layer. The individual learning rule is nested inside the social learning rule, with its strength depending on the value of parameter
(see Equation 7, 10 or 11). =0 means a maximum reliance upon individual experience, whereas =1 means a maximum reliance upon social information. We test all three social learning models explained in the previous section: linear imitation (LR), confirmation (Cfn)
and conformity (Cfy). As we put more emphasis on social learning rather than individual learning, only one individual learning model is used in the simulation model, which is the
Figure 3: The simulation model
Initial probabilities of making a choice are derived from the result of the laboratory experiment. Considering that choices are equally distributed between participants at the first round (as well as at the second and third rounds) of the laboratory experiment, it is then decided to use the assumption that agents’ initial probabilities are distributed randomly in the population of agents. The laboratory experiment obtained the result that the average bus use is 12.56 days, which means an equal proportion of choices in favour of bus use and car use, and there is a large variance of bus use (54.27) which means a large variety of choices have been made by participants. In other word, the choices are heterogeneous. In the beginning of a simulation run, each choice (from 0 to 25) has the same proportion of agents who choose it.
If data of initial probabilities are available, for example from a pre-experiment questionnaire, then agents’ initial probabilities could then be generated based on the distribution of initial probabilities data. Another alternative is to conduct sensitivity analysis of the simulation results against the initial probabilities of agents, by varying the initial probability values or varying their distribution in each simulation run (e.g. from 0 to 1 with increment 0.1). This will help in understanding the possible effects of initial probabilities on the simulation results, as the results can be input-dependent or path dependent. However it is the intention of the paper to derive the behavioural assumptions used in the simulation model as much as possible based on the findings and parameters used in the laboratory experiment.
4.2 Experimental results
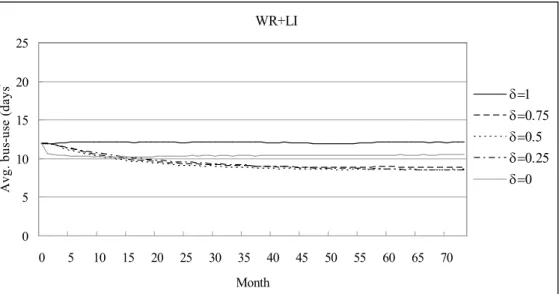
The influence of each social learning model on the decision making of agents is studied using the simulation model. Figures 4 to 6 show the dynamics of individuals’ average contribution (bus-use) simulated using three combined models: WR+LI, WR+Cfn, and WR+Cfy. The results presented in the figures are the average of 10 simulation runs. Each run consists of 1825 simulation days, containing 73 rounds of decision making (one decision made in every month; a month = 25 days). The value of for WR model is set to 0.5. The parameter s is set to 0.5, which means that the interactions happen 50% in lattice-structured network and 50% in random manner. The strength of reliance on social learning is varied, =0, 0.25, 0.5, 0.75, and 1. =0 means that individuals only learn individually using the weighted return (WR) model, while =1 means a total reliance on social learning (LI, Cfn, or Cfy).
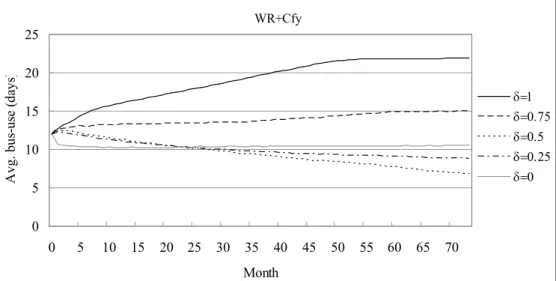
It can be seen from figures 4 to 6 that when =0 the average contribution is in equilibrium with just above 10 days of bus-use for all cases. In Figure 4, the WR+LI models with =0.25, 0.5, and 0.75 produce almost similar values of average contribution, which are lower than that of the case with =0. The highest average contribution is obtained from =1. In this case, the average contribution is stable from the beginning of simulation run until the end. On the other hand, with =1 the WR+Cfn model gives a different result, where the average contribution diminishes from round to round resulting in the lowest average contribution (Figure 5). The cases with other values of give average contribution that converge to an equilibrium point with around 10 days of bus-use. In the WR+Cfy models, strong reliance on social learning (=0.75 and 1) produces a higher level of average contribution than its initial contribution (Figure 6), while with =0.25 and 0.5, the average contribution diminishes until the end of the simulation.
WR+LI
0 5 10 15 20 25
0 5 10 15 20 25 30 35 40 45 50 55 60 65 70
Month
A
vg
. b
us
-u
se
(
da
ys
)
=1 =0.75 =0.5 =0.25 =0
WR+Cfn 0 5 10 15 20 25
0 5 10 15 20 25 30 35 40 45 50 55 60 65 70
Month A vg . b us -u se ( da ys ) =1 =0.75 =0.5 =0.25 =0
Figure 5: Dynamics of individuals’ average contribution in WR+Cfn models with =0, 0.25, 0.5, 0.75, and 1; s=0.5
WR+Cfy 0 5 10 15 20 25
0 5 10 15 20 25 30 35 40 45 50 55 60 65 70
Month A vg . b us -u se ( da ys ) =1 =0.75 =0.5 =0.25 =0
Figure 6: Dynamics of individuals’ average contribution in WR+Cfy models with =0, 0.25, 0.5, 0.75, and 1; s=0.5
The findings show that strong reliance on social learning may induce positive changes (increasing level of contribution) when a particular model of social learning mechanism, the
conformity model, is adopted by individuals. This finding is in line with findings in other studies (e.g. Smith and Bell, 1994; Henrich and Boyd, 1998; Sunitiyoso and Matsumoto, 2007). In contradiction to this, a strong reliance may also produce negative changes (decreasing level of contribution) when individuals adopt another social learning mechanism, the confirmation model. This result, however, is contrary to a study by McElreath et al. (2005). The study reported that the confirmation model outperforms the conformity model when the reliance on social learning is strong, although in other cases the conformity model always performs better than the confirmation model.
4.3 Analysis of convergence at system and individual level
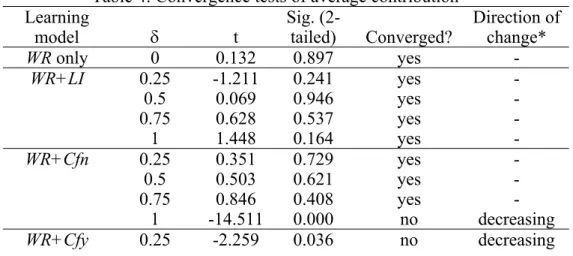
analysis is conducted by testing the changes of average contribution in the last 20 months using one-sample t-tests. Convergence is reached whenever there is no significant change of average contribution, or in statistical test, when the mean of change is not statistically different from zero.
Table 4 shows whether average contribution has reached its convergence point at the end of simulation run. It is reached with the WR only model, all of the WR+LI models, and most of the WR+Cfn models (except the one with =1 where the average contribution is still decreasing). The experiments using models of WR+Cfy have not yet reached their convergence points. The average contributions are still increasing for WR+Cf models with
=0.75 and 1 and decreasing for those with =0.25 and 0.5.
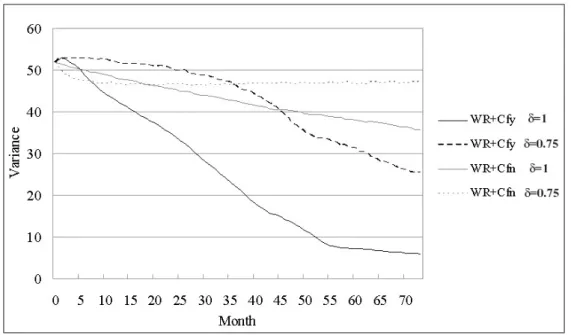
To know whether convergence of average contribution at system level corresponds to convergence of choices at individual level, the variance of agents’ choices is recorded during the simulation runs. Figure 7 shows the variances for the simulation experiments using
WR+Cfn and WR+Cfy, both with =0.75 and 1. As seen in the figure, simulation runs using
WR+Cfy model with =1 produced the lowest variance in the last 20 months, followed by
WR+Cfy with =0.75. These two models have not reached their (system) convergence points yet (see Table 4). For the WR+Cfn models, the scenario with =1 has not yet reached its convergence point and its variance is still decreasing. WR+Cfn with =0.75 has reached its convergence point, however, its variance is still relatively high. These results show that the convergence at system level does not necessarily correspond to convergence at individual level. Behaviour at individual level may be dynamic even when aggregate behaviour looks settled at the system level. This is in line with an argument by Goodwin (1997), supported by empirical observations of real-world travel behaviour by Goodwin (1998, p. 116), that ‘Even apparently settled aggregate patterns are based on a very high degree of volatility, movement and turnover at the individual level’.
However, convergence at individual level may reduce uncertainty. As seen in Figure 7, the strength of reliance on social learning () has a positive effect on increasing the rate of convergence at individual level (which is indicated by the decreasing value of variance). When the reliance on social learning is stronger, which means that agents learn from and are more influenced by other’s behaviour, the variance decreases faster. The decreasing variance of agents’ choices means that the level of uncertainty is also decreasing since the choices of agents become more homogeneous.
Table 4: Convergence tests of average contribution Learning
model t Sig. (2-tailed) Converged? Direction ofchange*
WR only 0 0.132 0.897 yes
-WR+LI 0.25 -1.211 0.241 yes
-0.5 0.069 0.946 yes
-0.75 0.628 0.537 yes
-1 1.448 0.164 yes
-WR+Cfn 0.25 0.351 0.729 yes
-0.5 0.503 0.621 yes
-0.75 0.846 0.408 yes
-1 -14.511 0.000 no decreasing
0.5 -9.371 0.000 no decreasing 0.75 3.115 0.006 no increasing
1 2.776 0.012 no increasing
Note: * This refers to the direction of changes to the contribution (average bus-use) which can also be visually indicated in Figures 4, 5, and 6.
5. ON THE LIMITATIONS OF THIS STUDY
The number of participants in the laboratory experiment is admittedly small, however it is justified because the data from each subject offers a reasonably large number of decision observations (9 participants x 10 rounds x 3 treatments = 270 observations). Also the study takes on an approach of understanding the decision process of each individual, then finding a commonality of behaviour, if at all, across all the rounds in the three experimental treatments for the respective individuals. It is not assumed in the study that there is an existence of a universal model that captures all facets of decision making. There are diverse decision making styles and behaviours of individuals in the experiment, and the diversity is also likely to be the case among the population in real world situations. These reasonably large number of elements (decision observations, interaction, and decision making style) provide a justification that the findings are based on a data set of suitable size. In order to generalise the findings of the laboratory experiment to a wider population and to different travel choice contexts further empirical research should be carried out, specifically with similar group sizes as well as with testing social learning in different group sizes.
In a study of social interactions where interdependency exists, a small size of group means that the actions of a group member can be expected to have a greater effect on other group members compared to the situation with a large group size. Thus the effects of the interactions might be more able to be observed. Within a small group, the action of a single individual may have more influence on others than in a large group and ‘free-riding’ is more easily recognised in a small group, thus it may make group cooperation or non-cooperation more volatile than that of a larger group size. In a larger group size (e.g. hundreds or thousands of individuals) the amount of ‘free-riding’ may increase since it will be less likely to be recognised and there may be less sense of belonging to the group when the size is large. Group size is also relevant to whether its member would contribute to collective action. Olson (1971)’ experimental study found that a small group of individuals is more likely to secure voluntary compliance than a larger one if repeated interactions and communication occur between its members. The simulation experiment is used to test in a large group size the effects of and the effects of the type of social learning (linear imitation, confirmation or conformity), which were not possible to be clearly observed in the laboratory experiment. It was found that, for the linear imitation and conformity models, weak social learning produces less cooperation and strong social learning produces more cooperation. While for the confirmation, the results are the opposite. Both linear imitation and conformity models are basically social learning models which are based on the ‘strength in number’ - a choice is more likely to be chosen by an individual if it has been chosen by others, regardless of whether the same choice has been previously chosen by the individual – thus a large group situation is generally more favourable for these types of social learning. While the confirmation model is taking into account the similarity between the individual’s previous choice and others’ choices.
actions of its members and not modelled using an external random parameter. An adjustment of the experimental setting by allowing each group of participants to take part only in one session may make the results in a session independent from the other sessions and completely eliminate the possible influence of experience in the preceding session on the behaviour in the succeeding session. However, it may also make the situation less realistic, since interdependence between choices in different situational settings in subsequent time periods is natural. In the real world, an individual may learn only from their own experience in the beginning and then learn from others, or the other way around.
6. CONCLUSIONS AND FURTHER RESEARCH
In this work, we studied the influence of social interaction and social learning on travellers’ behaviour under uncertainty using an inductive methodology. The type of uncertainty addressed in this paper is uncertainty in the mind of travellers about the choices of other travellers. Two methods of study, laboratory and simulation experiments, are used to demonstrate the ways of incorporating these aspects in travel behaviour modelling. A social interdependency situation which is formulated as a hypothetical employer-based demand management initiative is used as the case study.
It is demonstrated in the study that a laboratory experiment can be used as a tool to capture the dynamics of travellers’ decision making over time. Analysis of group behaviour indicates the existence of individual learning in the first session of the experiment. There is also an indication that giving participants access to social information about others’ behaviours may influence their behaviour. It is supported by the results of investigations of individual behaviour which show that confirmation and conformity models are likely to exist whenever individuals have access to social information. The results of the laboratory experiment are used for developing a multi-agent simulation model in the second stage of the study. The model extends the laboratory experiment with more individuals, longer repetitions and various experiment settings. The simulation experiments provide indication that strong reliance on conformity model of social learning may have a positive effect shown by increasing level of contribution, while strong reliance on confirmation model produces a
negative effect by decreasing level of contribution. These indications are supported by evidence obtained from the laboratory experiment. The simulation experiments also revealed that a stable/settled aggregate behaviour at system level does not necessarily correspond to stability of behaviour at individual level. However, when convergence exists at individual level as the result of strong reliance on social learning, uncertainty in the system can be reduced as individual choices become more homogeneous.
The two types of social learning, confirmation and conformity, may exist in real life. An individual with confirmation mechanism of social learning imitates the behaviour of other individuals who have had similar behaviour in the past. For example, a car user may give more consideration to changing their travel mode to bus after observing their friends/colleagues, who used to go by car, changing their travel mode to bus, rather than when observing those who were not car users. At the same time an individual with conformity
has a more prominent role than the negative effect (which occurred in the simulation experiment). For example, we need to ensure the existence of ‘desirable’ examples, who are people who have changed their travel mode into a more sustainable one. Their involvement would induce cooperation of a critical mass of people which will later encourage more people to cooperate through conformity mechanism (majority influence).
Travel mode choice decisions can sometimes be framed as social dilemmas or public goods dilemmas where travellers share the public goods (e.g. roads) and make travel mode decisions (e.g. private car or public transport, car sharing or driving alone) that influence the well-being of other road users. This interdependence of decisions makes possible social interactions and sharing of information between travellers. Due to the externalities in the transport system, such as congestion and environmental costs, many people would prefer satisfying their personal well-being (e.g. personal benefits offered by private car) than collective well-being. This results in traffic congestion and other environmental impacts. Understanding travellers’ social interaction and social learning processes could help in better predicting behavioural responses to uncertainty.
Experiments provide a useful approach to the study of complex human decision systems, but they are primarily intended to develop the underlying theoretical constructs (Mahmassani and Jou, 2000). Experiments are based primarily on simulated situations which do not correspond closely to travellers’ real world contextual settings. Therefore, observation of actual behaviour in the real world is required to confirm the substantive conclusions resulting from such experiments. This will also help in ensuring the validity of the results in representing a wider population (e.g. a larger system than a small system of a workplace). A stated-preference field experiment or panel survey with a representative sample would provide substantial evidence which would confirm the findings in this study. In the field study, we would need to probe participants on what aspects, particularly social interaction and social learning, have influenced changes of behaviour where they occurred.
ACKNOWLEDGMENT
The authors would like to thank three anonymous referees for their constructive and useful comments and suggestions for improving this article.
REFERENCES
Ampt, E. (2003) Voluntary household travel behaviour change: theory and practice. Paper presented at the 10th International Conference on Travel Behavior Research. Lucerne. Arentze, T. and Timmermans, H. (2005) Modelling learning and adaptation in transportation
context. Transportmetrica, 1 (1), 13-22.
Artigiani, R. (1998) Social information: the person is the message. Biosystems, 46, 137-144. Avineri, E. and Prashker, J. N. (2005) Sensitivity to travel time variability: Travelers' learning
perspective. Transportation Research C, 13 (2), 157-183.
Avineri, E. & Prashker, J. N. (2006) The impact of travel time information on travelers' learning under uncertainty. Transportation, 33 (4), 393-408.
DeJong, W. (2002) The role of mass media campaigns in reducing high-risk drinking among college students. Journal of Studies on Alcohol, Supplement No. 14, 182-192.
DfT (2004) Transport analysis guidance: Values of time and operating costs. Available via Webtag. http://www.webtag.org.uk/webdocuments/3_Expert/5_Economy_Objective/ 3.5.6.htm. Cited 6 Nov 2006.
DfT (2007) Transport Trends: 2007. Available via Department for Transport, London. http:// www.dft.gov.uk/pgr/statistics/datatablespublications/trends/current/
transporttrends2007. Cited 10 September 2008.
Van Vugt, M., Meertens, R. M., and Van Lange, P. A. M. (1995) Car versus public transportation? The role of social value orientations in a real-life social dilemma.
Journal of Applied Social Psychology, 25, 258-278.
Van Vugt, M., Van Lange, P. A. M., and Meertens, R. M. (1996) Commuting by car or public transportation? A social dilemma analysis of travel mode judgments. European Journal of Social Psychology, 26,373-395.
Zadeh, L. A. (1965) Fuzzy sets. Information and Control, 8 (3) 338--353.
Zou, X. and Levinson, D. (2006) A multiagent congestion and pricing model.