s.Americ~ati~ So+ty’ of Range Management
.The American Society of Range Management ‘was created allied technologists, and to encourage professional improvement in 1947 to foster advancement in the science and art of grazing of its members.
land management, to promote progress in the conservation and Persons shall be eligible for membership who are interested greatest sustained use of forage and soil resources, to stimu-, in or engaged in practicing -range or pasture management. or
late discussion and understanding of scientific and practical ahimal husbandry; administering grazing lands ; or teaching, range and pasture problems, to provide a medium for the or conducting research, oy engaged in extension activities in exchange of ideas and facts among society members and with range or pasture management or related subjectsr
T
he JOURNAL OF RANGE MAN-AGEMENT, published bi-monthly, is the official organ of the American Society of Range Management. The Society, however, assumes no responsibility for the statements and opinions expressed by authors and contributors.
Off ice, Executive Secretary. Address all inquiries and correspondence including memberships, renewals, replacements of JOURNALS, etc., to Executive Secretary, American Society of Range Management,
P.O. BOX 5041, Portland 13, Oregon. Dues. Membership dues should be sent to the Executive Secretary. The dues are $8.00 per year including a subscrip- tion to the JOURNAL OF RANGE MAN- AGEMENT. Dues for student members are $4.00 per year, including the JOURNAL. All subscriptions mailed outside the North American continent and insular possessions of the U. S. are $8.50 per year. Subscrip- tions must be paid in advance. Remit by draft or check on U. S. banks in U. S. funds.
Reprinting. The reprinting of articles or parts of articles published in the JOURNAL OF RANGE MANAGEMENT is author- ized on the express condition that full credit be given the JOURNAL and the author. The date of original publication must be shown with the credit line.
Posf Office Entry. Second-class post- age paid at Portland, Oregon, and at ad- ditional offices.
Change of Address. Notices of change of address should be received by the Execu- tive Secretary one month before the date of issue on which the change is to take effect. Both the new and old addresses should be
sent to the Executive Secretary, American Society of Range Management, P.O. Box 5041, Portland 13, Oregon.
Printers. The Nebraska Farmer Company, 1420 P Street, Lincoln, Nebraska.
Copyright 1961 by the Ayerican Society of Range Rlanagemenr.
JOURNAL OF RANGE MANAGEMENT
EDITOR
E. J. WOOLFOLK
Pacific Southwest Forest & Range Exp. Sta. Berkeley 1, California
EDITORIAL BOARD 1959-61
GEORGE E. GLENDENING U.S. Forest Service
Tempe, Arizona
ARNOLD HEERWAGEN W. J. MCGINNIES
Soil Conservation Service Agricultural Res. Service 321 New Customs Building Fort Collins, Colorado
Denver 2, Colorado
1960-62 F. A. BRANSON U.S. Geological Survey
Federal Center Denver, Colorado
L. T. BURCHAM LYNN RADER
California Division of Forestry Sacramento, California
University of California Berkeley, California 1961-63
ALEX JOHNSTON Canada Agric. Res. Sta.
Lethbridge, Alberta
HAROLD A. PAULSEN DONALD F. BURZLAFF
U.S. Forest Service Fort Robinson Res. Sta. Fort Collins, Colorado Crawford, Nebraska
OFFICERS OF THE SOCIETY President:
V. A. YOUNG 733 West 2nd St.
Mesa, Arizona President Elect:
E. WM. ANDERSON
Executive Secretary: JOHN G. CLOUSTON
215 N.W. 10th P. 0. Box 5041
Pendleton, Oregon Portland 13, Oregon BOARD OF DIRECTORS
1959-61
JOHN CHOHLIS C. H. MCKINNON
Western Livestock Journal LK Ranches, Ltd. Sacramento, California Calgary, Alberta
1960-62
KARL G. PARKER GERALD W. THOMAS
Montana State College Bozeman, Montana
Texas Technological College Lubbock, Texas 1961-63
AVON DENHAM OTTO J. WOLFF
Box 4137 912 St. Patrick St.
Portland 8, Oregon Rapid City, S.D. Past President:
FRED H. KENNEDY U. S. Forest Service Albuquerque, N. Mex.
IN THIS
ISSUE
Light Grazing-Is If Economically Feasible As A Range-Improvement Practice.__._... _____ ____ ______ ______.._ ____ _________________ ____ ._.G. E. Klipple and R. E. Bement
An Application Of The Point-Centered Quarter Method To The Sampling of Grassland Vegefafion..._____~_____~~_.______ _____ _____________ _______ _ _________ Ralph L. Dix Society Members Develop Grazing Plan..._______.~_____._____~ohn D. Freeman
Continuous Versus Repeaied-Seasonal Grazing Of Gras&-Alfalfa Mixtures At Swift Current, Saskafchewan... ____ ____ ____ ________________ ___.” . . . ..J. B. Campbell
Trends In Carrying Capacity And Vegetation On An Arid Soufhwesiern Range ________ ___ _____________ __________ __.___ . . . ..HaroZd A. Paulsen, Jr., and Fred N. Ares
Range And Livestock Of Kodiak Island _________ _ _____ ___ ____.__ __.__ ______.___ Von J. Johnson
Grass Seed Production From Seeded Range Lands
Chester L. Canode and J. K. Patterson
Comparison of Coastal And Common Bermuda-Grass On A Shallow Droughfy Soil ________ __________ ______ E. R. Beaty, D. D. Hayes, and R. A. McCreery
Some Of The Beginnings Of Range Management
M. W. Talbot and F. P. Cronemiller
Use Of Asphalt-Emulsion Mulches To Hasten Grass-Seedling Establishment R. E. Bement, D. F. Hervey, A. C. Everson, and L. 0. Hylton, Jr.
Book Reviews: Wafer and Agriculture (Hockensmifh): Land for fhe Future (Clawson,, Held,, and Sfoddard): Phofogrammefry and Phofo-Infer- pretakion @purr): Resources Developmeni: Frontiers for Research
(Pollak)
Current Literaiure __________ _ _______ _ _________________ _ ._________ _ ______ __________ _______ ____________ __________ _______________
With the Sections _________ _ ____ ___ __________ ____________ __._ _ _______ _____________________________________ _______ ___._____________
News and Notes._. _______: _______ _ _________________ _____ _..._____ _ __.__ __________ ._._..____ ____________ ________ __ _______ _ ____.__ _
Society Business _______.____________._______ ______ ____._____ _ _._____ _.___________ ______._ ___ ____ ____ _______ _ _____ _ ________ ______ 57
63
70
72
78
83
88
92
95
102
109
112
114
115
116
Cover Photo-A
Rancher’s Practical Answer
YOUR
Emblemsare
14 carat
gold filled,
with no enamel
and no Society name.
These will be available
at the office of
the Executive
Secretary on October
15,
in lapel
buttons,
tie bars and
lariat
slides as pictured.
The old emblem
is still recognized
as official
but no more will be made.
Keep them,
they’ll
be collectors
items
some day. We have a few of them left
which will be sold at the old price, but
they are mighty
few.
If you want one
order now.
NEW
EMBLEMS
These are the new Society emblems
approved
by the Board of Directors
at
their meeting at Custer.
Use the coupon below to order new emblems. Make checks payable to American Society of Range Management.
American Society of Range Management P. 0. Box 5041, Portland 13, Oregon
Enclosed find (check), (money order) (cash)
in the amount of $ for:
Lapel Button $2.60 each (no.1
Tie Slide $2.75 eat h
(no.1
Tie Clasp $3.25 each
(no.1 Name
(Please print)
Address
AGRICULTURAL
AID
for Agriculture
l Vegetation Analysis o Range Surveys
l Range Management
l Electronic Instruments
l Aerial Contractors (spray, dust, reseed)
Write: Ag Aids Box 611, Worland, Wyo.
Journal
of
March 1961 Volume 14, Number 2RANGE MANAGEMENT
Light Grazing -is it Economically Feasible as a
Range-Improvement Practice1
G. E. KLIPPLE AND R. E. BEltlENT=
Range Conservationists, Crops Research Division, Agri- cultural Research Service, U.S. Department of Agricul- ture, Fort Collins, Colorado.
Light grazing of range vegeta- tion has been recommended for many years as a grazing-manage- ment practice for the impro:le- ment of deteriorated native ranges, Cotton (1905)) Jardine and Anderson (1919)) Sampson (1914)) and Smith (1895). Range- land operators have not .gener- ally realized the possibilities for improvement in the yield and quality of their forage through the management of livestock grazing. Stocking for light utili- zation of deteriorated native veg- etation to give it a chance to re- cover its productivity, has been used little. Most of the reasons advanced for not using light grazing more, relate to the eco- nomic feasibility of its use.
Rangeland operators and man- agers should and do very proper- ly want answers to several ques- tions concerning recommenda- tions for changes in their grazing operations before a d o p t i o n .
1 Contribution from Crops Research Division, Agricultural R es e ar c h Service, U. S. Department of Agri- culture, in cooperation with the Rocky Mountain Forest and Range Experiment Station, maintained by Forest Service, U. S. Department of Agriculture and Colorado State University, Fort Collins, Colorado. 2 Formerly range Conservationists,
Forest Service and Soil Conserva- tion Service, U. S. Department of Agriculture, respectively.
Questions such as; what will it cost, can it be used for my ranges, how long will it take to obtain results, can it be ex- pected to pay off, have high priority in their thinking about changes in grazing operations. A majority of rangeland operators and managers are willing, we be- lieve, to apply range-improve- ment procedures, when t h e y realize that forage production is not what it might be, and in- formation on practical improve- ment procedures is available to them.
There are limitations in the application of light grazing as a range-improvement p r a c t i c e. These limitations are no more restrictive, however, than those for other methods that might be used for range improvement. Light grazing has not received the consideration it merits for the improvement of deteriorated perennial range vegetation.
Investigation of this thesis re- quires a clear understanding of a few fundamental concepts of rangeland operation. The growth of palatable herbage produced each year is the renewable natu- ral resource of rangelands. It is the crop. The domestic livestock and wild game that graze this herbage are the harvesting and marketing media. Financial prof- its are the prime motive for
57
range-livestock o p e r a t i o n s .
Maintenance of the resource is essential to continuing profits. Efficient rangeland management maintains or improves the re- source and then pays a good re- turn for the forage that is re- moved by grazing animals.
Definition of Terms and Conditions
Grazing management is the science and art of using livestock to harvest and market range and pasture forage. It is a highly im- portant segment of the broader field of r a n g e management. Grazing management is very closely interrelated with other segments of range management, such as; soil and water manage- ment, and undesirable plant con- trol; in their effects on the vol- ume of palatable herbage pro- duced on rangelands and on the economy of rangeland operation. It is applicable wherever grazing animals are used to harvest range vegetation.
58 KLIPPLE AND BEMENT
bage production by grazing-man- agement practices alone.
Definitions of grazing inten- sities also are pertinent to this discussion. Three terms (heavy-, moderate-, a n d light-grazing) have been used widely in range- management literature to desig- nate broad differences in inten- sities of herbage utilization by livestock. Heavy grazing as used herein means a degree of her- bage utilization that does not permit the desirable forage species to maintain themselves. Its continued application leads to deterioration of the range vege- tation. Moderate grazing means a degree of herbage utilization that allows the palatable species to ma in t ain themselves but usually does not permit them to improve in herbage-producing ability. Moderate grazing leads to the stabilization of existing range conditions. Light grazing means a degree of herbage utili- zation that leaves to the palat- able species, sufficient of their current growth to develop her- bage-producing ability to the maximum of the site capacity. Light grazing leads to the im- provement of deteriorated range condition up to the site capacity.
Gross forage income per acre, as used in this analysis, is the value returned per acre by the livestock that grazed the range vegetation. A rangeland man- ager can compute this value with little difficulty for each grazing unit he operates, as well as, for his entire grazing operation.
Range Improvement from Light Grazing
The effects of light grazing on deteriorated range take several forms, increased little cover, re- tarded water runoff and in- creased water infiltration into the soil, reduced soil erosion, im- proved vigor of palatable plants, increased herbage growth, and improved variety and quality of the forage. Not all of these effects are to be expected from every application of light graz-
ing. Rangeland operators natu- rally are more interested in in- creased yields and quality of for- age than in other effects of light grazing. The other effects should not be ignored by rangeland operators, however, in making decisions concerning light graz- ing for range improvement.
Range herbage yields as affec- ted by grazing intensity have been reported from a few graz- ing-intensity studies in recent years. J o h n s o n et al. (1951) grazed west-central South Dako- ta midgrass r a n g e vegetation with cows and calves at heavy, moderate, and light intensities 1942 through 1950. Three-year (1942-1944) average yields of air- dry herbage were 1399, 1409, and 1636 pounds per acre respective- ly from heavily-, moderately-, and lightly-grazed pastures early in the experiment. Correspond- ing 3-year (1948-1950) average yields were 974, 1454, and 2157 pounds per acre. Heavy grazing reduced yields over 400 pounds per acre, moderate grazing main- tained yields and light grazing allowed yield increases of over 500 pounds per acre.
Launchbaugh (1957) grazed yearling beef cattle on west- central Kansas short-grass range vegetation at stocking rates of 2.0, 3.4, and 5.1 acres per head- season, 1946 through 1956. He used a May l-October 28 grazing period and vegetation condition was considered uniform among pastures in 1946. Herbage yields determined in 1956 were 1096, 1245, and 1963 pounds per acre, respectively from the heavily-, moderately-, and lightly-grazed pastures. Water infiltration rates on his pastures after 7 years application of the grazing treat- ments were 0.73, 1.19, and 1.58 inches per hour, respectively, for heavy, moderate, and light graz- ing.
North-central Colorado short- grass range v e g e t a t i 0 n was grazed at 3 intensities by year- ling heifers during a 6-months warm season, 1940 through 1953
in studies conducted by Klipple and Costello (1960) . Three-year
(1940-1942) average yields of air- dry blue g r a m a (Bouteloua
gracilis) and buffalograss (Buch-
Zoe dactyloides) herbage were
668, 654, and 591 pounds per acre respectively from the heavily-, moderately-, and lightly-grazed pastures early in the experiment.
Similar 3-year (1946-1948) aver- age yields, six years later, were 470,668, and 657 pounds per acre. Herbage yields from the heavily- grazed pastures were significant- ly less than they had been in the earlier period. Yields from the moderately-grazed pastures were
practically the same as in the earlier period. Yields from the lightly-grazed pastures had in- creased to approximate equality with those from the moderately- grazed pastures. Herbage yields from the taller midgrasses, such as; western wheatgrass (Agro-
pyron smithii), n e e d 1 e-an d -
thread (Stipa comutu), alkali sacaton (SporoboZus uiroides),
sand dropseed (Sporobolus cry-
ptundrus), and prairie sandreed
(CuZumoviZfu Zongifoliu) w e r e
not obtained in the early years owing to their low production. Midgrass yields were obtained after 1948. Their collective aver- age yields in 1949 were 62, 122, and 243 pounds of air-dry her- bage per acre respectively from the heavily-, moderately-, and lightly-grazed p a s t u r e s . The yield of midgrass herbage from the lightly-grazed pastures was significantly larger than the mid- grass herbage yield from the moderately-grazed pastures that year, and this relationship was repeated in 9 of the 10 following years, (unpublished data avail- able to the authors).
The effects of light grazing on deteriorated short-grass vegeta- tion were investigated by the Rocky Mountain Forest and Range Experiment Station, in a heretofore unreported study at Central P 1 a i n s Experimental Range,3 Nunn, Colorado, from
rated vegetation on three half- section pastures received light utilization by yearling steers during an early-May to early- November grazing season each year. Data, from pastures in an- other study that were stocked with yearling steers for moder- ate utilization of shortgrass vege- tation in good range condition during the same grazing season, were available each year to give v e g e t a t i 0 n response, cattle weight gain, and price data com- parisons with the data from the pastures that were 1 i g h t ly grazed.
Yields from the palatable grasses on the lightly-grazed pastures averaged 560 pounds of air-dry herbage per acre in 1943. Yields from the same grasses that year on the moderately- grazed pastures averaged 800 pounds per acre. Average yields from the palatable grasses in 1951, a year when averag.e her- bage production was similar to that of 1943, were 740 pounds per acre on the pastures that had been moderately grazed and 815 pounds per acre on the pastures that had been lightly grazed. Moderate grazing had approx- imately maintained herbage-pro- ducing ability while light graz- ing had fostered a 45 percent in- crease in the herbage-producing ability of the range vegetation that had been in a deteriorated condition in 1943. I n c r e a s e d stocking was required after 1949 to obtain the planned 25 percent utilization of the forage, on the lightly-grazed pastures. This in- creased herbage-producing abili- ty of the vegetation on those pastures has been maintained under moderate utilization of the vegetation during 6 recent years,
3 Operated by AgricuZturaZ Research Service, in cooperation with Forest Service, U. S. Department of Agri- culture. Formerly operated by the Rocky Mountain Forest and Range Experiment Station, Forest Service, in cooperation with the Soil Con- servation Service, U. S. Department of Agriculture.
LIGHT GRAZING
(unpublished data available to the authors).
Johnson’s (1953) grazing-in- tensity study on the ponderosa pine-bunchgrass ranges of the Colorado front range did not de- velop measured differences be- tween herb age yields from moderately- and lightly-grazed pastures. Light grazing,did, how- ever, develop a larger percentage of the herbage from the more desirable species than the per- centage developed by moderate- grazing.
These research results demon- strate that the application of light grazing does effect im- provement in the yielding ability of deteriorated range vegetation. They indicate also that most of this improvement is obtained in the first 5 to 7 years of its ap- plication, and that added im- provement in range condition from light grazing alone is very small after 7 years of its applica- tion.
Evaluation of Costs and Returns from Application of Grazing-
Management Practices Simple and easy methods have not been developed to evaluate the costs of or the returns from
59.
the application of range-im- provement procedures, Caton et al. (1960). The necessity of using livestock to harvest and market range forage has contributed materially to these difficulties. A number of indirect costs and re- turns accompany livestock graz- ing operations. Most of these in- direct items are often very simi- lar for the two or three grazing- management practices that a rangeland operator can use.
Under those conditions differ- ences in gross forage income per acre appear to be fair criteria to evaluate the economic possibili- ties of applying one or another of the grazing-management prac- tices that could be applied. Dollar and cent values per acre of rangeland also are the most realistic expressions of these types of data.
In this connection rangeland operators and managers, in choosing between or among available grazing p r a c t i c e s , should make their computations and comparisons in relation to the deteriorated range vegeta- tion on which they plan to use the practice. The grazing pro- c e d u r e s under consideration should be compared on the basis
Table 1. Gross forage incomes per acre developed from applying three methods of obtaining caffle fo harvest and market forage to average dafa from recently published grazing-infensify siudies. 4 Authority and grazing Methods of obtaining cattle1
intensities a b c
--_ (Dollars) - - -
Johnson, W. M. (1953)
Heavy (5 mos.) 1.24 0.74 0.88
Moderate (5 mos.) 1.10 0.88 1.48
Light (5 mos.) 0.63 0.49 1.05
Launchbaugh, J. L. (1957)
Heavy (5.3 mos.) 7.95 6.89 -3.65
Moderate (5.8 mos.) 5.12 6.51 4.97
Light (5.9 mos.) 3.54 5.14 5.21
Klipple, G. E. and D. F. Costello (1960)
Heavy (6 mos.) 1.88 1.41 1.54
Moderate (6 mos.) 1.12 1.20 1.93
Light (6 mos.) 0.73 0.86 1.41
1 a. A rental fee of $3.00 per head-month of yearling grazing; adpoted as representative of western range practice, from average data for the 1957, 1958, and 1959 grazing seasons provided by the Crop Reporting Board, Agricultural Marketing Service, U.S.D.A.
60
of stocking rates that would apply them to the herbage pro- duction of the deteriorated range vegetation.
Rangeland operators and man- agers who have forage to harvest and market can obtain livestock to do it under any one of a wide variety of arrangements. Three methods that are in use in the range states, have been used in this analysis to compare gross forage incomes per acre obtained from light and other intensities of grazing with yearling cattle. These are:
a.
b.
C.
A grazing rental fee per head-month of grazing. A fee per head-season com- puted from one-half the cattle weight gain per acre at the fall price of the cattle.
Spring purchase and fall sale of the cattle.
These methods of marketing range forage are referred to hereafter in this analysis as methods a, b, and c respectively. The indirect items furnished and received by the party who con- trols the forage are very similar for each intensity of stocking under each method, but these items differed among methods. Forage incomes per head were divided by acres of rangeland grazed per head to give per acre gross forage income values pro- duced by grazing intensities.
A few grazing-intensity re- search studies have reported, in recent years, data applicable in this analysis, Johnson (1953)) Launchbaugh (1957), and Klipple and Costello (1960). For- age incomes per acre were com- puted by methods a, b, and c for the average data reported by these studies (Table 1) , on the assumption that the average her- bage productions per acre on the pastures were nearly equal early in the experiments. These meth- ods also were applied to data, from the previously unreported study with ye a r 1 in g steers, carried out at Central Plains Ex- perimental Range and cited
KLIPPLE AND BEMENT
above, to give year by year (1943-1952) comparisons of gross forage incomes from stocking for light and moderate utilization of deteriorated range vegetation. Ten-year averages, only, are re- ported.
Method a data, in Table 1, make stocking for heavy utiliza- tion of the range vegetation ap- pear to be the most profitable grazing procedure to use. They indicate also why abuse of the vegetation has been frequent under this method of marketing forage, and why many cattle owners demand acreage guaran- tees per head-season in connec- tion with paying a fee per head- month of grazing. Marketing range forage by method a has contributed materially, we be- lieve, to rangeland operators’ be- liefs that stocking for light graz- ing for range improvement has little chance of paying off.
Method b data, where cattle weight gains and cattle prices were included in the forage in- come computations, show that the advantage of heavy grazing over moderate grazing disap- peared for one study and was materially reduced for the other two. The small differences in favor of heavy grazing could have been offset easily by de- terioration in the range resource. Differences between forage in- comes from moderate grazing and those from light grazing were reduced s 1 i g h t 1 y under method b as compared with those under method a.
The possible highly-variable costs, for the use of cattle to do the grazing, as influenced by stocking rates were accounted for in the method c forage in- comes. Moderate g r a z i n g re- turned larger forage incomes than heavy grazing in all three studies. Forage incomes from light grazing were larger than those from heavy grazing in two of the three studies, and only slightly smaller in the third study. Light grazing also pro- duced a higher forage income per
acre than moderate grazing did in one study.
Light grazing of deteriorated range vegetation at Cent r a 1 Plains Experimental Range was obtained in 1943, 1944, and 1945 with an average stocking rate of 21.5 acres per yearling steer for a 180-day season. Acres per head season varied from 22.5 in 1943 to 17.8 in 1952, and averaged 20.5 acres. It was computed that stocking this vegetation for moderate grazing would have re- quired a uniform rate of 16 acres per steer season. Method a
annual forage incomes per acre from moderate grazing would have ranged from 32 cents to 11 cents larger and averaged 24 cents larger than those obtained from light grazing during the 10 years 1943-1952 (Table 2). Meth- od b annual forage incomes per acre from m o d e r a t e grazing would have varied from 35 cents to 5 cents larger and averaged 17 cents larger than those obtained from light grazing during the same years. Method c annual for- age incomes per acre from moderate grazing were larger than those from light grazing in 5 of the 10 years, and the rela- tionship was reversed during the other 5 years. Light g r a z i n g averaged 7 cents larger income for the lo-year period. These data demonstrate that rangeland operators can apply light grazing for range improvement at rela- tively low costs per acre. Those who are harvesting forage with cattle they own can apply light grazing to a grazing unit for a few years with little or no reduc- tion in gross forage income from the unit.
Comparative Co&s of Alfernafe Range-Improvemenf Practices
LIGHT GRAZING 61
Table 2. Ten-year average gross incomes per acre from fhe forage on deteriorated rangeland markefed fhrough grazing yearling sieers af a lighi infensify of herbage ufilizafion, 1943-1952, af Cenfral Plains Ex- perimenial Range; and fhe gross incomes per acre fhaf fhe same range would have made had fhe pasiures been sfocked for moderafe grazing during fhe same years, as defermined by fhree mefhods of selling range-forage.
Method of obtaining use of cattle
Forage income per acre Grazing intensity
Light Moderate Difference
_-_--- (Dollars) - - - -
;
0.88 1.70
C 2.75
desirable forage species to re- cuperate, change the season of use, defer and rotate grazing, or select one or more of several alternate range-improvement practices. Alternate m e t h o d s often recommended for range improvement are non-use for 2 or 3 years, control of undesirable species to reduce competition, mechanical t r e a t m e n t s like pitting or contour furrows to re- duce water runoff, fertilization, and reseeding to more produc- tive species. The major elements involved in selecting a method are the condition of the range, costs of applying the method, time required to get results, and the value of the probable in- crease in herbage production. What are the costs of using some of these alternate methods?
Non-use eliminates all income for the years it is applied, and fixed charges have to be met. Its annual cost for the four studies discussed previously would have been three to many times the cost of applying light grazing.
Control of undesirable speices to reduce competition t a k e s several forms; mowing, burning, and chemical and mechanical treatments. Numerous reported costs range from as low as 50 cents to as high as 15 dollars per acre. Furthermore, damage to the desirable forage species by the control method may require a year or two of non-use, light grazing, or reseeding of the treated area for desirable species to take control of the site again.
1.12 -0.24
1.87 - .17
2.68 .07
-
Mechanical treatments such as pitting, chiseling and contour furrowing require equipment and power to pull it. Cash out- lays ranging from 2 to 4 dollars per acre usually are required. The desirable forage species are damaged to some extent, and they may require a year or more to regain their before-treatment production of herbage.
Fertilization requires cash out- lays for material, transportation, equipment use, and labor. Costs range upward from a minimum of approximately five dollars per acre. Furthermore chemical fer- tilization to be effective requires good moisture conditions.
Plath (1931) reported reseed- ing costs of 4 to 15 dollars per acre for eastern Oregon ranges. The need and methods used for removal of competing vegetation was the largest variable factor in costs. Bleak and Plummer (1954) stated that reseeded ranges in the intermountain region repre- sent an outlay’ of 5 to 12 dollars per acre. Two to four years of protection for stand establish- ment was required in addition to the initial outlay. Pingrey and D o r t i g n a c (1957) found that seeding depleted rangelands in northern New Mexico cost 6 to 9 dollars per acre and that seeding croplands cost 7 to 8 dollars per acre. Sitler (1958) estimated the cost of seeding cropland to crested wheatgrass (Agropyron desertorum) in eastern Colorado to be $10.50 per acre, after a credit of $7.00 per acre for the
first-year sorghum allowed. This cost elude any failure costs.
crop was did not in- or fencing
Reseeding trials on stabilized abandoned croplands at Central Plains Experimental Range, and on nearby ranches and Land- Utilization-Project lands, under a 12-inch average annual precipi- tation, show a wide range of costs per acre of satisfactorily seeded stands. Failures and near failures have been frequent. A few satisfactory stands have been obtained at costs of less than 10 dollars per acre, while others have cost more than 50 dollars per acre, the cost depend- ing on the number of failures. Deteriorated native ranges can- not be reseeded any cheaper than abandoned plowed lands.
There are, no doubt, conditions on western rangelands, under which each of these alternate range-improvement practices is appropriate. All require substan- tial cash costs. These cash costs must be liquidated by pet profits from increased yields before any financial benefits accrue to prof- its from the application of the improvement practice. Careful consideration of cash costs and probable net profits are required in the selection of the practice to apply.
Discussion
62
units can be gradually returned to moderate utilization of the herbage as the density and vigor of the desirable forage plants ap- proximate the site capacity.
The cost of applying light grazing for range improvement on deteriorated native ranges is low compared with the costs of other range-improvement pro- cedures. This is especially true for the rangeland operator who harvests his forage crops with livestock that he owns. Light grazing can be applied to exist- ing grazing units without addi- tional fencing costs and with some reduction in other grazing costs. Income from the forage is received each year to meet fixed charges on the grazing unit. Additional capital outlay is not required. Alternate meth- ods for range improvement sel- dom are accompanied by these advantages during the early years of their application. Light grazing is an effective and eco- nomical procedure for the im- provement of deteriorated native ranges.
Light grazing alone is not ef- fective on ranges if competing undesirable species control the site. Also, there are millions of acres of western rangelands so depleted of desirable forage spe- cies that reseeding will be re- quired for their rehabilitation. A combination of light grazing and selective chemical-control meth- ods for undesirable plants, how- ever, should be given considera- tion before mechanical control and reseeding are used for areas where fair stands of desirable forage species are still present,
KLIPPLE AND BEMENT
but suppressed by the competi- tion.
Summary
Light grazing has been used only infrequently by rangeland managers as a range-improve- ment practice. Their reasons for not doing so arise from doubt on their part as to its economic feas- ibility and its effectiveness. Re- sults from a number of con- trolled grazing-intensity studies reported over the past 20 years are analyzed in relation to the validity of these doubts.
Light grazing for a few years does increase the herbage-yield- ing ability of deteriorated native ranges. The cost of applying light grazing is low in compari- son with costs of other methods often used for range improve- ment. The logical time to use light grazing for range improve- ment is before the range has be- come depleted. Light grazing cannot do the job alone when competing undesirable v e ge t a- tion dominates the site. Results of grazing-intensity studies dem- onstrate that light grazing is eco- nomically feasible when results are expressed in dollars received for the forage per acre of range- land.
LITERATURE CITED
BLEAK, A. L. AND A. PERRY PLTJMMER. 1954. Grazing crested wheatgrass by sheep. Jour. Range Mangt. 7: 63-68.
CATON, DOUGLAS D., CHESTER 0. Mc- CORKLE, AND M. L. UPCHURCH. 1960. Economics of improvement of western grazing land. Jour. Range Mangt. 13: 143-151.
COSTELLO, DAVID F. 1942. Maintain-
ing short-grass ranges. Colorado Ext. Bul. D-33, 11 pp.
COTTON, J. S. 1905. Range Manage- ment in the state of Washington. Bur. Pt. Ind. Bul. 75, 28 pp.
JARDINE, J. T. AND N. ANDERSON. 1919. Range Management on the national forests. U. S. Dept. Agr. Bul. 790. 119 pp.
JOHNSON, LESLIE E., LESLIE A. ALBEE, R. 0. SMITH, AND ALVIN L. MOXON.
1951. Cows, calves and grass. So. Dak. Agr. Exp. Sta Bul. 412. 39 pp. JOHNSON, W. M. 1953. Effects of grazing intensity upon vegetation and cattle gains on ponderosa pine-bunchgrass range of the front range of Colorado. U. S. Dept. Agr. Circ. 929. 36 pp.
KLIPPLE, G. E. AND DAVID F. Cos- TELLO. 1960. Vegetation and cattle responses to different intensities of grazing on short-grass ranges of the Central Great Plains. U. S. Dept. Agr. Tech. Bul. 1216. 82 pp. LAUNCHBAUGH, J. L. 1957. The effect of stocking rate on cattle gains and on native shortgrass vegetation in west-central Kansas. Kans. Agri. Exp. Sta. Bul 394. 29 pp.
PINGERY, H. C. AND E. J. DORTIGNAC. 1957. Cost of seeding Northern New Mexico rangelands. New Mexico Agr. Exp. Sta. Bul. 413. 43 PP.
PLATH, C. V. 1951. Cost guides for range reseeding. Ore. Agr. Exp. Sta. Circ. of Inf. 497. 14 pp. SAMPSON, ARTHUR W. 1914. Natural
revegetation of rangelands based on growth requirements and life history of the vegetation. Jour. Agr. Res. 3:93-148.
SITLER, HARRY G. 1958. Economic possibilities of seeding wheatland to grass in eastern Colorado. U. S. Dept. Agr., Agr. Res. Ser., ARS 43-64. 33 pp. proc.
SMITH, J. G. 1895. Forage conditions of the prairie region. U. S. Dept. Agr. Yearbook. 309-324.
Ten Year Index for Executive Secretary for
INDEXES FOR SALE
An Application of the
Method to the Sampling
RALPH L. DIX”
Point-Centered Quarter
of Grassland Vegetation’
Biology Department, Marquette University, Milwaukee, Wisconsin
The point-centered quarter method, which belongs to a fam- ily of methods usually desig- nated as “distance measurement methods,” was developed by Cot- tam and Curtis (1956) for use in the sampling of tree and sapling compositions of woodlands in the northern Prairie-Forest Border Region. The method was first ap- plied to grassland studies by the author in western North Dakota during the summer of 1958 and it is presently in use in that area. This method offers a means of taking rapid, quantitative sam- ples of grassland vegetation which are free from subjective estimates and which yield data in terms of both species com- positions and species densities. Densities are in terms of aerial shoots per unit area; a shoot is defined as a stem plus its ap- pendages (Arber 1941; Foster 1949). The shoot has been se- lected as the organismal unit to avoid the necessity of distin- guishing individual plants in the field.
Three native grassland stands in western North Dakota were sampled in June and August of 1959 in order to evaluate the
1 This investigation was supported in part by funds made available by the National Science Foundation
(Grant No. G 5559).
2Present Address: Department of Plant Ecology. University of Sas- katchewan, Saskatoon, Saskatche- wan.
The author is indebted to Drs. Grant Cottam and W. C. Whitman for suggestions in the preparation of the manuscript.
characteristics and merits of the method when applied to grass- land vegetation and it is the pur- pose of this paper to report that study. The great diversity of grassland types suggests, how- ever, that the general applicabil- ity of the method should not be assumed until trials are made on a variety of other grassland types. This paper describes the method so that it may be tested by other workers on other grass- lands.
Distance measurement meth- ods are based upon the thesis that the measurement of the dis- tances between plants is a more efficient sampling tool in the field than area methods of direct density (plants or shoots per unit area) measurement. This would appear particularly true in grassland vegetation, where difficulty is often encountered in distinguishing individuals and where high densities often make the direct counting of individ- uals or shoots, even in small sample areas, impractical. Many distance measuring meth- ods have appeared since 1947 when Cottam introduced the random pairs method, the origi- nal member of this family. The works of Curtis (1950)) Skellam
(1952)) Cottam, Curtis and Hale (1953)) Clark and Evans (1954)) Hopkins (1954)) Moore (1954)) Morisita (1954), Cottam and Curtis (1956)) Greig-Smith
(1957) and Lindsay, Barton and Miles (1958) are of particular importance in tracing the devel- opment of this family of meth- ods.
The plant names used in this paper follow Stevens (1950).
63
Procedures
Field Procedure
All stands sampled in the pres- ent study were located in the South Unit of Theodore Roose- velt National Memorial Park, Billings County, North Dakota. The grassland vegetation of this area has been described by Han- son and Whitman (1938) and Dix (1958). The sampled stands had been ungrazed for at least 4 years and free from fire for 25 or more years.
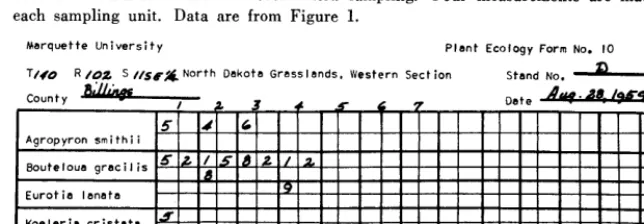
In applying the point-centered quarter method to grassland veg- etation, a technique developed by Evans and Love (1957) has been modified for use in locat- ing the central point of each sampling unit. A single pin (sur- veyor’s arrow) is placed verti- cally into the soil, guided by a small notch cut into the toe of the sampler’s boot. The area around the point is then divided into quarters by drawing two imaginary lines through the pin; one line is drawn parallel with the line of traverse while the second is drawn at right angles to the first (Figure 1). The es- tablishment of these lines is aided by filing four small marks on the pin in such a way that each mark is 90” from its near- est neighbor. Within each quar- ter of the sampling unit the clos- est living shoot to the point is recorded by species and the dis- tance from the point to the clos- est shoot is measured to the nearest centimeter. Thus, each sampling unit consists of four shoots and four measured dis- tances. The recording of field data is greatly facilitated by em- ploying a previously prepared data form (Figure 2).
64
.A.
.s
FICUHE 1. A hypothetical map of a grass- land area illustrating the application of the method. The vertical dotted line indi- cates the line of traverse. The intersection of the four solid lines indicates the loca- tion of the point of the sampling unit. The area around the point was divided into four 90” quarters by drawing a line (dot- ted horizontal line) at right angles to the line of traverse. The solid lines indicate measured distances from points to shoots. Four sampling units are illustrated and the data is recorded in Figure 2. “A”= Agropyron smithii; “K” = Koeleria cris- tata; “E” = Eurotia lanata; “S” = Stipa viridula; solid black = Bouteloua gracilis.
Under this regime, a single woody plant may occasionally be measured two or more times when it appears in more than one quarter of a sampling unit. When a woody shoot overtops herbaceous shoots, only the for- mer is measured. When a shoot
DIX
touches the pin, a distance of zero is recorded.
The positions of the points in the field are determined objec- tively by pacing a predeter- mined number of steps along a compass line and placing the pin into the soil in the manner des- cribed above. The number of points required to adequately sample the vegetation is dis- cussed below.
All sampling in the present study was done by a two-man team-a sampler and a recorder. While this method may be eas- ily applied by an individual, a two-man team appears more ef- ficient since the time required to record distances usually limits the speed of the method.
Laboratory Calculations The homogeneity of each stand was tested by employing the method suggested by Curtis and McIntosh (1951). The number of shoots of the major species in each stand was segregated into four groups in which each segre- gate represented an approxi- mately equal area1 portion of the stand. Using the number of shoots contained in each of the four segregate groups, a Chi- square test for homogeneity
(Snedecor 1956) was applied. All Chi-square values for the stands used in this study were found to be within the expected 5 percent level and all stands were accepted as homogenous.
Cottam, Curtis and Hale (1953) have shown that, when the point-centered quarter
method is applied, the mean dis- tance between points and shoots is equal to the square root of the mean area, if individual species are disregarded. The mean dis- tance between shoots is found by summing the individual measured distances and dividing the sum by four times the num- ber of points used. Further, the mean distance squared is equal to the mean area while density is equal to the reciprocal of the mean area, or, to put density in terms of shoots per square meter, 10,000 (the number of sq. ems. in 1 sq. m.) over the mean dis- tance squared.
Table 1 may be used to demon- strate these calculations (p. 65).
In order to find the absolute densities for the individual spe- cies of the stand, the total den- sity is multiplied by the relative densities of the individual spe- cies. Again, from Table 1, the absolute density for blue grama (Bouteloua gracilis) is calculated to be 295.85 shoots per square meter (0.565 x 523.64).
The adequacy of the sampling was judged by employing the suggestion of Cottam and his colleagues (Cottam, et. al. 1953 and Cottam and Curtis 1956) that approximately 30 individu- als of a particular species must be encountered in the total sam- ple before reasonable accuracy is obtained for that species.
An importance value which is independent of distance meas- urements may also be obtained from data collected with this method. Relative frequencies and
FIGURE 2. Data form used to record field sampling. Four measurements are made in each sampling unit. Data are from Figure 1.
Marquette University Plant Ecology Form No. IO
POINT CENTERED QUARTER METHOD 65
dt + d- + d:< ____________________ dn 874
Mean Distance = - _ - = 4.37 ems.
4 x number of points used 4 x 50
Mean Area = mean distance’ = (4.37) ’ = 19.1 sq. ems. per shoot Total Density = l/19.1
or, to put the density in terms of shoots per square meter, 10,000
Total Density = ____ = 523.64 shoots per square meter. 19.1
densities may be calculated from the number of points of occur- rence (each point is considered a quadrat) and the number of shoots, respectively. The two relative values for each species are then added to give an im- portance value (Table 1) . While importance values calculated in this way may be of limited value in some grassland work, they may be highly desirable in cer- tain studies-e.g., in Savannah vegetation when it is desired to make use of some method which will permit direct comparisons between tree, shrub and herba- ceous synusia. When the point- centered quarter method is ap- plied to woodland vegetation, it is customary (Cottam and Cur- tis 1956) to calculate an impor- tance value which is the sum of the relative frequency, density and dominance values for each species. The importance values for trees will sum to 300 percent (relative frequency + relative density + relative dominance)
while the importance values for herb, shrub and sapling meas- urements will sum to 200 percent
(relative frequency -+ relative density). Whitford and Salamun (1954) have suggested that sap- ling data may be made directly comparable to tree data by mul- tiplying the importance value of each sapling species by 1.5 to bring the sum to the same 300 percent as the importance value for trees. The same method would appear applicable to herb and shrub data.
Resulfs
Stand A was first sampled on June 29 by employing 50 sam- pling units and the results of that sampling are given in Table 1. Of the nine species detected, only two proved adequately sam- pled. Further, it appeared that while a prohibitive number of sampling units would be re- quired to adequately sample the third ranked species, winter fat
(Eurotia kmata), it suggested
that an adequate sample of the first and second ranked species might be obtained with fewer sampling units. A second sam- pling of the stand was therefore made (Table 2) by employing 25 units distributed over the same total area and this gave an ade- quate sample for blue grama but not for western wheatgrass (Ag-
ropyron smithii). A third sam-
pling of 25 units was made in the stand and again only blue grama proved to be adequately sam- pled. It was concluded from this study that 25 sampling units gave an adequate sample for the first ranked species in this grass- land type; that approximately 30-35 sampling units were re- quired to adequately determine the density of the recond ranked species; and that a very large number of sampling units would be required to adequately sam- ple the lesser ranked species.
In order to evaluate the influ- ence of seasonal differences upon data obtained with the point- centered quarter method, Stand A was sampled again on August 28, approximately two months after the first sampling, and the results are given in Table 3. Comparisons between Tables 1 and 3 show a striking similarity in the values for the first and second ranked species. The in- adequately sampled lesser spe- cies show large variations which are probably attributable to
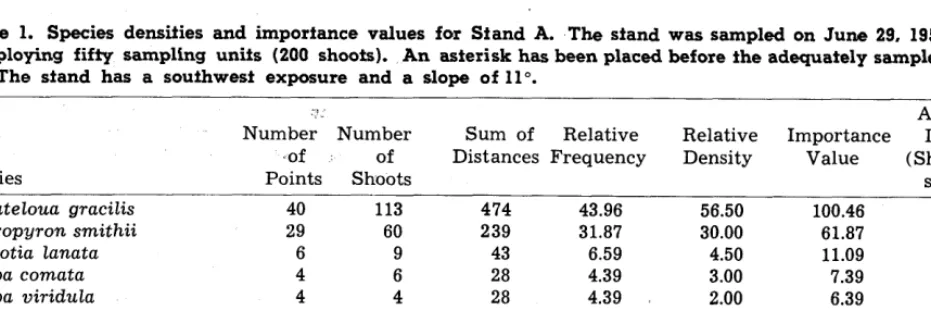
Table 1. Species densities and importance values for Stand A. The stand was sampled on June 29, 1959 by em-
ploying fifty sampling units (200 shoots). An asterisk has been placed before the adequately sampled species. The stand has a southwest exposure and a slope of Ilo.
Species
: 7 Absolute
Number Number Sum of Relative Relative Importance Density -of of Dist antes Frequency Density Value (Shoots per
Points Shoots sq. M.)
* Bouteloua gracilis 40 113 474 43.96 56.50 100.46 295.85
* Agropyron smithii 29 60 239 31.87 30.00 61.87 157.09
Eurotia lanata 6 9 43 6.59 4.50 11.09 23.56
Stipa comata 4 6 28 4.39 3.00 7.39 15.70
Stipa viridula 4 4 28 4.39 / 2.00 6.39 10.47
Sphaeralcea coccinea 4 4 36 4.39 2.00 6.39 10.47
Art emisia frigida 2 2 12 2.19 1.00 3.19 5.23
Muhlenbergia cuspidata 1 1 10 1.09 0.50 1.59 2.62
Erysimum parviflorum 1 1 4 1.09 0.50 1.59 2.62
66
DIX
Table 2. Species densifies and imporfance values for Sfand A on June 29, 1959 employing 25 sampling unifs. An asferisk has been placed before fhe adequafely sampled species.
Species
Absolute Number of Number of Importance Density Points Shoots Value (shoots per sq. M.)
* Bouteloua gracilis 21 59 104.28 323.67
Agropyron smithii 14 25 55.04 137.15
Eurotia lanata 4 6 14.57 32.92
Four other species 8 10 26.11 54.87
TOTAL 47 100 200.00 548.6 1
large sampling errors,
rather
than to differences in seasonal
variations.
Time trials in Stand A showed
the rate of sampling with the
point-centered quarter method
to be a consistent 50 sampling
units per hour in this vegetation
type.
For comparative purposes, stu-
sampling units. The very high
density of this species, the low
densities of the remaining spe-
cies, and the small amount of
mulch present, permitted sam-
pling to occur at the compara-
tively rapid rate of 67 sampling
units per hour.
The third site had a north-
northeast exposure and a slope
Table 3. Species densifies and imporfance values for Wand A on Augusf 29, 1959. Fiffy sampling units were employed in obfaining the sample. An asferisk has ben placed before fhe adequafely sampled species.
Species
Absolute Number of Number of Importance Density
Points Shoots Value (shoots
per sa. M.)
* Bouteloua gracilis 43 116 105.20 322.23
*Agropyron smithii 27 53 56.10 147.22
Stipa viridula 7 13 14.20 36.11
Eurotia lanata 5 6 8.50 16.67
Stipa comata 4 7 7.90 19.45
Five other species 5 5 8.00 13.90
TOTAL 91 200 199.90 555.58
dies were made on two addi-
tional grassland stands in west-
ern North Dakota. One stand
(B) was located contiguously
with Stand A but, due to its di-
rect southern exposure,
was
more xeric than the original
stand. When 50 sampling units
were used to sample Stand B,
blue grama was found (Table 4)
to have a density which was 42
percent higher than the density
for the same species in Stand A
while the total density for all
species was 28 percent higher in
the more xeric stand. Blue grama
accounted for 76 percent of the
vegetation in Stand A. In Stand
B, blue grama was the only spe-
cies adequately sampled with 50
of 18”. This stand (C) was less
xeric than either of the other
stands; it supported a greater
number of species and had a
thick mulch cover. When 50
sampling units were employed
on the stand only little bluestem
(Andropogon scoparius)
proved
to be adequately sampled. Fifty
additional sampling units were
distributed over the area and the
results pooled with the original
to form a single sample of 100
units (Table 4). This table shows
that a total of 32 species were
detected in the sampling and
that, of these, six were species
adequately sampled. The com-
paratively slow sampling rate of
37 units per hour ih this stand
was due to the necessity of re-
moving large quantities of mulch
before the exact locations of the
emergence of the shoots from
the soil could be determined. The
total density of plants in this
stand was approximately mid-
way between the total densities
for Stand A and B.
Some differences that may be
encountered in various grass-
land types within the same gen-
eral area are shown by compari-
sons between the three stands.
Stand B occurred on the most
xeric site of the study and this
condition was reflected in the
very high density for a single
species, blue grama, the low den-
sities of all other species and the
small amount of mulch on the
grassland floor. The least xeric
site was Stand C which showed
a high total number of species,
a comparatively large number of
important species (6)) the ab-
sence of a single species with a
density far higher than that for
the other species, and a thick
Table 4. Species densifies and imperfance -values for Stand B. Fifty sampling unifs were used in sampling fhe stand. An asferiak has been placed before fhe adequately sampled species. The sfand has southern exposure and a slope of 14”.
Species
* Bouteloua gracilis Eurotia lanata Agropyron smithii Plantago purshii Six other species
TOTAL
Absolute Number of Number of Importance Density Points Shoots Value (shoots per sq. M.)
47 152 137.84 513.51
13 29 31.60 97.97
6 8 11.89 27.03
4 5 7.76 16.89
6 6 10.86 20.28
POINT CENTERED QUARTER METHOD
67
Table 5. Species densities and importance valus for Stand C. The stand was sampled by employing 100 sampling units. An asterisk has been placed before ihe adequately sampled species. The stand has a north norfheasi exposure and a slope of 18’.
Absolute Number of Number of Importance Density
Species Points Shoots Value (shoots
per sq. M.) __
* Andropogon scopurius 41 89 39.69 132.88
* Bouteloua curtipenduza 38 58 30.60 86.58
*Stipa viridula 30 46 24.22 68.66
*Bouteloua gracilis 21 43 19.67 64.16
*Carex jilijolia 22 31 17.34 46.24
*Muhlengergia cuspidata 19 35 16.81 53.22
Juniperus horizontalis 7 22 8.24 31.34
Stipa comata 7 9 4.96 11.95
Cares eleocharis 7 7 4.71 10.47
Calamovilja longijolia 4 8 3.70 11.95
Twenty-two other species 42 52 30.27 74.71
TOTAL 238 400 200.21 591.09
mulch mat. While Stand A was
intermediate between the other
two stands and showed inter-
mediate characteristics, it was
more closely related to Stand B
than to Stand C.
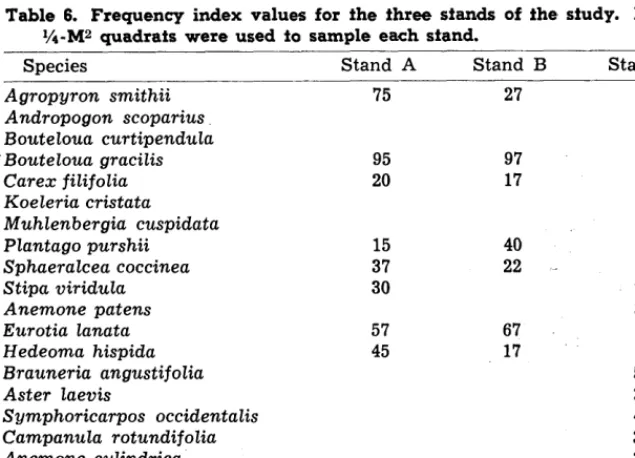
F r e q u e n c y determinations
were also made on the three
stands of the study by employ-
ing 40 l-M2 quadrats distributed
throughout each stand. The re-
sults for all species which had a
frequency index value of 30 per-
cent or more in any stand are
given in Table 6. Comparisons
between this table and Tables
1, 2, 3, 4, and 5 show a general
agreement in the relative impor-
tance of most species when sam-
pled with the two methods. The
point-centered quarter method
would appear, however, to be
more sensitive in distinguishing
between the relative importance
of species with near equal ranks.
For example, while the frequen-
cy index values for blue grama
shows the species to be nearly
as important in Stand A as in
S t a n d B, the point-centered
quarter method shows a 58 per-
cent higher density for the
species in Stand B. Again, in
Stand C little bluestem and side-
oats grama (Bouteloua curtipen-
dula) had the same frequency
values, but when the point-
centered quarter method was
used to sample the stand, the
former species had a density 65
percent greater than the latter
species. Frequency index deter-
minations made from area quad-
rats, however, appear to yield a
broad though general picture of
the species composition spectrum
and for this reason such deter-
minations are highly valuable in
establishing g r o s s similarities
and differences between stands.
Discussion
While the point-centered quar-
ter method is not historically a
descendant of the point quadrat
method, it nevertheless appears
to be a logical extension of that
method when, as in the present
study, it is applied to the sam-
pling of grassland vegetation.
The point quadrat method was
introduced by the Australian
ecologists Levy and Madden
(1933) and has as its theoretical
basis the principle that when the
sample area becomes a point, the
proportion of an infinitely large
total number of sampling areas
which are covered equals the
cover of the species (Greig-
Smith 1957). The point quadrat
method has been widely applied
in the sampling of grassland
vegetation throughout the world
and Brown (1954) suggests that
the method has every prospect
of becoming the accepted one in
both survey and detailed an-
alyses of grassland vegetation.
Of the several variations of the
point quadrat method which are
now in use, the most widely ap-
plied appears to be the point-
frame method in which 10 pins,
spaced 2 inches
apart, are
arranged in a frame in such a
way that they can be lowered
into the vegetation and the con-
tacts between the pins and shoots
recorded.
Goodall
(1952), in an ex-
haustive study of several varia-
Table 8. Frequency index values for ihe three stands of the study. Foriy l/4 -M2 quadrats were used fo sample each stand.
Species Stand A Stand B Stand C
Agropyron smithii 75 27 10
Andropogon scoparius 85
Bouteloua curtipendula 85
Bouteloua gracilis 95 97 35
Carex jilijolia 20 17 55
Koeleria cristata 30
Muhlenbergia cuspidata 47
Plantago purshii 15 40
Sphaeralcea coccinea 37 22 - 10
Stipa viridula 30 70
Anemone patens 32
Eurotia lanata 57 67
Hedeoma hispida 45 17
Brauneria angustijolia 57
Aster laevis 37
Symphoricarpos occidentalis 40
Campanula rotundijolia 35
Anemone c y lindrica 30
Linum lewisii 40