ABSTRACT
PRICE, KRISTIN MICHELLE. Microstructure and Functionality of Processed Cheese: The Role of Milk Fat. (Under the direction of Christopher R. Daubert.)
Cooling, the final stage in processed cheese manufacturing, plays a significant role in determining the texture and firmness of the final product. To interpret cooling mechanisms of processed cheese, model processed cheese analogues were formulated including rennet casein powder, anhydrous milk fat, and emulsifying salts. Small amplitude oscillatory shear (SAOS) and large deformation compression tests analyzed rheological properties and trends exhibited in processed cheese analogues when cooled with different cooling schedules. Two cooling rates, 0.5 o
C/min and 0.05 oC/min, were selected, and based on protein network formation and fat
crystallization, two significant cooling phases were identified: 80-40oC and 40-5oC. In all, four cooling schedules were developed from a two-by-two matrix of cooling rates and cooling phases. After the cheese analogues were cooled with the desired cooling schedules, SAOS rheology measured the complex shear modulus (G*) of cheese analogues through a frequency sweep range of 0.01-10 Hz. Utilizing the same cooling schedules, the normal, compressive strength of cheese analogue cylinders was measured and converted into shear modulus (G) values. Rheological analysis revealed that a slower cooling rate through the first phase of cooling (80-40oC) created a firmer cheese product (larger G* and G values) when compared with a faster rate of cooling through the same temperature range. The cooling rate through the second phase of cooling, during fat crystallization, did not impact final cheese storage modulus. Small and large deformation rheological analyses found that the final cheese texture was governed by the cooling rate through the first phase of cooling (80o-40oC), during the formation of the protein network.
the protein ring surrounding fat droplets in processed cheese analogues lays the framework for future study on the effects of very slow cooling rates on the thickness of the protein ring.
Microstructure and Functionality of Processed Cheese: The Role of Milk Fat
by
Kristin Michelle Price
A thesis submitted to the Graduate Faculty of North Carolina State University
in partial fulfillment of the requirements for the degree of
Master of Science
Food Science
Raleigh, North Carolina 2007
Approved By:
Christopher R. Daubert, Ph.D. Orlin D. Velev, Ph.D. Chair of Advisory Committee
BIOGRAPHY
Kristin Price was born on November 25, 1981 in Pittsburgh, Pennsylvania as one of four
children to Donna and Jim Price. She was raised in Harrison City, Pennsylvania and graduated from
Penn Trafford High School in May of 2000. In the fall of 2000, Kristin attended Virginia Tech.
University for one year to continue her studies and compete in Division I cross country/track and field.
Upon transferring to North Carolina State University in the fall of 2001, Kristin spent three years
studying Food Science and running on the nationally ranked cross country/track and field team. In
May of 2004, Kristin obtained her B.S. in Food Science.
After graduation, Kristin continued her professional running career by competing in the 2004
Olympic Trials at 10,000m and eventually moving up to the marathon distance. Realizing the value of
a master’s degree, Kristin returned to North Carolina State University in 2005 to pursue an M.S. in
Food Science. For the next two years, Kristin worked under the guidance and tutelage of Dr.
ACKNOWLEDGEMENTS
- To Dr. Daubert, the BEST advisor in the world! I can’t thank you enough for the patience you had all those times I came into your office confused and frustrated with my research. I value all the
advice and guidance you have provided me in the past two years. I am so grateful to have had an
advisor who cares so deeply for his students – not only in their research, but in their personal lives
as well. I appreciated your understanding of my love and passion for running, and the support you
provided in all of my races. You motivate me to do the best that I can in everything I do. Thank
you.
- To Mom and Dad – thank you for your unfailing love, support, and encouragement you have
provided over the years. The older I get the more I understand and appreciate all of the sacrifices
you both have made over the years while raising four kids…“thank you” just isn’t enough! I love
you both so much.
- To Kara, Erin, and Mark - my twin sister, older sister, and older brother. I can’t tell you how much I
admire the hard work and determination you each show in everything you do. I’m so proud to say
I’m your sister and I love you guys! Thank you for your ongoing support, and I guess there’s only
one thing left to do… have a “CELEBRATION”!
- To Sharon Ramsey – the person who keeps the Rheology lab running smoothly! Thank you so
much for all the help you have provided. Your cheerful and pleasant personality radiates
throughout the lab and put a smile on my face everyday… even those times I was so frustrated
and threatened to toss the Bohlin rheometer out the window! Thank you for all the time and
- To Dr. Velev, an advisor on my graduate committee. Thank you for welcoming me into the
chemical engineering lab and assisting me on the confocal microscope! I enjoyed getting to know
you and valued the time you spent helping me with my research!
- To Dr. Farkas, an advisor on my graduate committee and former teacher. I enjoyed having you as
a teacher in Food Engineering when I was an undergraduate so much that I wanted to continue
learning about heat transfer in my research! Thank you for all the help and advise you have
provided me with over the years. (Also for all those fun Tour de France chats!)
- To Dr. Hartel and Roja Ergun – coworkers from University of Wisconsin-Madison. You both helped
me out so much with getting materials, microscopy and DSC studies, and overall cheese/milk fat
knowledge! It was great meeting and working with you both and I can’t thank you enough for the
countless emails back and forth!
TABLE OF CONTENTS
LIST OF TABLES... ix
LIST OF FIGURES... x
LITERATURE REVIEW... 1
1.1 Introduction... 2
1.2 Natural Cheese Making ... 3
1.2.1 Acidification ... 3
1.2.2 Coagulation ... 3
1.2.3 Post-Coagulation Changes ... 4
1.2.4 Salting...4
1.2.5 Ripening ... 5
1.3 Casein... 5
1.3.1 Casein Micelle Structure ... 6
1.3.2 Coagulation of Casein Micelles ... 7
1.4 Processed Cheese Making... 8
1.4.1 Selection and Shredding of Natural Cheeses ... 8
1.4.2 Emulsifying Salts ... 9
1.4.3 Thermal Processing and Homogenization ... 9
1.4.4 Packaging, Cooling, and Storing ... 10
1.5 Previous Research on Processed Cheese... 10
1.6 Milk Fat and the Milk Fat Globule Membrane... 13
1.6.1 Homogenization of Casein and Milk Fat... 14
1.7 Emulsifying Salts ... 16
1.8.1 Casein Content... 17
1.8.2 Fat Globule Size and Distribution... 17
1.8.3 Moisture... 17
1.8.4 Selection of Emulsifying Salts ... 17
1.9 Cheese Rheology ... 18
1.9.1 Empirical Tests ... 20
1.9.2 Large Deformation Tests... 20
1.9.3 Small Deformation Tests ... 23
1.9.4 Relating SAOS and Compression ... 26
1.10 Microscopy ... 27
1.11 Scope of Work ... 28
1.12 References ... 29
SMALL DEFORMATION RHEOLOGY OF BULK MILK FAT AND PROCESSED CHEESE ANALOGUES... 34
2.1 Introduction... 35
2.2 Material and Methods ... 38
2.2.1 Materials and Equipment... 38
2.2.2 Protein Gel Preparation... 39
2.2.3 Anhydrous Milk Fat (AMF) Preparation ... 40
2.2.4 Preparation of Fat and Protein Emulsions ... 40
2.2.5 Rheological Measurements of Bulk Milk Fat ... 42
2.2.6 Rheological Measurements of Protein Gels and Cheese Analogues ... 43
2.3 Results and Discussion ...44
2.3.1 Small Amplitude Oscillatory Shear Data of Bulk Milk Fat... 44
2.3.3 Small Amplitude Oscillatory Shear Data of Cheese Analogues and Protein
Gels ... 48
2.4 Conclusions ... 51
2.5 Acknowledgements ...53
2.6 References ... 53
LARGE DEFORMATION RHEOLOGY OF BULK MILK FAT AND PROCESSED CHEESE ANALOGUES... 55
3.1 Introduction... 56
3.2 Material and Methods ... 60
3.2.1 Materials and Equipment... 60
3.2.2 Preparation of Milk Fat Cylinders for Compression Testing... 61
3.2.3 Preparation of Cheese Analogue Cylinders for Compression Testing... 65
3.3 Results and Discussion ...68
3.3.1 Compression Data of Bulk AMF ... 68
3.3.2 Compression Data of Cheese Analogues ... 72
3.4 Conclusions ... 74
3.5 References ... 75
MICROSCOPY OF BULK MILK FAT AND PROCESSED CHEESE ANALOGUES... 77
4.1 Introduction... 78
4.2 Material and Methods ... 80
4.2.1 Materials and Equipment... 80
4.2.2 Microscope Sample Preparation ... 80
4.3 Results and Discussion ...82
4.3.2 Effects of Cooling Rate on Protein-Fat Microstructure... 84
4.4 Conclusions ... 86
LIST OF TABLES
SMALL DEFORMATION RHEOLOGY OF BULK MILK FAT AND PROCESSED CHEESE ANALOGUES
Table 2.1: Formulation for 18% Rennet Casein Gels ... 40
Table 2.2: Percent by Weight of Ingredients with Varying Protein to Fat Ratios... 41
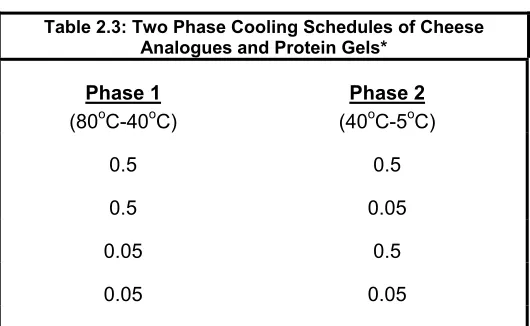
Table 2.3: Two Phase Cooling Schedules of Cheese Analogues and Protein Gels ... 44
Table 2.4: Complex Shear Modulus (G*) for Milk Fat Cooled at Different Rates with SAOS... 45
LARGE DEFORMATION RHEOLOGY OF BULK MILK FAT AND PROCESSED CHEESE ANALOGUES Table 3.1: Percent by Weight of Ingredients with Varying Protein to Fat Ratios... 65
Table 3.2: Two Phase Cooling Schedules of Cheese Analogues and Protein Gels ... 67
Table 3.3: Compression of Bulk Milk Fat Cooled at Different Cooling Rates ... 69
Table 3.4: Shear Modulus (G) for Milk Fat Cooled at Different Rates with Compression ... 70
Table 3.5: Compression of Cheese Cooled with Two Phase Cooling ... 73
LIST OF FIGURES
LITERATURE REVIEW
Fig. 1.1: Schematic of cheese... 3
Fig. 1.2: Renneting process of casein micelles ... 4
Fig. 1.3: Schematic of the casein micelle and casein submicelle... 6
Fig. 1.4: Action of emulsifying salts... 9
Fig. 1.5: Formation of rennet casein gels ... 11
Fig. 1.6: Fractal dimension and flock size effects on a gel structure ... 12
Fig. 1.7: Homogenization of milk fat and casein in the presence of emulsifying salts... 15
Fig. 1.8: Applied stress may be tensile, compressive, or shear ... 19
Fig. 1.9: Application of a compressive stress ... 22
Fig. 1.10: Strain input and stress response for Hookean solids and Newtonian fluids... 25
Fig. 1.11: Compressive force of a material that fails in compression or fails in shear... 26
SMALL DEFORMATION RHEOLOGY OF BULK MILK FAT AND PROCESSED CHEESE ANALOGUES Fig. 2.1: Stephan UMC-5E emulsifying mixer and water bath system ... 39
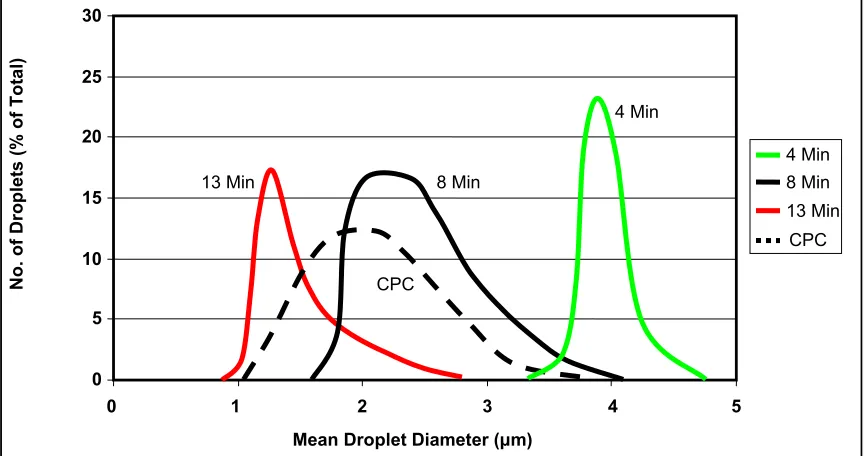
Fig. 2.2: Fat globule size distribution of emulsions shear for 4, 8, and 13 minutes at 1500rpm compared to commercially processed cheese... 42
Fig. 2.3: Shear rheology of bulk milk fat cooled at different rates... 45
Fig. 2.4: Time study of milk fat cooled at different rates ... 47
Fig. 2.6: Frequency sweep of cheese analogues (protein to fat ratios of 1:1.35 and 1:0.7) cooled
using two phase cooling schedules... 49
Fig. 2.7: Frequency sweep of cheese analogues (protein to fat ratio of 1:2) cooled using two phase cooling schedules... 50
Fig. 2.8: Frequency sweep of 18% protein gels cooled using two phase cooling schedules... 51
LARGE DEFORMATION RHEOLOGY OF BULK MILK FAT AND PROCESSED CHEESE ANALOGUES Fig. 3.1: Stephan UMC-5E emulsifying mixer and water bath system ... 60
Fig. 3.2: Diagram of how milk fat cylinders were created with Styrofoam insulation for use in compression ... 62
Fig. 3.3: Fat globule size distribution of emulsions shear for 4, 8, and 13 minutes at 1500rpm compared to the commercially processed cheese... 66
Fig. 3.4: Compression of bulk milk rat at different cooling rates... 69
Fig. 3.5: Linear viscoelastic regime of bulk milk fat cooled at different rates under compression... 70
Fig. 3.6: Shear rheology of bulk milk fat cooled at different rates... 71
Fig. 3.7: Compression of cheese analogues after two phase cooling ... 72
Fig. 3.8: Formation of protein gels ... 74
MICROSCOPY OF BULK MILK FAT AND PROCESSED CHEESE ANALOGUES Fig. 4.1: Polarized light microscopy of crystalline fat within a fat and protein emulsion ... 82
Fig. 4.2: Confocal laser scanning micrographs of a fat and protein emulsion cooled from 80-5oC... 83
LITERATURE REVIEW
Kristin M. Price
Department of Food Science
1.1 Introduction
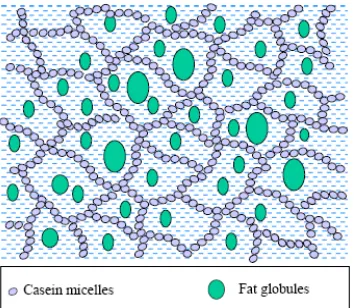
Milk is the starting ingredient and basis for natural cheese production. In defining terms, milk
is a dispersion of milk fat globules and proteins dispersed in a continuous phase of water, lactose,
and minerals (Hill, 2006). For cheese-making, the protein in milk is the most important constituent
(Fox et al., 2000). Of the total milk proteins, 80% is casein (αs1-, αs2-, β-, and κ-caseins), while the remaining 20% is whey protein (β-lactoglobulin, α-lactalbumin, immunoglobulins, and bovine serum
albumin) (Fox et al., 2000). During cheese production, the whey proteins are removed during a
dehydration step, and the fat and casein are concentrated six to twelve times, depending on the
cheese variety (Holsinger et al., 1995; Lucey and Fox, 1993; Fox et al., 2000; Swaisgood, 1996).
Acidification or enzymatic hydrolysis coagulates the concentrated casein to form a continuous protein
network. Milk fat, existing as globules (0.1-20 μm in diameter), is encapsulated and held within the
protein network (Fox et al., 2000). Cooling, the final stage in processed cheese production, is a
critical step in which the microstructure of the protein and fat matrix are established, ultimately
impacting final cheese texture (Fox et al., 2000). Therefore, this research investigated the potential
for industry to control final cheese texture, specifically processed cheese texture, through the
manipulation of cooling schedules during production.
Previous research by Zhong (2003) unveiled the effects of cooling rate on the functionality
and microstructure of a protein network, similar to what is present in processed cheese. The addition
of milk fat to the protein matrix was investigated in this research to reveal the effects of cooling rate
on the functionality and microstructure of processed cheese. The following sections discuss natural
and processed cheese making, casein micelle and milk fat globule membrane structures and
functions, the homogenization process of casein and milk fat, and a review of prior protein research
by Zhong (2003). Factors that affect the textural and functional properties of processed cheese are
also addressed, along with the rheological methods and microscopy techniques utilized in cheese
1.2 Natural Cheese Making
The manufacturing of natural cheese follows five basic steps: acidification, coagulation,
dehydration (cutting, cooking, stirring, pressing, shaping, molding, pressing), salting, and ripening.
The amount of moisture retained is regulated by milk composition and the combination and extent of
the five steps in cheese manufacturing (Holsinger et al. 1995; Zhong, 2003).
1.2.1 Acidification. A starter culture of lactic acid bacteria (LAB) is intentionally added to milk to
hydrolyze lactose into lactic acid. The acid formation drops milk pH (6.6) by 0.1-0.2 pH units, which is
essential for cheese flavor, texture, and safety (Fox et al., 2000). In addition, acidification is critical
for coagulation activity and curd formation, syneresis properties of the curd to control moisture
content, and the prevention of pathogen and spoilage bacteria growth (Zhong, 2003; Holsinger et al.,
1995; Fox et al., 2000; Hill, 2006).
1.2.2 Coagulation. Coagulation can be achieved through enzymatic coagulation or renneting, direct
acidification to the isoelectric point of casein (pH 4.6), or acidification to pH 5.2 with the addition of
heat (detailed in section 1.3). Coagulation of the casein micelles forms a three-dimensional gel
network known as the curd. The protein serves as the continuous phase, entrapping moisture and fat
globules to create a multicomponent gel (Fig. 1.1).
Fig. 1.1: Schematic of cheese
Gel formation is greatly influenced by pH, calcium concentration, protein content, and
temperature (Lomholt and Qvist, 1999; Lucey, 2002). Most natural cheese types are made via the
renneting process, which include three stages (Fig. 1.2): (1) cleavage of the glycomacropeptide
(GMP) via the chymosin enzyme (detailed in section 1.3), (2) aggregation of casein micelles, and (3)
development of the gel network (Zhong, 2003; Fox et al., 2000; Lucey et al., 2003; Hill, 2006).
Fig. 1.2: Renneting process of casein micelles
1.2.3 Post-Coagulation Changes (dehydration). Post-coagulation changes include cutting the curd into smaller pieces to expel moisture and whey from the protein network, ultimately having great
effects on final cheese quality, texture, and yield. While milk selection, coagulant, and type of starter
culture are significant factors for making a specific cheese type, differentiation among cheese
varieties begins with this step. When cut, rennet coagulated curd undergoes rapid synereses which
creates a low moisture cheese. It is imperative that the firmness of the coagulated curd be optimal
prior to cutting. Cutting a weak coagulant will shatter the protein matrix resulting in a loss of fat and
decreasing cheese yield. Cutting a curd that is too firm will break the protein network and casein will
be lost, thus affecting final cheese texture and yield (Hill, 2006; Fox et al., 2000; Zhong, 2003; Holsinger et al., 1995).
1.2.4 Salting. The addition of salt during cheese-making has a major influence on cheese quality.
Salts alter protein solubility and conformation, which ultimately has influence on final cheese texture.
In addition, salt plays a crucial role in controlling water activity, microbial growth, and enzyme activity; Casein Micelles
Chymosin enzyme cleaves GMP’s
Aggregation of casein
micelles forms the
curd
3-dimensional gel network encapsulating fat and moisture
all of which affect cheese flavor, texture, and quality (Fox et al., 2000; Zhong, 2003; Holsinger et al.,
1995).
1.2.5 Ripening. During the ripening stage of cheese-making, the cheese remains undisturbed to
promote biochemical activity, such as the degradation of lactose, proteins, and fat. Proteolysis, the
breakdown of the protein network, is the primary ripening reaction in cheese and has a major
influence on rheological properties. A longer ripening time results in more degradation of the protein
network, thus creating a softer cheese (Ak and Gunasekaran, 1996). Along with texture, ripening
also affects cheese taste and aroma. Controlled variables in the cheese manufacturing process,
including cheese composition (moisture, salt content, and pH), level of residual coagulant activity, and
type of starter bacteria, result in taste, aroma, and textural changes during cheese ripening (Fox et al., 2000).
The rheological properties and microstructure of cheese is dependent upon the biochemical
and physical changes that occur in milk. Milk is composed of 86.6% water, 4.1% fat, 3.6% protein,
5.0% lactose, and 0.7% ash. For this reason, the fat and protein components in milk are of great
interest.
1.3 Casein
There are two types of proteins present in milk: whey protein and casein. Whey protein
accounts for 20% of the total milk proteins, and is removed as a liquid through the dehydration step.
Casein accounts for the remaining 80% of milk proteins, and is the primary component of the cheese
matrix (Dees, 2002). There are four individual caseins that include αs1 and αs2 casein, β-casein, and
κ-casein. The αs1-, αs2-, and β-caseins are calcium-sensitive caseins, and have low solubility when
calcium (Ca2+) is bound to casein clusters. Conversely, κ-caseins are calcium-insensitive and
amphiphilic; properties that are crucial for cheese production. The N-terminal region of casein
region (residues 106-169) is hydrophilic and extends into the milk serum to stabilize the suspension
(Rollema, 1992; Tuinier and de Kruif, 2002).
1.3.1 Casein Micelle Structure. Individual caseins do not exist as single proteins, but rather in
structures called casein micelles (Dickinson, 1992). The internal structure of a casein micelle
remains unclear, however the subunit model is widely accepted among scientists (Holt, 1992;
Swaisgood, 1996). In this model (Fig. 1.3), the casein micelle is composed of 10-100 casein
subunits, called submicelles, held together by calcium phosphate bridges. Submicelles are
approximately 15-20nm in diameter and spherical with a hydrophobic core consisting of the β
-caseins. The surface of the submicelle may or may not contain κ-casein. When κ-casein is present,
the hydrophobic region remains in the core of the submicelle, while the hydrophilic “hairy” tail, called
the glycomacropeptide (GMP), protrudes outward from the surface.
Fig. 1.3: Schematic of the casein micelle and casein submicelle
The casein micelle is composed of submicelles linked through hydrophobic interactions and
calcium phosphate bonds and is approximately 200nm in diameter. The core of the micelle is
composed of hydrophobic submicelles bonded by calcium phosphate bridges. Submicelles GMP “hairy” layer Hydrophobic
core
κ-casein
enriched surface
Casein Micelle Casein Submicelle
Fig. 1.3: Schematic of the casein micelle and casein submicelle. Filled circles are calcium phosphate clusters, Ca9(PO4)6 (Zhong, 2002; redrawn from
containing κ-casein remain on the outside of the micelle. The hydrophobic domains of κ-casein
engage in hydrophobic interactions with calcium-sensitive caseins to stabilize the micelle structure.
The hydrophilic “hairy” regions of κ-casein, which do not form calcium phosphate bonds, remain on
the surface of the micelle, extending outward into the milk serum to stabilize the suspension through
steric interactions. For this reason, a large number of submicelles rich in κ-casein yield a smaller
casein micelle (Swaisgood, 1996).
1.3.2 Coagulation of Casein Micelles. Coagulation of casein micelles is a primary step in cheese
making, requiring the aggregation of micelles to form a curd. The GMP “hairy” layer that protrudes
from the casein micelle surface is composed of 63 amino acid residues, 15 of which are charged to
give an effective dissociation constant, pKa, of 4.9 and an overall net negative charge (Tuinier and de
Kruif, 2002). When casein micelles approach each other, the overlapping “hairy” layers result in an
increase in osmotic pressure and develop repulsive, steric interactions between micelles. This steric
repulsion prevents casein micelles from aggregating and coagulating in milk, thus creating a stable
colloidal system (Dickinson, 1999; Dickinson and Stainsby, 1982).
To overcome the repulsive, steric interactions between casein micelles, the “hairy” layer
needs to be diminished through either acidification or renneting. During acidification, the pH of the
milk is lowered to the isoelectric point of casein micelles (pI = 4.6). At this point, the net charge of the
casein micelle is neutralized and the GMP “hairy” layer of the κ-casein collapses. The steric repulsion
between molecules is eradicated, and the caseins coagulate to form a curd (de Kruif, 1999; Tuinier
and de Kruif, 2002). Another approach to coagulating casein micelles is renneting (Fig. 1.2).
Renneting is an enzymatic hydrolysis utilizing the chymosin enzyme found in calf rennet. Chymosin
selectively cleaves the phenylalanine 105 – methionine 106 bonds in κ-casein, which distinguish
between the hydrophilic and hydrophobic regions, thereby removing the GMP “hairy” layer
(Swaisgood, 1992). The bare κ-casein that remains is called para κ-casein. When the GMPs are
calcium creates calcium bridges between micelles, resulting in aggregation and curd formation
(Everett and Olson, 2000; Tuinier and de Kruif, 2002; Dalgleish, 1997). The coagulation of casein
micelles creates a three dimensional gel network, entrapping fat and moisture and serving as the
primary structure component in cheese (Prentice, 1987).
1.4 Processed Cheese Production
Processed cheese differs from natural cheese because it is not made directly from milk and
may contain natural cheeses along with skim milk, water, butter oil, casein, caseinates, vegetable
oils, vegetable proteins, emulsifying salts and other minor ingredients (Fox et al., 2000). Processed
cheese-making involves the selection and blending of natural cheeses, addition of emulsifying salts,
thermal processing, homogenization, packaging, cooling, and storing (Dees, 2002; Carić and Kaláb,
1993).
1.4.1 Selection and Shredding of Natural Cheeses. Processed cheese can be made with a single
natural cheese, however a mix of various natural cheeses is most typical. The amount of ripening
time affects the flavor and texture of natural cheese during manufacturing. Matured cheeses have
sharp flavors, along with good flow and melt behaviors, while young cheeses are often associated
with a bland taste. As cheese matures for longer periods of time, the proteins are broken down into
shorter chains resulting in fewer interactions with each other, less elasticity, lower water holding
capacity, and decreased emulsifying properties (Fox et al., 2000). Therefore, younger cheeses offer
a firmer texture than matured cheese. By creating successful blends of natural cheeses, the quality
of processed cheese can be manipulated based on the proportions of young and matured cheeses
(Zhong, 2003, Dees, 2002). During manufacture, selected natural cheeses are shredded to increase
surface area and promote contact with ingredients during processing (Carić and Kaláb, 1993). Other
ingredients added to the selected natural cheese may include skim milk powder, water, fat in the form
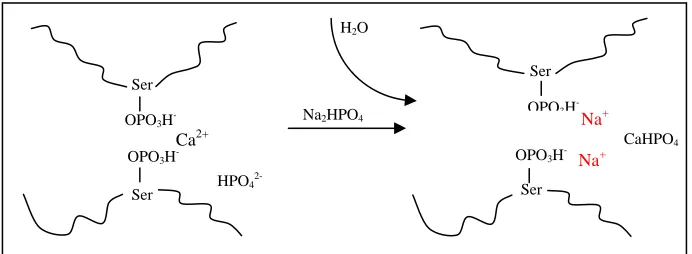
1.4.2 Emulsifying Salts. Emulsifying salts play a critical role in processed cheese structure
formation. The salts themselves are not emulsifiers, but rather increase the solubility of casein which
is the true emulsifying agent. Calcium, which holds the interior of casein micelles together via
colloidal calcium phosphate between serine residues, depresses water solubility of casein.
Emulsifying salts, such as sodium citrates and sodium phosphates, sequester and bind the calcium,
thus breaking the calcium phosphate bonds and increasing the solubility of casein particulates or
fragments (Fig. 1.4). The soluble casein is released from the protein matrix and increases
emulsification capabilities. The hydrated proteins can adsorb to the lipid/water interface, forming an
artificial film and homogenized cheese product (Fox et al., 2000; Carićet al., 1985; Dees, 2002).
Fig. 1.4: Action of emulsifying salts
1.4.3 Thermal Processing and Homogenization. The cheese blend is processed using direct or
indirect steam with constant agitation. The time of processing can range from 4-15 minutes in a
temperature region of 71oC to 95oC. The processing schedules are variable depending on the type
of processed cheese being produced. For instance, processed cheese produced for blocks is
processed at 80 to 85oC for 4 to 8 minutes, while processed cheese for slices undergoes processing
at 78 to 85oC for 4 to 6 minutes (Carić and Kaláb, 1993; Zhong, 2003). Next, the cheese blend
undergoes a homogenization step where high rates of shear slice fat globules to reduce their size,
thus increasing fat globule surface area. The new surface area is covered by caseins and casein Ser
OPO3H
-Ser OPO3H
-Ca2+
HPO4
2-Ser OPO3H
-Ser OPO3H
-Na+
H2O
Na+
CaHPO4
Na2HPO4
fragments present in the blend via the actions of emulsifying salts (detailed in section 1.6). The
casein covered milk fat globules have increased emulsification properties thus stabilizing a
homogenized cheese blend.
1.4.4 Packaging, Cooling, and Storing. After processing, the molten cheese blend is transferred
immediately to packaging hoppers. The cheese is packaged according to product specifications,
however blocks and slices are the most common products (Zhong, 2003). If the cheese is to be in
the sliced form, the molten blend is spread uniformly by steel rollers and cut using rotary knives to the
appropriate dimensions. Regardless of the form (blocks, slices, etc.), processed cheese is always
packaged in the absence of oxygen to inhibit mold growth (EPA, 1997).
1.5 Previous Research on Processed Cheese
During processed cheese manufacturing, the cheese mixture, containing skim milk, water,
butter oil, casein, caseinates, vegetable oils, vegetable proteins, emulsifying salts and other minor
ingredients, is heated to a molten 85oC and then cooled to refrigeration temperature (5oC). Upon
cooling, a protein gel network forms with fat globules dispersed throughout (Fig. 1.1). In previous
research, Zhong (2003) proposed a mechanism for the formation of a casein gel network and
investigated the influence of cooling rate and pH on the shear rheological properties and
microstructure of protein gels in the absence of fat. Using rennet casein, Zhong prepared protein gels
of different pHs (5.8, 6.5, 7.2, 12) and cooled them from 80to 5oC at 0.025, 0.05, 0.1, and 0.5 oC/min.
Zhong suggested a three step process for the formation of a rennet casein gel network during
cooling (Fig. 1.5): 1) formation of doublet particles from aggregated casein molecules, 2) flocculation
Fig. 1.5: Formation of rennet casein gels
Zhong hypothesized that doublets form when two casein molecules aggregate according to
the classical Derjauin-Landau-Verwey-Overbeek (DLVO) theory. Doublets serve as activation sites
for other doublets and, upon aggregation, result in the formation of protein particles. Research
suggested that doublet formation occurred during the cooling of protein gels from 80 to 60oC, and the
longer amount of time spent in this temperature region (i.e. slower cooling rate), a greater number of
doublets formed, thus creating more particles.
Following the aggregation of doublets into particles, these particles flocculate together as
fractal objects filled by the constructing units (particles), and can be quantified by a fractal dimension,
Df:
f
D f p
a
R
N
⎟⎟
⎠
⎞
⎜⎜
⎝
⎛
∝
where Np is the number of particles, Rfis the size of the fractal object, and a is the diameter of the particles. A fractal dimension describes how compact the particles are packed together: a larger
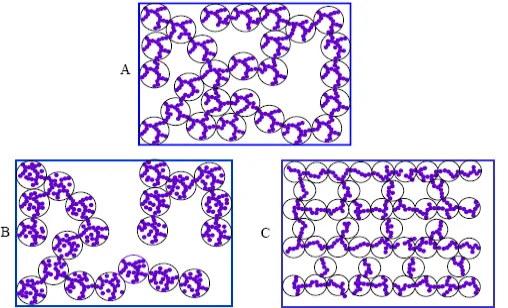
value of Dfrepresents a more compact structure. Under fractal theory concepts, the protein particles could pack in two different ways during aggregation: different compactness for flocs of similar sizes
(Fig. 1.6A vs. 1.6B) or different sizes for flocs of similar compactness (Fig. 1.6A vs. 1.6C).
Fig. 1.6: Fractal dimension and flock size effects on a gel structure
An increase in the particle number of a floc, results in an increase in the fractal dimension and
decrease in the total number of flocs. By decreasing the size of the flocs and maintaining the same
degree of compactness, this results in a greater number of total flocs. The rheological properties of a
particle gel are influenced by the fractal dimension, and as a result, Shih et al. (1990) developed a scaling theory to estimate the fractal dimension of a particle gel utilizing rheological data.
The final stage in protein gel development is the cross-linking of flocs to form the final gel
network. Zhong utilized confocal laser scanning microscopy and small amplitude oscillatory shear
(SAOS) rheology to apply the fractal theory for protein network formation under different cooling rates
and pHs. Due to limitations of microscope resolution, images could not capture the primary protein
particles, however casein flocs and their arrangements were observed. The total amount of protein
particles was constant at 18% protein concentration. Zhong discovered a trend between average floc
size, cooling rates, and shear elasticity; a larger number of smaller flocs were generated at slower
(larger G′ in SAOS). Zhong concluded that a slower cooling rate generated a greater number of
doublets and particles, thus creating more activation sites resulting in a greater number of smaller
flocs. Consequently, the final network, consisting of many small flocs was more elastic in shear, as
compared to a protein network cooled quickly containing a fewer number of larger flocs.
In addition to cooling rate, Zhong found that the microstructure and rheological properties of
protein gels was also affected by the pH during casein gelation. At higher pHs (7.2 and 12),
cross-linking of flocs formed a continuous network, whereas a discontinuous network was created at lower
pHs (5.8 and 6.5). The continuous network created in protein gels with higher pH values
corresponded with a greater elasticity.
To supplement Zhong’s research on protein gels, the current research investigated how the
addition of milk fat affects a protein matrix, similar to the microstructure of processed cheese.
Zhong’s research suggested that the protein matrix was established during cooling from 80-40oC,
followed by fat crystallization from 40-5oC, so that the microstructure and rheological properties of the
network are governed by the kinetics of protein gelation.
During analysis of processed cheese, Zhong found that a slower cooling rate during structure
formation provided a firmer product via SAOS, which correlates well with the cooling rate studies on
protein gels. However, the pH of processed cheese is between 5.8-6.5, the pH range in which protein
networks revealed the development of a discontinuous network, thus reducing the storage modulus.
The current research was done to gain a better understand of the effects of cooling rate on the
rheological and microstructural properties of casein-based food systems, such as processed cheese.
1.6 Milk Fat and the Milk Fat Globule Membrane
Fat is known to greatly contribute to the textural characteristicsof many dairy products, such
as yogurts and cheeses. In milk, fat is in the form of globules ranging in size from 0.1 – 20μm, which
are dispersed in a continuous milk serum phase. Fat globules are covered by a thin milk fat globule
Richter, 1997; Michalski et al., 2002; McPherson and Kitchen, 1983). While the MFGM is only 8-10
nm in thickness, the chemical composition and physical structure are critical to maintaining a
stabilized colloidal suspension. The MFGM acts as a natural emulsifying agent, enabling fat globules
to remain dispersed throughout the aqueous phase of milk, thus preventing globules from immediate
flocculation and coalescence (McPherson and Kitchen, 1983; Lee, 1997). In addition, the MFGM acts
as a physical barrier to protect fat globules from the activity of enzymes, such as lipase (Cano-Ruiz
and Richter, 1997; Walstra and Jenness, 1984). In processed cheese manufacturing, a stabilized
emulsion of protein and fat is achieved by disrupting the MFGM, via homogenization, in the presence
of casein.
1.6.1 Homogenization of Casein and Milk Fat. During processing, milk fat is subjected to
homogenization - a mechanical treatment of the fat globules in milk accomplished by subjecting milk
through narrow slits under high pressure (2000-2500 psi) and flow rates (Lee, 1997; Brunner, 1974;
Harper, 1976). The fat globules undergo sufficient shear to divide globules into those with diameters
ranging from 0.1 to 3 μm. The significant reduction in globule size greatly increases the total surface
area of fat globules by five to ten times (Brunner, 1974; Lee, 1997). The original, or native MFGM,
remains attached to the milk fat globule, however due to the increase in surface area, it is insufficient
to cover the entire globule. The newly created surface of the fat globule is covered by the adsorption
of proteins (surface active materials) present in the milk phase, primarily casein and whey proteins.
While casein micelles and whey proteins have both been shown to adsorb to the bare surface of the
fat globule, casein constitutes the majority of adsorbed protein and is believed to cover approximately
75% of the total surface (Walstra and Oortwijn, 1982). Sharma and Dalgleish (1993) reported that it
is casein, in the form of semi-intact micelles or as micellar fragments, that attach to the denuded fat
globule surface. The newly formed, casein-rich membrane does not favor cluster formation, thus
preventing aggregation and coalescence of fat globules and maintains a colloidal suspension
Rather than whole casein micelles adsorbing to the milk fat membrane, semi-intact or
fragments of casein micelles adsorb more quickly to stabilize fat globules. When making processed
cheese that utilizes renneted casein, the paracasein micelles need to be “broken apart” into individual
caseins or smaller casein clusters. For this to happen, emulsifying salts are added to increase the
solubility of casein micelles. The interior of the micelle is held by colloidal calcium phosphate (CCP),
Ca3(PO4)2. The CCP acts as a cementing agent, holding submicelles together to form casein
micelles (Lucey and Fox, 1993). Emulsifying salts consisting of a monovalent cation (Na+) and a
polyvalent anion (PO42-) sequester and bind calcium, thus breaking apart the casein micelle (Fox et
al., 2000; Dees, 2002). The increase in solubility of casein results in the increase in emulsification
properties. Therefore, upon homogenization, the individual or fragments of paracasein micelles
adsorb to the damaged MFGM (Fig. 1.7). The newly formed fat globules behave as pseudo-protein
particles and are able to become part of the protein gel network (Fox et al., 2000, Everett and Olson,
2003; van Vliet and Dentener-Kikkert, 1982). Using emulsifying salts, the dispersed constituents of
protein and fat are modified, resulting in an improved emulsion with a much less tendency of free fat
to separate, resulting in the cheese to oil off (Zehren and Nusbaum, 2000).
Fig. 1.7: Homogenization of milk fat and casein in the presence of emulsifying salts
Individual caseins and casein fragments ( ) cover newly formed milk fat surface area and join the protein network, thus
encapsulating moisture ( ) and the fat globules ( ).
native milkfat globule membrane
casein micelles
emulsifying salts and homogenization
1.7 Emulsifying Salts
Processed cheese is considered an oil in water emulsion, where an emulsion is defined as a
two-phase system; one discontinuous phase dispersed in another continuous phase, separated by a
layer of emulsifier (Fox et al., 2000). These emulsifiers are amphipathic molecules with a
hydrophobic end that is fat-loving and hydrophilic domain that associates with water, thus stabilizing
the system. In process cheese, the role of emulsifying salts is often misunderstood for the reason
that they are not the true emulsifiers - they are not amphipathic. Instead, emulsifying salts are
responsible for increasing the solubility of casein which then creates an emulsified cheese product.
Individual caseins and casein fragments are amphipathic and have the ability to act as
surfactants between dispersed fat globules and the continuous protein network in processed cheese.
However, these smaller casein subunits are bound into casein micelles via calcium phosphate bonds.
Emulsifying salts, such as tetrasodium pyrophosphate, trisodium phosphate, monosodium phosphate,
disodium phosphate, and sodium citrates, are added to either remove calcium with sodium or bind to
the colloidal calcium complex. Removing this calcium breaks the casein micelle apart and increases
the solubility and emulsifying power of individual caseins and fragments. Essentially, emulsifying
salts convert the protein network from calcium para-casein to sodium phosphate para-caseinate,
which is the distinguishing factor between natural and processed cheese (DMI, 2004; Zhong, 2003;
Fox et al., 2000).
In addition, emulsifying salts control the pH of process cheese. Emulsifying salts differ in pH,
so by using the correct blend of emulsifying salts, the pH of processed cheese is shifted upwards to
about 5.6-5.9 and is stabilized by the high buffering capacity of the salts (Fox et al., 2000). Thus, the
extents of pH buffering and calcium sequestration by emulsifying salts are critical factors controlling
the textural attributes of processed cheese products (Fox et al., 2000).
1.8 Factors that Affect the Texture and Functionality of Processed Cheese
properties, including melt-ability, slice-ability, and stretch-ability (Fox et al., 2000). These textural and
functional characteristics of processed cheese originate from ingredient formulation and processing
conditions, such as casein content, fat globule size and distribution, moisture, and the selection of
emulsifying salts.
1.8.1 Casein Content. Processed cheese is an oil in water emulsion comprised of a continuous
casein network with fat dispersed throughout. Therefore, the concentration of casein greatly
influences the strength of the cheese network. A stronger or firmer network is formed as the
concentration of casein increases (Zhong, 2003).
1.8.2 Fat Globule Size and Distribution. The size and distribution of fat globules influences
firmness and other functional properties of processed cheese like oiling-off, flow-ability, and,
melt-ability. In processed cheese, fat globules are uniformly distributed (unlike natural cheese) and usually
range between 0.3 to 3 μm in diameter. Fat globule size is dependent upon formulation (type and
quantity of emulsifying salts, ingredients, age of natural cheese) and processing conditions (shear
rate, temperature, and time) (Fox et al., 2000). Generally, processed cheese with smaller fat globules
is firmer in texture and exhibits a low tendency to oil-off and poor flow-ability during cooking.
1.8.3 Moisture. The moisture content of processed cheese is dependant upon the selection of
natural cheeses used and the desired cheese type. Processed cheese that contains a low amount of
moisture tends to be firmer due to a higher solids concentration. Conversely, a higher moisture
content generally yields cheese products that are softer, less elastic and more adhesive, and
spreadable (Fox et al, 2000; Zhong, 2003).
1.8.4 Selection of Emulsifying Salts. Emulsifying salts play a key role in processed cheese
para-casein, which binds water and emulsifies fat during processing, as discussed in Section 1.7
(DMI, 2004; Zhong, 2003; Fox et al., 2000). The most common emulsifying salts used in processed
cheese manufacturing include sodium citrates, sodium hydrogen orthophosphates, sodium
pyrophophates, sodium polyphosphates, and sodium aluminum phosphates (Fox et al., 2000).
Individual emulsifying salts differ with regard to their ability to sequester and bind calcium, control pH,
promote emulsification, and hydrate and disperse casein. (Zehren and Nusbaum, 2000; Fox et al.,
2000). For instance, mono- and disodium citrates have a low pH and poor emulsifying capabilites,
thus producing processed cheese that is acidic, crumbly, and shows a high degree of oiling off.
Trisodium citrate, however, binds calcium well and is commonly used for soft, easily melted cheeses
(Fox et al., 2000; DMI, 2004). Because individual emulsifying salts have different properties and
emulsifying capabilities in processed cheese, a blend of emulsifying salts is most typically used to
impart certain textures and functionalities of processed cheese (i.e. different degrees of melt-ability,
slice-ability, spread-ability, hardness) (DMI, 2004; Zhong, 2003; Fox et al., 2000; Zehren and
Nusbaum, 2000).
1.9 Cheese Rheology
Rheology is the science of the deformation and flow of materials when subjected to a stress
or strain (Fox et al., 2000; Steffe and Daubert, 2006; Steffe, 1996). During mastication, food is cut by
the incisors, compressed by the molars, and sheared between the palate and tongue. These
mechanical processes subject food to a number of compressive and shear forces that reduce food to
a size capable of being swallowed (Fox et al., 2000). In the food industry, processing also imparts
shear, compressive, and torsional forces on a system. The flow of foods through pipes or the ease at
which they can be packed into containers is largely determined by their rheology. For this reason, it
is crucial to evaluate food, such as cheese, under large and small stresses (force per unit area
applied to a material) and strains (deformation of the material resulting from the applied stress).
breakdown or failure. Small deformation rheology measures the strength of the internal network and
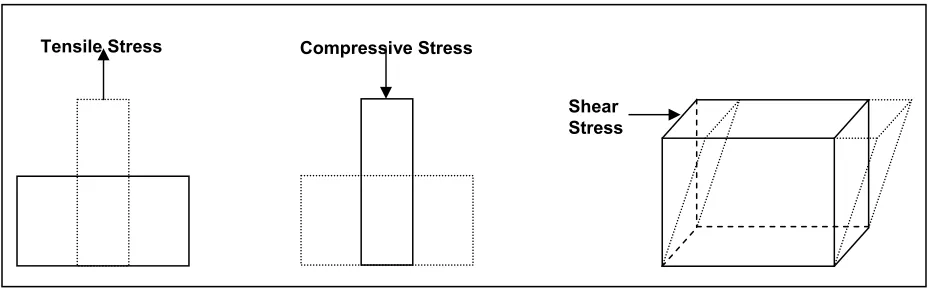
does not result in structural breakdown. In both small and large deformation rheological
measurements, the applied stress may be normal, or perpendicular to the surface, called tensile and
compressive stresses, or parallel to the surface, referred to as shear stresses (Fig. 1.8) (Hamann et al., 2006).
Fig. 1.8: Applied stress may be tensile, compressive, or shear
Cheese is considered a “viscoelastic” material; a term used to describe materials that do not
exhibit purely elastic or purely viscous properties, but rather a combination of the two behaviors.
When energy is applied to an elastic solid (i.e. deformation), all energy is stored so that the material
will show complete recovery. Conversely, in purely viscous materials, called Newtonian fluids, the
applied energy is completely dissipated as heat so that the material does not recover.
Processed cheeses, and most foods, are viscoelastic materials, meaning they exhibit rheological
properties of a solid and a fluid; a portion of the applied energy is stored, while the remaining energy
is dissipated as heat. In general, there are two types of tests used to evaluate the rheological
properties of cheese: empirical and fundamental tests. Empirical tests provide subjective material
characteristics, dependent upon the measuring conditions and instruments. Fundamental tests, on
the other hand, can be carried out on different instruments to yield the same results (Steffe, 1996).
Fundamental rheological tests that measure shear properties of materials include small amplitude Tensile Stress Compressive Stress
Shear Stress
oscillatory shear (SAOS) tests that probe the sample under small deformations, or torsion tests which
measure the shear strength of a material via large strains, resulting in material fracture.
Fundamental tests may also be performed normal, or perpendicular to the surface of materials.
These tests include the use of a dynamic mechanical analyzer (DMA) for small strain analysis, while
a Universal Testing Machine may be used to analyze the compressive or tensile strength of a sample
via large sample deformations that result in sample fracture.
1.9.1 Empirical Tests. Empirical tests are used to make qualitative measurements and are
dependant upon the measuring conditions and apparatus. An example of empirical testing is when
cheese graders use a knife to slice, or press a probe into cheese and record the resistance (Fox et al., 2000; Zhong, 2003). Texture Profile Analysis (TPA) is another empirical method originally
designed to mimic two consecutive bites in the mouth. TPA is frequently used when rapidly
characterizing the texture of solid and semi-solid foods, comparing the textural properties between
samples, and has been found to be very useful when used in conjunction with sensory panels to
quantitatively describe sensory parameters including hardness and gumminess (Steffe, 1996; Zhong,
2003; Tunick and Van Hekken, 2002).
1.9.2 Large Deformation Tests. Large-strain tests provide fundamental rheological properties that
are independent of the measuring instrument. For processed cheese evaluation, large stresses and
strains are applied to the samples, usually resulting in structural breakdown, or fracture (Fox et al.,
2000). Torsion testing may require the cheese sample to be milled into a capstan shape to ensure
fracture at the center of the specimen. The sample is then twisted, and the shear stress and shear
strain is measured at the fracture point (Diehl et al., 1979). Torsion tests may not be desirable when
measuring the strength of a specific network, such as a protein and fat network formed within cheese
during cooling, because the network is destroyed during sample preparation (milling or grinding),
attachment of the material to the equipment which may entail using commercial glue to adhere the
ends of the material to the testing machine (Hamann et al., 2006; Montejano et al., 1983). A more
favorable large-strain test for processed cheese would be compression studies, which do not require
the sample to be capstan in shape, and therefore milling is not necessary. Samples are typically
cylindrical in shape and placed between two parallel plates, an immobile bottom (base) plate and a
vertically moving top plate (cross-head) (Fox et al., 2000). The cross-head is lowered at a controlled
rate and exerts a force normal to the surface of the sample (Fig. 1.9).
During compression the normal stress is determined while the sample is deformed at a constant
speed. For an elastic solid, stress is proportional to strain, and the modulus is independent of strain
rate. Two types of moduli are used when relating stress to strain: (1) Young’s modulus and (2) elastic
shear modulus. Young’s modulus (E) is used when working with normal stresses, whereas the shear
modulus (G) is used in shear rheology, to be discussed in detail in section 1.9.3.
During compression testing, the sample is placed on a fixed base plate and the cross head is
lowered at a controlled rate. The amount of force required for deformation, or fracture of the sample
is the measurable parameter referred to as the compressive load. The normal stress (
σ
z) applied tothe sample can be calculated using Eq. 1,
⎟⎟
⎠
⎞
⎜⎜
⎝
⎛
⎟⎟
⎠
⎞
⎜⎜
⎝
⎛
−
=
i i zL
L
A
F
σ
(1)where
F
is the compressive load,A
i is the initial surface area of the sample,L
is the height ofFig. 1.9: Application of a compressive stress
There are two possible ways to calculate normal strain associated with a normal stress: (1)
Cauchy strain (
ε
c) or (2) Henky strain (ε
h). The Cauchy strain is used when the structure of thesample is effectively unaltered during measurement, which results under small deformations (strains
< 1%). When utilizing the Cauchy strain, the key assumption is that the sample remains cylindrical in
shape (Steffe, 1996; Hamann et al., 2006). The Cauchy strain can be calculated using Eq. 2:
i c
L
L
Δ
=
ε
(2)where
Δ
L
is the compressive extension or change in sample height. When considering large strains (>1%) that cause complete breakdown and structural damage, the Henky strain is used to account forthis multidirectional sample deformation (Eq. 3):
F
L
iL
A
i⎟⎟
⎠
⎞
⎜⎜
⎝
⎛
+
Δ
−
=
i h
L
L
1
ln
ε
(3)For this research, the Henky strain was used for strain calculations during compression analysis
because strains greater than 1% were applied to cheese samples. For an elastic solid, Young’s
modulus (
E
) is independent of the rate at which the stress is applied and relates normal stressesand strains by:
h z
E
ε
σ
=
(4)When stresses and strains exhibit a linear relationship (i.e. stress is proportional to strain), the
material is demonstrating elastic solid-like behavior and is considered to be in the linear viscoelastic
regime. At small strains, cheese and other viscoelastic foods will have a linear relationship between
stress and strain, however as the strain increases from larger deformations (i.e. compression to
fracture) this relationship does not stay linear and Hooke’s law relating stress and strain no longer
applies.
1.9.3 Small Deformation Tests. While large strain rheology evaluates the force required for sample
breakdown or fracture, small deformation rheology probes the strength of the sample microstructure
or internal network without structural damage (Steffe, 1996). Small strain tests may be performed in
the normal direction utilizing a dynamic mechanical analyzer (DMA) or in the shear direction via
oscillation (small amplitude oscillatory shear, SAOS) of the sample. Shear deformations can be
performed in one of two modes: (1) stress-controlled, where the stress amplitude is fixed and the
strain measured or (2) strain-controlled, where strain is fixed and stress is measured (Steffe, 1996).
In either mode, SAOS involves some key assumptions: 1) there is a constant stress or strain
neglected, and 4) measurements are taken within the linear viscoelastic region (Steffe, 1996; Zhong,
2003).
In a strain-controlled setting, the applied strain varies harmonically with time in a sinusoidal
fashion and the stress response of the sample is measured. The shear strain (
γ
) in the material is afunction of time (
t
):)
sin(
)
(
t
γ
oϖ
t
γ
=
(5)where
γ
o is the amplitude of the sinusoidal strain andϖ
is the frequency of oscillation. Theresulting shear stress,
σ
s, is produced by the strain input:)
sin(
ϖ
δ
σ
σ
s=
ot
+
(6)where
σ
o is the stress amplitude andδ
is the phase lag or phase shift.When a shear strain is applied to a Hookean solid, this energy is completely stored in the
material and the shear stress response is in phase with the sinusoidal strain input (Fig. 1.10a). For a
Newtonian fluid, the energy applied as a shear strain is completely dissipated, so that the shear
Fig. 1.10: Strain input and stress response for Hookean solids and Newtonian fluids
For viscoelastic materials which demonstrate both solid-like and liquid-like behaviors, the stress
response may not be completely in phase or completely out of phase with the strain input. The phase
lag or phase shift (
δ
) quantifies the degree to which a material behaves as a solid (stress is in phasewith strain,
δ
= 0o) or liquid (stress out of phase with strain,δ
= 90o) (Fig. 1.10). Consequently, thephase shift for viscoelastic materials is a value between 0 and 90 degrees (0o≤
δ
≤ 90o).The amplitude of the stress response divided by the amplitude of the strain input corresponds
to the complex modulus,
G
*
, which identifies the contributions from solid-like behavior,G
′
, andliquid-like behavior,
G
′′
:2 2
)
(
)
(
*
G
G
G
o
o
=
′
+
′′
=
γ
σ
(7)
The shear storage (or elastic) modulus,
G
′
, is representative of the stress that is in phasewith the strain, or demonstrating solid-like behavior, whereas the shear loss (or viscous) modulus,
G
′′
, is indicative of the liquid-like behavior where stress is out of phase with strain:Strain Stress Time Input Strain Stress Response Strain Stress Time Input Strain Stress Response (a) (b)
δ = 90o
δ= 0o
( )
*
cos(
)
cos
δ
δ
γ
σ
G
G
o o=
⎟⎟
⎠
⎞
⎜⎜
⎝
⎛
=
′
(8)( )
*
sin(
)
sin
δ
δ
γ
σ
G
G
o o=
⎟⎟
⎠
⎞
⎜⎜
⎝
⎛
=
′′
(9)Therefore, by setting up an inequality using equations 8 and 9, the phase shift may be defined as the
energy lost per cycle divided by the energy stored per cycle:
G
G
′
′′
=
)
tan(
δ
(10)1.9.4 Relating SAOS and Compression. Utilizing fundamental equations, shear and normal values
can be related (Hamann et al., 2006). When a compressive force fractures a material, the material may fail in shear or compression, determined by the angle of fracture. If the fracture is in the
longitudinal direction, the material fails through compression resulting from the maximum normal
stress,
σ
z (Fig. 1.11a). If the fracture angle is 45o with the longitudinal direction, the material fails inshear (Fig. 1.11b).
The normal stress,
σ
z, and normal, or Henky, strain,ε
h, and can be converted into shearstress,
σ
s, and strain,γ
, values by,z
s
σ
σ
4
3
−
=
(11)h
ε
γ
2
3
−
=
(12)Utilizing equations 11 and 12 make it possible to compare stress and strain values calculated for two
modes of rheological analysis: shear and compression.
1.10 Microscopy
The microstructure, or structural arrangements of components, in food products is
determined by two factors: processing and composition (Heertje, 1993). The main components in
food products are protein, fat, carbohydrates, water, and air. A careful selection of these
components, based on their chemical and physical properties, in combination with optimal processing
conditions determines a food’s microstructure and product properties including hardness,
spreadability, mouthfeel, emulsion stability, appearance, taste perception, and salt release (Blonk and
van Aalst, 1993; Heertje, 1993). Therefore, microscopy techniques, to analyze food microstructure
under different processing conditions and composition, are crucial for the control and manipulation of
product properties (Blonk and van Aalst, 1993; Heertje, 1993).
The two most widely used microscopy techniques for food research are electron microscopy
and light microscopy (Auty et. al., 2001; Blonk and van Aalst, 1993; Heertje, 1993; Yiu, 1985).
Electron microscopy techniques include transmission electron microscopy (TEM), cryo-scanning
(FFEM). Transmission electron microscopy techniques require careful preparation and very thin
slices of material
for specimen analysis. Thick samples, such as processed cheese, that are shear-sensitive and
require a disturbance free observation are often observed via light microscopy techniques, including
fluorescence and confocal laser scanning microscopy (CLSM) (Blonk and van Aalst, 1993; Heertje,
1993; Dürrenberger et al., 2001). In foods with a high fat content or in bulk milk fat samples,
polarized light microscopy (PLM) has been utilized to observe the crystalline fat structure and network
(Tang and Marangoni, 2006; Awad et al., 2004; Campos et al., 2002). The primary advantages of
CLSM to analyze food microstructure is the ability to probe three-dimensional specimens, the ability
to observe samples under environmental conditions, utilize a specially designed heating/cooling stage
to mimic processing conditions, and easily stain selective structural elements within the sample
(Blonk and van Aalst, 1993; Dürrenberger et al., 2001).
Previous microscopy research of dairy foods including cheese, fat spreads, and chocolate
have utilized CLSM in conjuction with fluorescent probes, such as Nile Red and Rhodamine B, for
labeling of fat and protein, respectively (Auty et al., 2001; Blonk and van Aalst, 1993; Everett and
Olson, 2003; Heertje, 1993; Lee et al., 2003). According to induction time measurements from
turbidimetry, Herrera and Hartel (2000) found that low levels of Nile Red fluorescent dye (i.e.
0.0001% by weight) does not modify nucleation kinetics during fat crystallization, therefore making
the combination of fluorescent probes and CLSM very beneficial for analyzing cheese microstructure.
1.11 Scope of Work
Cooling, the final step in processed cheese making, is when fat crystallization occurs, along
with the formation of protein-protein interactions and fat-protein interactions (Fox et al., 2000). This
stage is extremely important because these interactions ultimately affect the functionality and
microstructure of processed cheese. This research looks at the affects of cooling rate on the
During previous research by Zhong (2003), a viable mechanism was proposed, investigated,
and defended for casein gelation – a critical process in many dairy foods. This study found that
slower cooling rates of protein gels lead to a firmer gel network when the viscoelastic properties were
analyzed via oscillatory shear rheological testing. The mechanism was based on the size and number
of casein flocs created upon cooling. However, the model system was simplified and did not
incorporate fat into the formulation. Milk fat crystal sizes are larger for slower cooling rates, a trend
that counteracts the behavior of the casein network. Casein structure develops prior to fat
crystallization (80oC – 40oC), therefore it is speculated that a more uniform casein structure,
generated upon slower cooling during protein network formation, should confine fat crystal sizes to
generate a firmer cheese. This research incorporates anhydrous milk fat into the rennet casein
system to create a fat and protein emulsion similar to processed cheese (cheese analogues). The
ratio of protein to fat is an important factor in cheese rheology and microstructure, so cooling effects
were investigated at a protein to fat ratio of commercially processed cheese, and also above and
below this ratio. Small amplitude oscillatory shear was used for rheological analysis, while confocal
laser scanning microscopy was utilized to study cheese microstructure.
Studying the effects of cooling schemes on the rheological properties and microstructure of
processed cheese allows cheese manufacturers to optimize or create cooling schedules which can
then be used to influence quality attributes in processed cheese.
1.12 References
Ak, M.M. and Gunasekaran, S. 1996. Dynamic rheological properties of Mozzarella cheese during refrigerated storage. Journal of Food Science. 61(3): 566-569.
Auty, M.A.E., Twomey, M., Guinee, T.P., and Mulvihill, D.M. 2001. Development and application of confocal scanning laser microscopy for studying the distribution of fat and protein in selected dairy products. Journal of Dairy Research. 68: 417-427.
Berger, W., Klostermeyer, H., Merkenich, K., and Uhlmann, G. 1989. Processed Cheese Manufacture, A JOHA Guide. BK Ladengurg GmbH., Wurzburg, Germany.
Blonk, J.C.G. and van Aalst, H. 1993. Confocal scanning light microscopy in food research. Food Research International. 26: 297-311.
Brunner, J.R. 1974. Physical equilibria in milk: the lipid phase. In “Fundamentals of Dairy
Chemistry,” edited by Webb, B.G., Johnson, A.G., and Alford, J.A. AVI Publishing Co., Westport,
Connecticut.
Campos, R., Narine, S.S., and Marangoni, A.G. Effect of cooling rate on the structure and mechanical properties of milk fat and lard. Food Research International. 35: 971-981.
Cano-Ruiz, M.E. and Richter, R.L. 1997. Effect of homogenization pressure on the milk fat globule membrane proteins. Journal of Dairy Science. 80: 2732-2739.
Carić, M., Gantar, M., and Kaláb, M. 1985. Effects of emulsifying agents on the microstructure and other characteristics of process cheese – a review. Food Microstructure. 4: 297-312.
Carić, M. and Kaláb, M. 1993. Processed cheese products. In “Cheese: Chemistry, Phsyics and Microbiology. Vol. 2,” edited by P.F. Fox. Chapman and Hall, New York.
Dairy Management Inc. (DMI). 2004. Controlling processed cheese functionality. Innovations in Dairy: Dairy Industry Technology Revew.
Dalgleish, D.G. 1997. Structure-function relationships of caseins. In “Food Proteins and their Applications,” edited by S. Damodaran and A. Paraf. Marcel Dekker, New York.
Dees, A.L. 2002. Effect of Various Ingredients on a Model Process Cheese System. M.S. Thesis,
North Carolina State University.
DeMan, J.M. 1964. Physical properties of milk fat. Journal of Dairy Science. 47: 1194-1200. DeMan J.M. 1999. Relationship among chemical, physical and textural properties of fats. In
“Physical Properties of Fats, Oils and Emulsifiers”, edited by N. Widlak. AOCS Press,
Champaign, Illinois. 79-95.
Dickinson, E. 1992. An Introduction to Food Colloids. Oxford University Press, New York.
Dickinson, E. 1999. Caseins in emulsions: interfacial properties and interactions. International Dairy Journal. 9: 305-312.
Dickinson, E. and Stainsby, G. 1982. “Colliods in Food,” Applied Science Publishers, New York.
Diehl, K.C., Hamann, D.D., and Whitfield, J. K. 1979. Structural failure in selected raw fruits and vegetables. Journal of Texture Studies. 10: 371-400.
Dürrenberger, M.B., Handschin, S., Conde-Petit, B., and Escher, F. 2001. Visualization of food structure by confocal laser scanning microscopy. Lebensmittel-Wittenschaft und-Technologie.