Assessing Probability of Ancestry Using Simple Sequence Repeat Profiles:
Applications to Maize Inbred Lines and Soybean Varieties
Donald A. Berry,*
,1Jon D. Seltzer,
†Chongqing Xie,
‡Deanne L. Wright,
‡Elizabeth S. Jones,
‡Scott Sebastian
‡and J. Stephen C. Smith
‡*Department of Biostatistics, The University of Texas M. D. Anderson Cancer Center, Houston, Texas 77030,†Medtronic,
Minneapolis, Minnesota 55432 and‡Pioneer Hi-Bred International, Johnston, Iowa 50131
Manuscript received February 24, 2003 Accepted for publication April 28, 2003
ABSTRACT
Determining parentage is a fundamental problem in biology and in applications such as identifying pedigrees. Difficulties inferring parentage derive from extensive inbreeding within the population, whether natural or planned; using an insufficient number of hypervariable loci; and from allele mismatches caused by mutation or by laboratory errors that generate false exclusions. Many studies of parentage have been limited to comparisons of small numbers of specific parent-progeny triplets. There have been few large-scale surveys of candidates in which there is no prior knowledge of parentage. We present an algorithm that determines the probability of parentage in circumstances where there is no prior knowledge of pedigree and that is robust in the face of missing data and mistyped data. The focus is parentage of an inbred line having uncertain ancestry. The algorithm is a variation of a previously published hybrid-focused algorithm. We describe the algorithm and demonstrate its performance in determining parentage of 43 inbred varieties of soybean that have been profiled using 236 SSR loci and from seven inbred varieties of maize that were profiled using 70 SSR loci. We include simulations of additional levels of missing and mistyped data to show the algorithm’s utility and flexibility.
T
HE determination of parentage using molecular phase is in contrast to the case of a hybrid progeny. An marker data has been little addressed for situations inbred progeny individual will exhibit a lower level of where there is little or no prior knowledge of parentage allelic similarity to either of its inbred parents than a or when large-scale surveys involving numerous candi- hybrid progeny will to its inbred parents. This loss of date parents are required. Consequently, we have re- some parental alleles during inbreeding might be ex-cently developed an algorithm and demonstrated its use pected to make an inbred algorithm less robust in the in determining probability of parentage for hybrids in face of missing or mistyped data compared with the circumstances where there is no prior knowledge of hybrid algorithm that has been previously described pedigree and that is robust in the face of missing or (Berryet al.2002). We therefore demonstrate the effec-mistyped data (Berry et al. 2002). We now present a tiveness and robustness of the inbred algorithm using variation of this algorithm that allows determination of examples from two species of cultivated plants. We first parentage for inbred lines or homozygous varieties. tested the algorithm using varieties of the naturally self-We describe and evaluate a methodology that quanti- pollinating inbred crop, soybean [Glycine max. (L.) fies the probability of parentage of homozygous geno- Merr.]. This crop was selected because numerous varie-types. Our algorithm takes into account that generations ties of soybean with known pedigrees were available to of self-pollination occur after the initial parental cross. us, many of which are closely related. We also used The number of generations and the initial parental publicly bred inbreds of maize (Zea mays L.) that are genotypes are unknown. Each generation of inbreeding of known pedigree. Maize is naturally an outcrossing reduces the number of heterozygous loci in the progeny species but inbred lines are most usually generated for by an average of 50%. Thus, each of the inbred progeny use as parents of commercial hybrids. Inbred lines are individuals resulting from the initial parental cross will generated by making successive generations of self-polli-have lost approximately half of the parental alleles for nation following the initial biparental cross.loci where the inbred parents were fixed for alternate alleles and that were heterozygous in the F1generation.
The loss of parental alleles during the inbreeding
MATERIALS AND METHODS
Algorithm:The algorithm is a variation of the hybrid version ofBerryet al.(2002). Consider an index inbred whose parent-1Corresponding author:Department of Biostatistics, The University of
age is unknown or in dispute. A database containing possible
Texas M. D. Anderson Cancer Center, 1515 Holcombe Blvd., Unit
447, Houston, TX 77030-4009. E-mail: [email protected] inbred ancestors is available. The objective is to find the
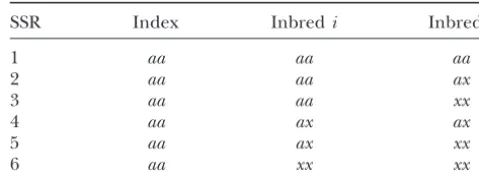
bilities of closest ancestry for each inbred in the database, TABLE 1 using genotypic information from a large number of simple
Calculations of ancestry for homozygous index inbreds: cases sequence repeats (SSRs).
that must be considered for an example of genotypeaa
Consider a pair of possible ancestors, inbrediand inbred
j. We calculate the probability that inbredsiandjare in the
index’s ancestry, repeating this for all pairs of inbreds in the SSR Index Inbredi Inbredj
database. LetP(i,j|SSRs) stand for the posterior probability
1 aa aa aa
thatiandjare ancestors of the index given the information
2 aa aa ax
from the various SSRs. LetP(i,j) stand for the unconditional
3 aa aa xx
(or prior) probability of the same event and letP(SSRs|i,j)
4 aa ax ax
be the probability of observing the various SSR results if in
5 aa ax xx
factiandjare ancestors of the index. Just as inBerryet al.
(2002), Bayes’ rule relates these various probabilities, 6 aa xx xx
xis any allele different froma, but not missing.
P(i,j|SSRs)⫽P(SSRs|i,j)
⫻P(i,j)/兺[P(SSRs|u,v)⫻P(u,v)],
P(SSR|i,j)⫽p2(1/2⫹1/2⫻1/n)
where the sum in the denominator is over all pairs of inbreds
in the database, indexed by uand v. We need to calculate ⫹
p(1⫺p)(1/2⫹1/n⫻1/2)
P(SSRs|i,j) for eachiandj. We make the “no prior
informa-tion” assumption thatP(i, j) is the same for all pairs (i, j). ⫹p(1⫺p)(1/n)⫹(1⫺p)2(1/n).
ThenP(u,v) is a common multiple in the denominator that
Another possibility not considered above is that more than two cancels withP(i,j) in the numerator:
alleles can be observed for an SSR marker run on an individual
P(i,j|SSRs)⫽P(SSRs|i,j)/兺P(SSRs|u,v). DNA sample. This can be due to SSR locus duplication, homol-ogy due to alloploidy, more than one individual plant being The problem is to calculate a typicalP(SSRs|i,j), the probabil- sampled for DNA extraction, or cross-contamination. In this ity of observing the index’s SSRs assuming inbredsiandjare case we consider all possible pairings of the observed alleles both ancestors. The nature of breeding before the self-pol- and calculate using a multiple-imputation procedure (Little lination process is unknown. Since the creation of an inbred andRubin1987).
proceeds by multiple generations of self-pollination on a hy- To find the overall P(SSRs|i, j), multiply the individual brid, we label the (unknown) hybrid used to create the (known) P(SSR|i,j) over the various SSRs. To determine the probability index inbred as the intermediate hybrid. When the intermedi- that any particular inbred, say inbredi, is the closest ancestor ate hybrid is an immediate descendant ofiandj, it receives of the index, sumP(SSR|i, v) over all inbredsv withv ⬆i. one of inbredi’s alleles and one of inbredj’s alleles. When Call thisP(i|SSRs). The maximum ofP(i|SSRs) for any inbred the intermediate hybrid is a second generation descendant iis 1. But since there is one closest ancestor on each side of ofiandj, it receives one allele from each with probability 0.5. the family, the sum ofP(i|SSRs) over all inbredsiis 2. And so on. Since degree of ancestry (if any) is unknown, we SSR data: Soybean DNA was extracted from 490 varieties, label the actual probability of passing on one of these alleles all of which were bred in and are adapted to the United States. to the intermediate hybrid to beP. As inBerryet al. (2002) Plant material for DNA extraction was sampled from six plants we considerP⫽0.50 andP⫽0.99 and here we also consider of each variety. Most of the varieties are proprietary products the intermediate valueP⫽0.75. of Pioneer Hi-Bred International. Several (nonpatented) com-When inbredsiandjare ancestors, there are four possibili- mercial varieties from other breeding companies and some ties: (1) the alleles of bothiandjwere passed to the intermedi- important publicly bred varieties were also included. Proce-ate hybrid, (2)icame through but notj, (3)jcame through but dures for obtaining SSR data from soybean were identical to those described for maize byBerryet al. (2002) apart from noti, and (4) neither came through. Assuming independence,
these have respective probabilities p2, p(1⫺ p), p(1 ⫺ p), the following modifications: PCR products with different size
ranges and labeled with different fluorochromes were pooled (1⫺p)2. An allele in the intermediate hybrid’s genotype that
did not arise from either inbredior inbredjis assumed to and diluted 1:9 with capillary electrophoresis buffer (Applied Biosystems, Foster City, CA) and then 1:4 with dH2O. A total
be selected with probability 1/n, wherenis the total number
of alleles at the SSR in question. So far the steps we have of 1.5l of pooled DNA was added to 10l formamide con-taining the molecular weight size standard 400 HD 6-carboxy-described are identical to those for identifying the ancestors
of a hybrid described byBerryet al. (2002) and, in fact, if X-rhodamine (ROX; Applied Biosystems). Fragment separa-tion was performed using capillary electrophoresis on an the index is heterozygous at an SSR, then calculations proceed
just as for hybrids. Calculations are substantially different when ABI3700 platform (Applied Biosystems), with an injection time of 10 sec at 10,000 V and a run time of 4000 sec at 7500 the index inbred is homozygous, say genotypeaa. Cases that
must be considered are shown in Table 1, wherexis any allele V. Forty-three soybean varieties that had both of their parent varieties also included in the data set were assigned as index different froma(but not missing). All alleles other than a
can be grouped because onlyaappears in the index’s geno- varieties. One to two and occasionally three grandparent varie-ties of several of the index varievarie-ties were also included in the type. For example,xxmight bebcorbdorbb.
P(SSR|i,j) is the probability of observing the index assuming data set. These varieties collectively represent a broad array of diversity of soybean germplasm that is currently grown in inbredsiandj are ancestors. The calculations for SSRs 1–6
are shown in Table 2, where the four terms in each case are the United States.
Two hundred and thirty-six publicly available soybean SSR in order of possibilities 1, 2, 3, and 4 defined in the previous
paragraph. Missing alleles are not considered in the examples markers (http://soybase.agron.iastate.edu/) were used to dem-onstrate and evaluate the algorithm. These SSR markers were above. The number of possibilities is large. Here we consider
only the case in which inbrediisaaand both alleles of inbred selected following initial screens on a subset of 24 soybean varieties in which they were tested for amplification and the
TABLE 2
Probability of observing the index [P(SSR|i,j)] assuming inbredsiandjare ancestors: calculations for SSRs 1–6
SSR P(SSR|i,j)
1 p2(4/4)⫹p(1⫺p)(1/2⫹1/n⫻1/2)⫹p(1⫺p)(1/2⫹1/n⫻1/2)⫹(1⫺p)2(1/n)
2 p2(3/4)⫹p(1⫺p)(1/2⫹1/n⫻1/2)⫹p(1⫺p)(1/2⫻1/2⫹1/n⫻1/2)⫹(1⫺p)2(1/n)
3 p2(2/4)⫹p(1⫺p)(1/2⫹1/n⫻1/2)⫹p(1⫺p)(1/n⫻1/2)⫹(1⫺p)2(1/n)
4 p2(2/4)⫹p(1⫺p)(1/2⫻1/2⫹1/n⫻1/2)⫹p(1⫺p)(1/2⫻1/2⫹1/n⫻1/2)⫹(1⫺p)2(1/n)
5 p2(1/4)⫹p(1⫺p)(1/2⫻1/2⫹1/n⫻1/2)⫹p(1⫺p)(1/n⫻1/2)⫹(1⫺p)2(1/n)
6 p2(0/4)⫹p(1⫺p)(1/n⫻1/2)⫹p(1⫺p)(1/n⫻1/2)⫹(1⫺p)2(1/n)
The four terms in each case are in order of the four possibilities when inbredsiandj are ancestors: (1) the alleles of bothiand jwere passed to the intermediate hybrid, (2)icame through but notj, (3)jcame through but noti, and (4) neither came through. Missing alleles are not considered.
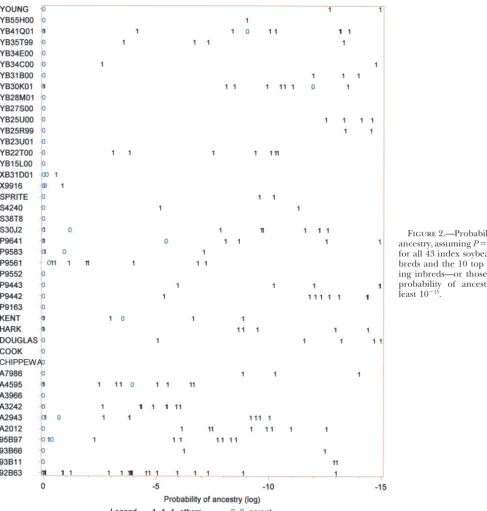
ability to detect polymorphism. The 236 markers gave good ties using data from 236 marker loci at P ⫽ 0.50 genome coverage and collectively mapped across each of the (Figure 1) and atP⫽ 0.99 (Figure 2).
chromosomal linkage groups of soybean.
When the algorithm was used at P ⫽ 0.5 with data
All allele scores were made without knowing the identities
from all 236 loci (Figure 1), 24/43 (56%) of index
of the soybean genotypes:Maize SSR data using 70 loci were
varieties had both parents correctly identified in the
previously reported bySenioret al. (1998) and were obtained
directly from the first author.Senioret al. (1998) cite an array top two ranked positions, 12/43 (28%) had one parent
of 94 historically important publicly bred lines that have well- correctly placed in one of the top two positions, and known and well-established pedigrees. This array of public
7/43 (16%) had none of the actual parents assigned
inbreds includes seven inbreds (A632, A634, Mo17, Pa91,
into the top two ranked positions. Thus, whenP⫽0.5
Va35, Va99, and W64A) that each have SSR profiles for their
was used, 60/86 (70%) of actual parental varieties were
parental lines included in the same data set. Three of these
inbreds were developed from a breeding cross of two unrelated correctly ranked in the top two positions and 26/86
parents. These are Mo17, which was bred from the cross of C.I. (30%) were incorrectly placed in lower positions. 187-2⫻C103; Va99, which was bred from the cross Oh07B⫻ When the algorithm was used at
P⫽ 0.75 with data
Pa91; and W64A, which was bred from the cross of WF9⫻
from all 236 loci (data not shown), 28/43 (65%) of
C.I. 187-2. Other inbred progeny had more complex
pedi-index varieties had both parents correctly identified in
grees. One inbred (Va35) was bred from the cross C103⫻
T8 following an additional cross of T8 as the recurrent parent. the top two ranked positions, 11/43 (26%) had one
Two inbreds (A632 and A634) were bred from the cross parent correctly placed in one of the top two positions, Mt42⫻B14 following additional crosses of B14 as the recur- and 4/43 (9%) had none of the actual parents assigned rent parent. Pa91 was bred from a complex cross involving
into the top two ranked positions. Therefore, whenP⫽
four inbreds [(WF9⫻Oh40B) and (38-11⫻L317)]. These
0.75 was used, 67/86 (78%) of the actual parental
varie-seven progeny inbreds therefore provided an index set of
ties were correctly ranked in the top two positions and
maize inbreds for evaluation of the inbred algorithm.
19/86 (22%) were incorrectly placed in lower positions. When the algorithm was used at P⫽ 0.99 with data from all 236 loci (Figure 2), then 33/43 (77%) of actual
RESULTS
parental varieties were correctly ranked in the top two Data quality: The soybean SSR data that were used positions and 10/86 (23%) had one parent correctly to evaluate the algorithm had a mean of 5.5% (range placed; all index varieties had at least one parent ranked 0–19% loci) missing data per variety. For parent-prog- in the top two positions when the algorithm was used eny triplets, there was a mean of 1.1% loci (range 0–5%) atP⫽0.99. WithPused at 0.99, then 76/86 (88%) of where a progeny profile was scored for an allele that actual parental varieties were correctly assigned; 10/86 was not represented by either of the seed sources that (12%) were incorrectly assigned.
varie-Figure1.—Probability of ancestry, assumingP⫽0.50, for all 43 index soybean in-breds and the 10 top rank-ing inbreds—or those with probability of ancestry at least 10⫺15.
the pedigree was being tested. Other categories (per- ceived from the laboratory, in terms of missing data and apparently non-Mendelian parent-progeny triplets, has centage of cases in parentheses) were multiple
back-cross versions of the misplaced parent (7%), a derivative already been presented. Taking these data as an initial starting point, additional levels of missing and mistyped of the variety for which the pedigree was being tested
(7%), a half-sib of the true but lower-ranked parent data were created by simulations and used to explore robustness of the algorithm.
(7%), a full-sib of the variety for which the pedigree
was being tested (3%), and a half-sib of the variety for SSR data for five index soybean varieties were used to determine the robustness of the algorithm. Subsets of which the pedigree was being tested (3%). Insufficiently
detailed pedigree information is available to categorize data were created that included parameters of reduced numbers of loci, additional levels of missing data, addi-one variety (3% of cases) that ranked above the true parent.
Figure2.—Probability of ancestry, assumingP⫽0.99, for all 43 index soybean in-breds and the 10 top rank-ing inbreds—or those with probability of ancestry at least 10⫺15.
of these parameters. Simulated levels of missing and tion of varieties therefore provides a means to establish lower boundaries for both the quantity and the quality mistyped data were created with a first pass creating
missing data, followed by a second pass creating mis- of SSR data that are required to avoid aberrant results. Table 4 presents the probability of ancestry of the top typed data. Therefore, for example, the maximum level
of cumulative error from simulated missing and mis- five ranked varieties for each of five selected soybean index varieties (93B11, A7986, P9443, S38T8, and typed data was from 36 to 40%. Five varieties were
chosen to represent a range of diversity in respect to Young) when the algorithm is run using different num-bers of SSR marker loci (50, 100, 150, and 236) at each both pedigree and SSR profiles. Four varieties had no
parents or grandparents in common and one pair of of two levels ofP (0.5 and 0.99). Using P ⫽ 0.5, the lowest percentage of parents (60%) that were correctly varieties was related by a common parent. All varieties
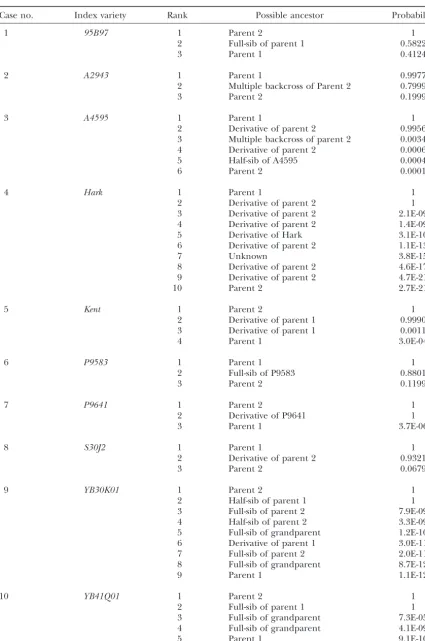
selec-TABLE 3
Probabilities of ancestry and pedigree relationships for soybean varieties where both parents did not rank above nonparents
Case no. Index variety Rank Possible ancestor Probability
1 95B97 1 Parent 2 1
2 Full-sib of parent 1 0.5822
3 Parent 1 0.4124
2 A2943 1 Parent 1 0.9977
2 Multiple backcross of Parent 2 0.7999
3 Parent 2 0.1999
3 A4595 1 Parent 1 1
2 Derivative of parent 2 0.9956
3 Multiple backcross of parent 2 0.0034
4 Derivative of parent 2 0.0006
5 Half-sib of A4595 0.0004
6 Parent 2 0.0001
4 Hark 1 Parent 1 1
2 Derivative of parent 2 1
3 Derivative of parent 2 2.1E-09
4 Derivative of parent 2 1.4E-09
5 Derivative of Hark 3.1E-10
6 Derivative of parent 2 1.1E-13
7 Unknown 3.8E-15
8 Derivative of parent 2 4.6E-17
9 Derivative of parent 2 4.7E-21
10 Parent 2 2.7E-21
5 Kent 1 Parent 2 1
2 Derivative of parent 1 0.9990
3 Derivative of parent 1 0.0011
4 Parent 1 3.0E-04
6 P9583 1 Parent 1 1
2 Full-sib of P9583 0.8801
3 Parent 2 0.1199
7 P9641 1 Parent 2 1
2 Derivative of P9641 1
3 Parent 1 3.7E-06
8 S30J2 1 Parent 1 1
2 Derivative of parent 2 0.9321
3 Parent 2 0.0679
9 YB30K01 1 Parent 2 1
2 Half-sib of parent 1 1
3 Full-sib of parent 2 7.9E-09
4 Half-sib of parent 2 3.3E-09
5 Full-sib of grandparent 1.2E-10
6 Derivative of parent 1 3.0E-11
7 Full-sib of parent 2 2.0E-11
8 Full-sib of grandparent 8.7E-12
9 Parent 1 1.1E-12
10 YB41Q01 1 Parent 2 1
2 Full-sib of parent 1 1
3 Full-sib of grandparent 7.3E-05
4 Full-sib of grandparent 4.1E-09
5 Parent 1 9.1E-10
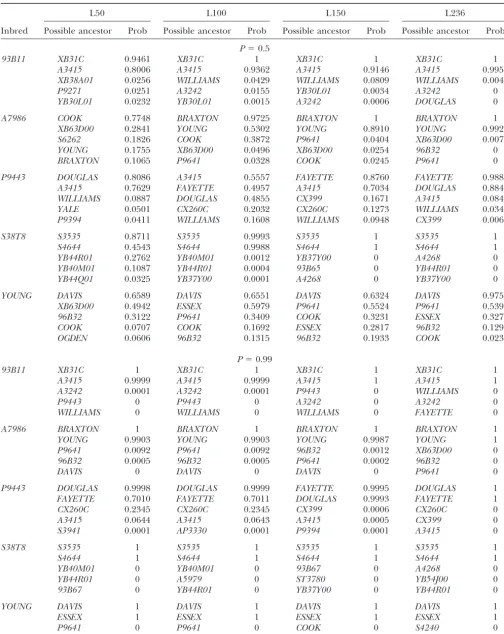
TABLE 4
Probability of ancestry for five individual soybean varieties using SSR data obtained from different numbers of loci (50, 100, 150, and 236)
L50 L100 L150 L236
Inbred Possible ancestor Prob Possible ancestor Prob Possible ancestor Prob Possible ancestor Prob
P⫽0.5
93B11 XB31C 0.9461 XB31C 1 XB31C 1 XB31C 1
A3415 0.8006 A3415 0.9362 A3415 0.9146 A3415 0.9954
XB38A01 0.0256 WILLIAMS 0.0429 WILLIAMS 0.0809 WILLIAMS 0.0046
P9271 0.0251 A3242 0.0155 YB30L01 0.0034 A3242 0
YB30L01 0.0232 YB30L01 0.0015 A3242 0.0006 DOUGLAS 0
A7986 COOK 0.7748 BRAXTON 0.9725 BRAXTON 1 BRAXTON 1
XB63D00 0.2841 YOUNG 0.5302 YOUNG 0.8910 YOUNG 0.9929
S6262 0.1826 COOK 0.3872 P9641 0.0404 XB63D00 0.0071
YOUNG 0.1755 XB63D00 0.0496 XB63D00 0.0254 96B32 0
BRAXTON 0.1065 P9641 0.0328 COOK 0.0245 P9641 0
P9443 DOUGLAS 0.8086 A3415 0.5557 FAYETTE 0.8760 FAYETTE 0.9885
A3415 0.7629 FAYETTE 0.4957 A3415 0.7034 DOUGLAS 0.8847
WILLIAMS 0.0887 DOUGLAS 0.4855 CX399 0.1671 A3415 0.0846
YALE 0.0501 CX260C 0.2032 CX260C 0.1273 WILLIAMS 0.0348
P9394 0.0411 WILLIAMS 0.1608 WILLIAMS 0.0948 CX399 0.0062
S38T8 S3535 0.8711 S3535 0.9993 S3535 1 S3535 1
S4644 0.4543 S4644 0.9988 S4644 1 S4644 1
YB44R01 0.2762 YB40M01 0.0012 YB37Y00 0 A4268 0
YB40M01 0.1087 YB44R01 0.0004 93B65 0 YB44R01 0
YB44Q01 0.0325 YB37Y00 0.0001 A4268 0 YB37Y00 0
YOUNG DAVIS 0.6589 DAVIS 0.6551 DAVIS 0.6324 DAVIS 0.9752
XB63D00 0.4942 ESSEX 0.5979 P9641 0.5524 P9641 0.5397
96B32 0.3122 P9641 0.3409 COOK 0.3231 ESSEX 0.3273
COOK 0.0707 COOK 0.1692 ESSEX 0.2817 96B32 0.1299
OGDEN 0.0606 96B32 0.1315 96B32 0.1933 COOK 0.0235
P⫽0.99
93B11 XB31C 1 XB31C 1 XB31C 1 XB31C 1
A3415 0.9999 A3415 0.9999 A3415 1 A3415 1
A3242 0.0001 A3242 0.0001 P9443 0 WILLIAMS 0
P9443 0 P9443 0 A3242 0 A3242 0
WILLIAMS 0 WILLIAMS 0 WILLIAMS 0 FAYETTE 0
A7986 BRAXTON 1 BRAXTON 1 BRAXTON 1 BRAXTON 1
YOUNG 0.9903 YOUNG 0.9903 YOUNG 0.9987 YOUNG 1
P9641 0.0092 P9641 0.0092 96B32 0.0012 XB63D00 0
96B32 0.0005 96B32 0.0005 P9641 0.0002 96B32 0
DAVIS 0 DAVIS 0 DAVIS 0 P9641 0
P9443 DOUGLAS 0.9998 DOUGLAS 0.9999 FAYETTE 0.9995 DOUGLAS 1
FAYETTE 0.7010 FAYETTE 0.7011 DOUGLAS 0.9993 FAYETTE 1
CX260C 0.2345 CX260C 0.2345 CX399 0.0006 CX260C 0
A3415 0.0644 A3415 0.0643 A3415 0.0005 CX399 0
S3941 0.0001 AP3330 0.0001 P9394 0.0001 A3415 0
S38T8 S3535 1 S3535 1 S3535 1 S3535 1
S4644 1 S4644 1 S4644 1 S4644 1
YB40M01 0 YB40M01 0 93B67 0 A4268 0
YB44R01 0 A5979 0 ST3780 0 YB54J00 0
93B67 0 YB44R01 0 YB37Y00 0 YB44R01 0
YOUNG DAVIS 1 DAVIS 1 DAVIS 1 DAVIS 1
ESSEX 1 ESSEX 1 ESSEX 1 ESSEX 1
P9641 0 P9641 0 COOK 0 S4240 0
A6785 0 A6785 0 P9641 0 P9641 0
TABLE 5
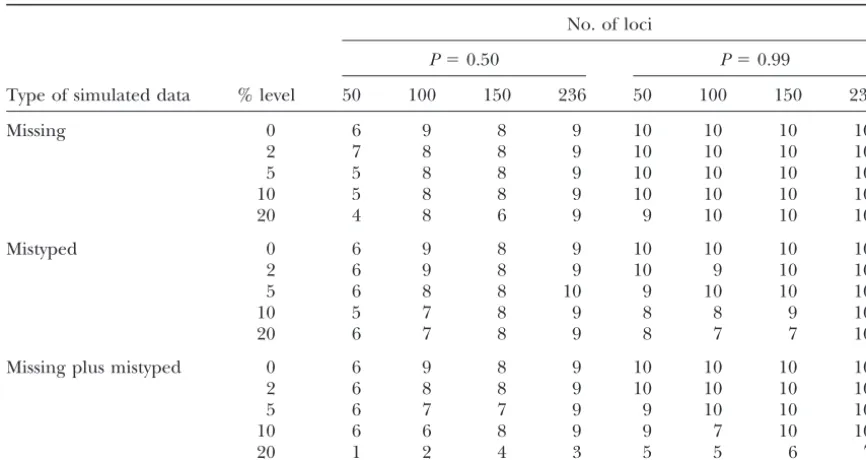
Number of parents ranked in first and second positions (maximum is 10) as additional levels of simulated missing, mistyped, and missing plus mistyped data are applied
No. of loci
P⫽0.50 P⫽0.99
Type of simulated data % level 50 100 150 236 50 100 150 236
Missing 0 6 9 8 9 10 10 10 10
2 7 8 8 9 10 10 10 10
5 5 8 8 9 10 10 10 10
10 5 8 8 9 10 10 10 10
20 4 8 6 9 9 10 10 10
Mistyped 0 6 9 8 9 10 10 10 10
2 6 9 8 9 10 9 10 10
5 6 8 8 10 9 10 10 10
10 5 7 8 9 8 8 9 10
20 6 7 8 9 8 7 7 10
Missing plus mistyped 0 6 9 8 9 10 10 10 10
2 6 8 8 9 10 10 10 10
5 6 7 7 9 9 10 10 10
10 6 6 8 9 9 7 10 10
20 1 2 4 3 5 5 6 7
For missing plus mistyped data the total level of additional incorrect data approaches twice the stated percentage of each category. The five varieties considered are the same as those presented in Table 4 and are cited in the text.
150 or 236 increased the ability to identify the actual rithm was applied with 10% additional mistyped data when data from 150 or fewer SSR loci were used. How-parents to ⵑ90%. When P was used at a level of 0.99
all parents were correctly ranked into the top two posi- ever, robustness was maintained for up to 20% addi-tional mistyped data when data from 236 SSR loci were tions for each of the five varieties when data from as
few as 50 SSR loci were used. used. When additional levels of both incorrect data were applied, robustness was maintained at levels of up to Table 5 summarizes other aspects of robustness. Namely,
we simulated additional levels of missing, mistyped, and 10% missing plus 10% mistyped data so long as data from at least 150 SSR loci were used. Robustness was missing plus mistyped data, beyond those that were
in-herent in the data as provided by the laboratory. When compromised when additional simulations of 20% miss-ing plus 20% mistyped data were applied, even when P was used at a level of 0.5, robustness was generally
maintained up to an additional level of 20% simulated data from all 236 SSR loci were used.
We then investigated the relationships of varieties to missing data, so long as data from 100 or more loci were
used. Similarly, robustness was maintained for up to the index genotype whose pedigree was under examina-tion by rerunning the analysis after both parents of the 20% additional mistyped data so long as data from 100
or more loci were used. Likewise, robustness was main- index genotype had been removed from the analysis. Fifteen varieties that had two or more of their grandpar-tained with up to 18–20% additional levels of data error
including both missing and mistyped data, so long as ents profiled in the data set were used for this examina-tion. After removing parents, direct pedigreed deriva-data from 150 or more loci were used. Using deriva-data for
all 236 loci provided a higher level of robustness, but tives of the index genotype ranked first for P9583, in the first three places for A2943, and in the first six places even then robustness collapsed when 36–40%
cumula-tive additional error from missing and mistyped data for P9561. Once all parents and derivatives of the index genotype had been removed from the analysis, the fol-were simulated into the analysis. The overall level of
correct assignation of parent varieties was higher when lowing results were obtained. Predominant classes of varieties ranking in the top five positions were the follow-Pwas used at a level of 0.99. All parents then were
cor-rectly identified, even when data from only 50 loci were ing (percentage of cases in parentheses): derivatives of the grandparent of the index variety (32%), grandpar-used up to an additional level of 10% missing data.
When data from 100 or more loci were used, all parents ents of the index variety (16%), derivatives of the parents of the index variety (16%), and half-sibs of the index were correctly identified with up to 20% additional
TABLE 6
Ranking and probabilities of ancestry for maize inbred lines for each of seven progeny at P⫽0.50 andP⫽0.99
P⫽0.50 P⫽0.99
Pedigree type Index inbred Ranking Possible ancestor Prob Possible ancestor Prob
Single cross MO17 1 CI187-2a 0.9999 CI187-2a 1
2 C103a 0.9847 C103a 1
3 VA59 0.0090 VA59 0
4 NC258 0.0059 NC258 0
5 C123 0.0003 C123 0
VA99 1 PA91a 0.9999 PA91a 1
2 OH07Ba 0.5221 OH07Ba 0.9855
3 VA22 0.4252 VA22 0.0131
4 NC268 0.0085 B73 0.0007
5 R177 0.0069 B14A 0.0005
W64A 1 WF9a 1 WF9a 1
2 CI187-2a 0.9965 CI187-2a 1
3 OS420 0.0015 OS420 0
4 GT112 0.0005 GT112 0
5 N28(HT) 0.0003 D940Y 0
Backcross A632 1 B14Ab 0.8222 B14Ab 1
2 A634 0.6183 MT42a 1
3 A635 0.5284 A635 0
4 CM105 0.0117 A634 0
5 B68 0.0089 N28(HT) 0
A634 1 B14Ab 0.9351 B14Ab 0.9795
2 A632 0.7960 B52 0.7682
3 B68 0.1432 MT42a 0.1827
4 A635 0.0677 A632 0.0335
5 CM105 0.0328 B68 0.0205
VA35 1 T8b 1 T8b 1
2 VA59 0.9832 VA59 1
3 VA102 0.0130 NC258 0
4 VA22 0.0026 N28(HT) 0
5 NC258 0.0004 VA22 0
Four-way cross PA91 1 VA99 0.9991 VA99 1
2 WF9a 0.3923 W64A 0.7968
3 OH40Ba 0.2391 WF9a 0.0935
4 W64A 0.1328 B2 0.0741
5 H99 0.1315 B77 0.0219
Three types of pedigree were involved in the breeding of these progeny: (1) single cross, (2) backcross or recurrent use of one parent from the original single cross, and (3) a complex four-way cross.
aParents.
bParents used recurrently in a backcross pedigree.
four positions for 10 varieties and were in the first place Probability of ancestry applied to corn data: The seven index inbreds of maize were selected because they for five varieties. Great-grandparents ranked within the
first seven places for three varieties, and a great-great- represented all of the inbred lines published bySenior et al. (1998) that had all of their inbred parents also grandparent ranked in eighth place for one variety.
Other varieties that ranked in the first place were usually included in the SSR data set. All of the inbred lines published bySenioret al. (1998) have well-known and closely related to the variety whose pedigree was under
examination; full-sibs and half-sibs were the predomi- well-established pedigrees that are fully provided by those authors.
nant classes of relatives other than grandparents in the
lines at two levels of P (0.5 and 0.99). For the three tionships are related at the level of half-sib or closer;
ⵑ10% of pairs are related at the level of full-sib or closer. progeny that were bred from single crosses without any
subsequent use of one of the parents to make a recur- This set of soybean varieties therefore provides the basis for an extremely rigorous evaluation of the ability of rent cross prior to inbreeding (Mo17, Va99, and W64A),
use of the algorithm at eitherP ⫽0.5 or P⫽ 0.99 re- SSR data to distinguish between varieties and of this algorithm to identify pedigrees. Pedigree breeding, in-sulted in the parental inbreds being ranked in first and
second positions. Use of the algorithm atP⫽0.99 pro- cluding the use of related parents, is also commonly applied in the breeding of maize inbred lines. The set of vided greater discrimination for probabilities of ancestry
that were assigned to actual parents compared to highest maize inbreds used here thus also provides a meaningful evaluation of the marker data to discriminate among ranking nonparents. This was most noticeable for the
case of inbred Va99, which had a relatively low value inbred lines and of the joint ability of the algorithm and of the marker data to allow a determination of when used atP⫽ 0.5 for parent 2 (0.5221) compared
to parent 1 (0.9999) or to the third-ranked inbred (and inbred pedigrees.
Use of the algorithm at P ⫽ 0.99 rather than at a nonparent), Va22 (0.4252). In contrast, when the
pro-gram was run at P ⫽ 0.99, parents 1 and 2 for Va99 lower level improved performance in terms of the per-centage of correct assignments of parents and provided had probabilities of 1 and 0.9855, respectively, with the
probability of the third-ranked inbred being 0.0131. a greater statistical differential for probabilities for par-ents in comparison to the highest ranking nonparpar-ents. For each of the three progeny inbreds that originated
from breeding schemes that involved one or more addi- Use of the algorithm atP ⫽ 0.99 is more appropriate when it is known that the actual parents of the variety tional crosses of one of their parents, using the
algo-rithm atP⫽0.5 resulted in placement of the respective under examination are included among the set of index varieties. If it is not known that the parents are included recurrent parent with the highest probability of
ances-try. Raising the level ofPto 0.99 resulted in both parents in the index set, use of the algorithm atP⫽0.5 is more justified (Berryet al.2002). For the soybean varieties, (B14 is the recurrent parent and MT42 the
nonrecur-rent panonrecur-rent) of the index inbred A632 being ranked in whenPwas used at 0.99, 77% of all varieties that were queried for their parents had both parents correctly the top two places. Using this level of P also caused a
higher ranking (third position) for the nonrecurrent identified. Eight-eight percent of soybean parents were correctly identified across 43 index varieties that were parent (MT42) of index inbred A634. Use ofPat 0.99
did not cause the nonrecurrent parent (C103) of index queried for their parents. All varieties (with the possible exception of one variety where detailed pedigree infor-inbred (Va35) to rank into the top five places.
For the index inbred (Pa91) that was bred from a mation was not available) that ranked above true parents were related to either the misranked parent or the vari-more complex cross involving four inbred lines, the use
ofPat 0.5 or at 0.99 resulted in the two parents (WF9 ety that was being queried for its pedigree. Our previous report of the use of an algorithm to determine hybrid and Oh40B) being ranked in second and third places;
highest ranked was inbred Va99 (Va99 is derived from pedigrees (Berryet al. 2002) showed a higher level of correct parental determinations at P ⫽ 0.99. Many of the index inbred Pa91). Neither of the two remaining
parents of Pa91 ranked in the top five places. these soybean varieties have a high degree of pedigree relatedness. However, many of the maize inbred lines that were used in the previously reported study (Berry DISCUSSION
et al. 2002) were also highly related. It is, however, likely to be inherently more challenging to correctly identify The current widely used North American soybean
varieties are founded upon a relatively narrow genetic parents following cycles of inbreeding because one-half of the alleles that are segregating in the first generation base of diversity. Gizlice et al. (1994) document that
the U.S. soybean germplasm base is founded upon 20 following the initial breeding cross will be subsequently lost as recurring cycles of self-fertilization occur. Thus, plant introductions and that subsequent breeding has
made repeated use of related parents. Molecular marker many of the alleles that are present in a hybrid and that can therefore contribute to the identification of its comparisons of elite U.S. soybean varieties compared
to a sample of exotic varieties reinforce the conclusion pedigree do not remain present in an inbred homozy-gous progeny.
that there is a relative paucity of genetic variation in
U.S. soybeans.Narvelet al. (2000) have shown that the We examined the pedigrees of soybean index varieties when both parents of the index had been removed from number of alleles detected among the exotics was 30%
greater than that detected among U.S. varieties.Thomp- the set of candidate varieties. Direct pedigree descen-dants with the index variety as one parent usually ranked son and Nelson (1998) report that very little exotic
germplasm has been incorporated into the existing U.S. higher than other varieties, including varieties that were grandparents or sister varieties of the index variety. soybean germplasm base. Examining all pairs of
rela-nant classes of varieties ranking in the top five positions tion of the nonrecurrent inbred to 25%. More genera-tions of backcrossing using the recurrent parent then were derivatives of the grandparent of the index variety
(32%), grandparents of the index variety (16%), deriva- further reduce the expected pedigree contribution of the nonrecurrent parent by half at each generation (suc-tives of the parents of the index variety (16%), and
half-sibs of the index variety (13%). The SSR data that were cessively to 12.5, 6.25, and 3.125%) with the pedigree contribution of the recurrent parent rising accordingly. available to us did not allow a thorough or very precise
assessment of how varieties with different degrees of Since several inbred lines of maize are related by pedi-gree, it is not surprising that the level of pedigree or relatedness would rank as members of the pedigree in
the event that the true parents were not present in SSR similarity of a nonrecurrent parent to the index progeny can fall below other inbred lines that are re-the database. Nonere-theless, when parents were excluded
from the analysis, varieties that were very closely related lated to the index variety. The algorithm was not able to preferentially identify parents of the inbred line Pa91, to the index variety ranked highest. Direct descendants
that were dependent for their pedigree upon the index which was bred from a complex breeding scheme involv-ing four parents with equal contributions by pedigree. variety, if present, tended to rise above varieties that
were included within other classes of pedigree relation- A more suitable algorithm is needed to take account of four-way crosses. However, such a need is primarily aca-ship to the index variety. When varieties directly
de-scended by pedigree from the index variety were also demic because most breeding crosses in commercial maize breeding, and indeed for most crops, are biparental. excluded, a grandparent ranked into first position for
33% of the varieties that were examined. Direct pedi- These soybean data had a mean of 5.5% missing data per variety and a mean of 1.1% loci where a progeny gree derivatives of one or more of the parents of the
index variety had an equal level of occurrence when was scored with an allele that was not also scored in either or both parents. Such apparent non-Mendelian parents and derivatives of the index variety were
ex-cluded. Further investigations of the identification of or exclusionary profiles can be due to pollen contamina-tion during inbreeding, cross-contaminacontamina-tion in the field grandparents will require a data set including all
grand-parents of each index variety and will also require a or laboratory, scoring errors in the laboratory (e.g., scor-ing⫹A, predominant stuttering, spectral pull-up, sec-revised algorithm to take account of pedigree
contribu-tions from four varieties as opposed to pairs of varieties, ondary binding sites, or polymer spikes), or incorrect pedigrees. Another source of apparent exclusion is which forms the basis of the current inbred algorithm.
For the maize inbred line pedigrees, use of the algo- through the use of a seed source as a parent that is still heterogeneous due to inbreeding being incomplete. rithm at either P ⫽ 0.5 or P ⫽ 0.99 resulted in the
correct identification of both parents in all cases where Cycles of inbreeding then continue so that when those seed sources are used in the future as sources for SSR the breeding scheme was an initial cross of two parental
lines followed by subsequent cycles of inbreeding (i.e., profiling to represent the parental genotype they will have lost alleles, due to inbreeding, that have already for the inbreds Mo17, Va99, and W64A). The relatively
high level of robustness for results with maize inbreds been passed on to a progeny. Alternately, residual heter-ozygosity within seed sources can result in low frequen-at P ⫽ 0.5, in contrast to the results obtained from
analyzing soybean data (where 56% of varieties had both cies of heterozygotes or off-type segregants, which may, by chance, be sampled in the progeny, but not sampled parents correctly identified when P ⫽ 0.5 was used),
could be accounted for by the smaller sample size of in the parent. In this study we sampled six plants to represent the variety that may be insufficient to capture maize inbreds and by the lower degree of mean pedigree
relatedness among this selection of inbred lines in com- alleles existing at low frequencies within the seed source. And even if the allele was sampled, it may not have been parison to the soybean varieties. Thus, while several
in-bred lines in this set are closely related, many inin-breds detected following PCR amplification due to predomi-nance of the most frequent allele and allelic competi-that have little or no pedigree relationship remain
(Senioret al.1998). tion effects.Hall (2002) has also reported the occur-rence of apparent nonparental SSR alleles. Mutation The inbred algorithm correctly identified both
par-ents of the three maize index inbreds that had been can also affect SSR profiles. Vigouroux et al. (2002) have estimated mutation rates of 7.7⫻10⫺4per
genera-bred from biparental crosses that involved equal
contri-butions (by pedigree) from both parents. For the three tion for dinucleotide SSRs and an upper 95% confi-dence limit of 5.1⫻ 10⫺5 for SSRs with longer repeat
biparental crosses that involved subsequent additional
crosses of the recurrent parent (and thus significantly units. A level of error or discrepancy in expected SSR profiles is thus inevitable for some, if not all crop plants. biased contributions by pedigree to the index variety
from the recurrent parent), use of the algorithm cor- We therefore evaluated the robustness of the algorithm and data set by rerunning the algorithm using data sets rectly identified each of the recurrent parents. The
algo-rithm was unable to identify the nonrecurrent parent that were simulated to have up to 20% additional levels of missing plus 20% mistyped data beyond the level in most cases, but this result would be expected because
maintained its initial level of robustness with up to an tends well beyond the realm of aberrant or unexpected marker data that is encountered. These types of error additional level of 10% both missing and mistyped data,
or unexpected marker data can include laboratory error, provided data from at least 100 SSR loci were used.
sampling effects, or the use of different seed sources for Fewer loci (60) were capable of retaining this degree of
the actual parental source compared to a more inbred robustness in the evaluation of the hybrid pedigree
algo-source that becomes available later to represent the rithm using maize hybrids (Berryet al. 2002). The loss
parental genotype. This algorithm has application in a of parental alleles that occurs during the inbreeding
number of fields, including conservation biology, popu-process, in contrast to their retention in a hybrid
prog-lation genetics, and to assist in the protection of intellec-eny compared to its parents, probably underlies the
tual property rights. need to use data from a greater number of loci to
main-tain robustness for the inbred algorithm as compared to the hybrid algorithm.
LITERATURE CITED
It was anticipated that determination of pedigrees
Berry, D. A., J. D. Seltzer, C. Xie, D. L. WrightandJ. S. C. Smith,
following cycles of inbreeding might be more
challeng-2002 Assessing probability of ancestry using simple sequence
ing to accomplish than determination of pedigrees of repeat profiles: applications to maize hybrids and inbreds.
Genet-ics161:813–824.
hybrids where the total nuclear genetic contributions
Gizlice, Z., T. E. Carter, Jr. andJ. W. Burton, 1994 Genetic base
of both parents are preserved. Nonetheless, these results
for North American public soybean cultivars released between
show that the algorithm can be used effectively to iden- 1947 and 1988. Crop Sci.34:1143–1151.
Hall, M. A., 2002 Inbred corn plant 01HF13 and seeds thereof.
tify parents of inbred genotypes. Nearly 90% of soybean
Patent no. US 6,353,161 B1. U.S. Patent Office, Washington, DC.
parents were identified. This is a set of genotypes that, Little, R. J. A., and D. B.Rubin, 1987 Statistical Analysis With Missing due to the relatively narrow founder base and sub- Data. John Wiley & Sons, New York.
Narvel, J. M., W. R. Fehr, W.-C. Chu, D. GrantandR. C.
Shoe-sequent cycles of development through the use of
re-maker, 2000 Simple sequence repeat diversity among soybean
lated crosses, provides an extremely rigorous test of plant introductions and elite genotypes. Crop Sci.40:1452–1458.
Senior, M. L., J. P. Murphy, M. M. GoodmanandC. W. Stuber,
the algorithm and of the discriminatory power of the
1998 Utility of SSRs for determining genetic similarities and
marker data. Supplementary data also show the capa- relationships in maize using an agarose gel system. Crop Sci.38: bility of the algorithm to identify parents of maize in- 1088–1098.
Thompson, J. A., andR. L. Nelson, 1998 Utilisation of diverse
germ-breds that have been developed in a pedigree system
plasm for soybean yield improvement. Crop Sci.38:1362–1368.
using two parents. Use of this algorithm with currently Vigouroux, Y., J. S. Jaqueth, Y. Matsuoka, O. S. Smith, W. D.
Beaviset al., 2002 Rate and pattern of mutation at microsatellite
available codominantly expressed molecular marker data
loci in maize. Mol. Biol. Evol.19:1251–1260.
has also been shown to have practical feasibility because