Sequence-Dependent Gene Conversion: Can Duplicated Genes
Diverge Fast Enough to Escape Conversion?
J.
Bruce Walsh
Department of Ecology a n d Evolutionary Biology, University of Arizona, Tucson, Arizona 86721 Manuscript received May 2 2 , 1987
Revised copy accepted July 1 1, 1987
ABSTRACT
Conversion between duplicated genes limits their independent evolution. Models in which conver- sion frequencies decrease as genes diverge are examined to determine conditions underwhich genes can “escape” further conversion and hence escape from a gene family. A review of results from various recombination systems suggests two classes of sequence-dependence models: (1) the “k-hit” model in which conversion is completely inactivated by a few (k) mutational events, such as the insertion of a mobile element, and ( 2 ) more general models where conversion frequency gradually declines as genes diverge through the accumulation of point mutants. Exact analysis of the k-hit model is given and an approximate analysis of a more general sequence-dependent model is developed and verified by computer simulation. If p is the per nucleotide mutation rate, then neutral duplicated genes diverging through point mutants are likely to escape conversion provided 2p/X >> 0.1, where X is the conversion rate between identical genes. If 2r/X
<<
0.1, the expected number of conversions before escape increases exponentially so that, for biological purposes, the genes never escape conver- sion. For single mutational events sufficient to block further conversions, occurring at rate v per copy per generation, many conversions are expected if 2v/X << 1, while the genes essentially evolve independently if 2v/X >> 1. Implications of these results for both models of concerted evolution and the evolution of new gene functions via gene duplication are discussed.ULTIGENE families are common, if not ubiq-
M
uitous, features of eukaryotic genomes. Se-quence exchange processes, such as gene conversion, act to homogenize these families so that individual members are not evolving independently. I t is un- clear, however, as to how long any given member remains part of a gene family due to gene conversion with other family members. One might imagine that, as genes diverge, the probability of conversion de- creases, raising the possibility that duplicated genes may “escape” from conversion.
Besides implications for the structure of multigene families, sequence-dependent gene conversion models have potentially important implications in the forma- tion of new gene functions following a gene duplica- tion. Evolution of new functions via gene duplication is an important concept (e.g., BRIDGES 1935, MULLER
1936, OHNO 1970), but raises several questions. Clearly, some amount of functional divergence must occur between the duplicated copies in order for each to be maintained by selection. Gene conversion may sufficiently retard divergence of duplicated genes to place a major constraint on the rate of new gene formation.
Here we explore the consequences of sequence- dependent gene conversion, focusing on the expected
This paper is dedicated t o the memory of Larry Sandler.
Genetics 117: 543-557 (November, 1987)
number of conversions between a pair of duplicated genes before they diverge sufficiently to avoid further conversions.
MOLECULAR DATA ON SEQUENCE-DEPENDENT CONVERSION
Information on the sequence-dependence of con- version comes from three separate sets of data. T h e most direct are those few studies of conversion be- tween duplicated genes, while less direct information comes from systems examining conversion between different aileles at the same locus and sequence simi- larity requirements for homologous recombination. Current molecular models (HOLLIDAY 1964; MESEL-
SON and RADDING 1975; SZOSTAK et al. 19%3) posit that conversion between alleles and reciprocal recom- bination are both manifestations of the same phenom- ena. It is unclear if these conversion models a r e rea- sonable for events occurring between duplicated genes (FINK and PETES 1984). Often conversions be- tween duplicated genes occurs in the absence of recip- rocal recombination (KLEIN and PETES 198 1 , KLEIN
1984; KLAR and STRATHERN 1984; JACKSON and FINK 1985, JINKS-ROBERTSON and PETES 1985), but there are exceptions ( LISKAY, STACHELEK and LETSOU
genes may be byproducts of processes aligning ho- mologous chromosomes during meiosis (SMITHIES and POWERS 1985; POWERS and SMITHIES 1986). Until the biochemistry of conversion between duplicated genes is better understood, inferences based on conversion between alleles at the same locus, or on homologous recombination, should be viewed as tentative.
T h e dependence of conversion frequency on amount of sequence similarity potentially acts at (at least) two stages: conversion initiation and the subse- quent elongation of conversion tracts. We examine these separately below.
Initiation of conversions: Several different systems examining homologous recombination and gene con- version suggest that recombination events likely initi- ate at, or near, special sites (reviewed in STAHL 1979; WHITEHOUSE 1982; SZOSTAK et al. 1983). If special sites are required for the initiation of conversion, mutational events removing such sites inactivate con- version. T h e 8 base pair (bp) Chi recombination initi- ation sequence in prokaryotes can be inactivated by single base pair changes (SMITH 1983). Likewise, a single point mutation in a conserved 6-bp sequence greatly reduces recombination during pneumococcal transformation (LEFEVRE et al. 1984). Chi-like se- quences have been found in eukaryotic systems (KEN- TER and BIRSHTEIN 198 l), and less well characterized hotspots for homologous recombination are known for lower eukaryotes (KEIL and ROEDER 1984; VOELKEL-MEIMAN, KEIL and ROEDER 1987) and mam- mals ( JEFFREYS, WILSON and THEIN 1985; STEINMETZ, STEPHAN and LINDAHL 1986; STEINMETZ, UEMATSU and LINDAHL 1987). Fungal data on conversion be- tween alleles at homologous loci (reviewed in MARK- HAM and WHITEHOUSE 1982; WHITEHOUSE 1982, 1983; SZOSTAK et al. 1983) also suggest that conver- sion often (perhaps always) initiates at or near special sites, and proceeds in a polar direction from these sites.
There is suggestive evidence that conversion be- tween duplicated loci may also initiate at specific sites. Intrachromosomal conversion resulting in mating type switching in yeast is initiated by a double-strand cut at a defined site (KOSTRIKEN et al. 1983; EGEL, BEACH and KLAR 1984). HESS, SCHMID and SHEN (1 984) observed a gradient in sequence divergence in the human a 1 -a2 globin duplication unit, reminiscent of gradients in conversion between alleles in fungal systems, presumably caused by initiation at a defined site followed by polarity in heteroduplex migration. Stretches of (TG), are highly correlated with conver- sions between primate G, and A , genes (SLIGHTOM, BLECHL and SMITHIES 1980; SLIGHTOM et al. 1985), although conversions can occur away from these se- quences. Sequences with the potential to form Z-DNA (such as (TG),) have been suggested by a number of
workers to greatly faculate recombination. Homolo- gous pairing in vitro by Ustilao Recl protein (a eukar- yotic analogue to RecA) is greatly promoted by Z-DNA (KMIEC, ANGELIDES and HOLLOMAN 1985; KMIEC and HOLLOMAN 1986). Palindromic sequences are associ- ated with sites of conversion between immunoglobulin VH genes (KRAWINKEL, ZOEBELEIN and BOTHWELL 1986), suggesting that other types of DNA structures may also faculate conversions between duplications. Finally, transcription may faculate recombination, possibly by providing a more open chromatin struc- ture (BLACKWELL et al. 1986). T h e most direct ex- ample of this is the HOT1 recombination-stimulator sequence in yeast, which has recently been shown to correspond to polymerase I transcription regulatory sequences (VOELKEL-MEIMAN, KEIL and ROEDER, 1987).
T h e picture that emerges is there may indeed exist certain sites (either precisely defined sequences or more loosely defined structures of DNA), which are either required for conversion initiation, o r at least greatly enhance its rate. If such sites are common and play the dominant role in conversion events between duplicated loci, single mutational events may be suf- ficient to block conversion by altering (or removing) these sites, preventing initiation.
Even if special sites are necessary for conversion initiation, they are probably not sufficient. Current models of conversion require some stabilization of the initiation complex by sequence homology. In single- stranded conversion models (HOLLIDAY 1964; MESEL- SON and RADDING 1975) the invading strand(s) must form a stable heteroduplex, while in double-strand- gap-repair models (SZOSTAK et al. 1983), repair of the gapped duplex requires donor DNA to be stabilized
by flanking regions of homology. This latter require- ment is supported by JASIN et al. (1985), who found that while the introduction of double-stranded gaps into donor plasmids in COS cells promotes homolo-
gous recombination, the highest levels of recombina- tion occurred when gaps are at positions of uninter- rupted homology between donor and target DNAs.
Heteroduplex formation, branch migration and
that length-is also seen in Escherichia coli (WATT et al. 1985; SHEN and HUANG 1986). T h e caveat with these experiments is that blocks of exact homology were used, rather than blocks of less than perfect homology. An unresolved issue is whether the mini- mal length sequence required must have exact ho- mology, or whether imperfect homology is acceptable. T h e limited data for mammalian systems generally support a linear relationship between amount of ho- mology and rate of homologous recombination. AYARES et al. (1 986), studying recombination between plasmids, observed a linear relationship between re- combination frequency and sequence similarity in COS cells, but observed a biphasic curve when using human EJ cells. RUBNITZ and SUBRAMANI (1 984) also found a biphasic curve relating length of sequence homology and recombination. T h e most direct study is that of LISKAY, LETSOU and STACHELEK (1987) who examined sequence requirements for mitotic conver- sions between duplicated genes in mouse L cells, and found an approximate linear decrease in conversion frequency as sequence similarity decreases.
In addition to nonhomologies being introduced by numerous point mutations, deletion and insertion events can produce, in a single event, a large region of nonhomology. The importance of such regions in altering levels of recombination and conversion is unclear. Large blocks of nonhomology can be in- cluded in stable heteroduplexes-LICHTEN and Fox (1 984) recovered phage X heteroduplexes containing insertions/deletions of 700 and 1300 bp. In vitro stud- ies show that RecA can pair DNAs showing limited stretches of homologies, but at a slower rate than regions with perfect homology (GONDA and RADDING
1983; BIANCHI and RADDING 1983). However, several observations suggest that regions of nonhomology can, in some cases, prevent conversion between dupli- cated genes. Three independent studies suggest that insertion of A h elements prevents conversions be- tween duplicated globin genes (HESS et al. 1983; MICHELSON and ORKIN 1983; SCHIMENTI and DUN- CAN 1984). One explanation of this is conversion initiates at (or near) particular sites, conversion tracts proceed outward from these sites in a polar fashion, with heteroduplex migration blocked by the nonho- mology introduced by the insertion. T h e assumed polarity in direction of conversion tracts is consistent with both the finding of a gradient in sequence con- version in between adult globin genes (HESS, SCHMID and SHEN 1984) and the properties of characterized eukaryotic recombination enzymes (Recl from the fungus Ustlago and a recently purified recombinase from human B lymphoblasts) which exhibit polarity in strand displacement (HSIEH, MEYN and CAMERINI- OTHERO 1986; KMIEC and HOLLOMAN 1986).
Small insertions or deletions do not always act as a
barrier to conversion between duplicated genes
(MICHELSON and ORKIN 1983; HILL et al. 1985). Dou- ble-strand gap repair models allow for the removal of blocks of nonhomology before heteroduplex for- mation. BRENNER, SMIGOCK and CAMERINI-OTHERO
(1 986) estimate that human L cells can generate dou- ble stranded gaps of between 150 and 250 bases, allowing for the possibility that regions of nonhomol- ogy this size may not be an important block to con- version.
Another important modeling issue, the average length of a conversion tract, appears to be highly system dependent. LISKAY and STACHELEK (1 986)
found mitotic conversion tracts between 1.2-kb dupli- cated elements could be as long as 360 bases. Conver- sion tracks between duplicated Trypanosoma brucei
VSG genes average about 3.5 kb, but can be much smaller (PAYS et al. 1985). Mammalian globin genes often have conversion tracts in the neighborhood of
1.2-1.5 kb (SLIGHTOM, BLECHL and SMITHIES 1980;
ERHART, SIMONS and WEAVER 1985; SLICHTOM et al. 1985), but a detailed study of the human G , and A ,
fetal globin genes found evidence for numerous very small conversion tracts, often on the order of tens of base pairs, or less (SMITHIES and POWERS 1985; Pow- ERS and SMITHIES 1986). Very short conversion tracts are also seen in chicken Vx genes (1 0-1 20 nucleotides;
REYNAUD et al. 1987), class I MHC genes (10-50
nucleotides; FLAVELL et al. 1986) and class I1 MHC genes ( ~ 2 0 nucleotides; MCINTYRE and SEIDMAN
1984; GORKSI and MACH 1986). It is highly likely that several different pathways produce conversion-like events. T h e very short conversion tracts seen in both globin and immune genes may result from different pathways than the longer conversion tracts seen be- tween other duplicated genes. Indeed, short conver- sion tracts between duplicated immune genes play an important role in generating diversity for the immune response, suggesting that the structure of conversion processes in these regions has been under strong se- lection (BORST and GREAVES 1987). An additional complication is introduced by the finding that the length of a conversion tract may be significantly in- creased by recombination-stimulating sequences (VOELKEL-MEIMAN, KEIL and ROEDER 1987).
“k-HIT” MODELS OF SEQUENCE-DEPENDENT CONVERSION
As discussed above, it may be biologically reasona- ble to suppose that conversion between duplicated genes can be completely stopped by one, or a few, mutational events, such as the insertion of an Alu
element. Here we assume that
k
mutants are sufficient to completely block conversion. Note that these “mu- tants” are generally not point mutants, but rather may be larger events, such as insertions or deletions. T h e effects on conversion rates from the gradual accu- mulation of point mutants are examined in the next section and are ignored here.T h e model follows a single chromosomal lineage through time. At time zero, a gene duplication occurs, with copy number subsequently stable. Intrachromo- soma1 conversion occurs between the two copies, pro- vided that k specified mutational events have not occurred. Each of the
k
mutants occur independently with mutation rate U per generation per gene, imply-ing the waiting time for
k
such mutants to appear follows a gamma distribution with parameters k and2u. If k
-
1 or fewer mutants have occurred, conver- sion occurs at rate Xper
generation, else ifk
or more mutants have occurred since the last conversion event, conversion is completely stopped. When conversion occurs, it homogenizes both copies, and the mutation accumulation process starts over again. Implicit in these assumptions (fork
>
1) is that conversion tracts cover the mutant sites.Let a be the probability that the duplicated pair escapes conversion on a given trail (that is, it accu- mulates
k
mutants before a conversion event occurs). Under the above assumption of restarting after each conversion event, the probability that exactlyi
con- version events occur follows a geometric distribution, and is given by (1-
a)%. Likewise, the expected number of conversions is (1-
T ) / T and the variancein number of conversions is (1
-
T)/T‘.We obtain a as follows: let t be the time until a conversion event occurs (in the absence of mutation) and T the time until k mutants arise (in the absence of
any conversion). Denote
E
= ( I-
T) = Prob(t < T ) ,the probability that a conversion event occurs;
p(t = x) the probability density that t = x; and P(T
>
x) the probability that T>
x. Then,M =
lm
P(t = X)P(T>
X ) d X . ( 1 )t follows an exponential distribution with mean A, and
T follows a gamma distribution with parameters ( k , 2 ~ )
giving:
#+ =
1-
Ae-”lm
[2u/(k-
1)!](2~z)~-’e’””dzdx. ( 2 )IO6
io5
io4
103
loz
10’
loo
10-i
1
o-2
lo-z 10-l loo 10‘ loz
2u/h
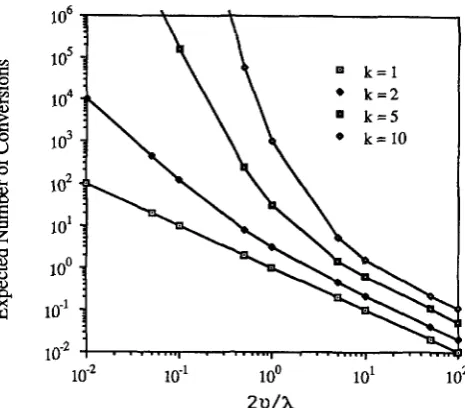
FIGURE 1 .-Expected number of conversions between a pair of duplicated genes, assuming the k-hit model. k is the number of sites which must be mutated, X the conversion rate and U the per site mutation rate.
Changing the order of integration,
P m
.
J,
Xe-”dxdz,giving:
m
E
= [2u/(k-
1 ) ! ] ( 2 ~ z ) ~ - ~ e - ‘ ” ~ ( 1-
e-”)dz,(4)
which simplifies using the gamma function to
,“ = 1
-
[2u/(2u+
X ) ] ka = [ 2 Y / ( 2 U
+
A)]!( 5 )
( 6 ) or,
Let E ( n ) be the expected number of conversions. Recalling E(n) = ( 1
-
*)/a, from (6):E ( n ) = (1
+
( X / 2 u ) ) k-
1 ( 7 4(7b) Since (1
+
x ) ~-
1 = K x+
O(x’), (7) implies few conversions occur if kX/2<
U , while multiple conver-sions occur if kX/2
>
U. This is seen in Figure 1, whichplots E(n) for various values of k and 2u/A. Mitotic conversion rates between mammalian duplicated genes are typically in the range of 1 0-5 to lo-’ (RUB- NITZ and SUBRAMANI 1 9 8 6 ; LISKAY, LETSOU and STACHELEK 1987), while higher rates (both mitotic and meiotic) can occur in fungal systems (JACKSON and FINK 1985; JINKS-ROBERTSON and PETES 1986). If the frequency of inactivating mutational events is comparable to the frequency of point mutants, i.e., 28
=
2 ( 5x
IO-’) (based on substitution rates in pseudo-genes, KIMURA 1983; Lr, Luo and
Wu
1985; however, rates may be higher, e.g., LI and TANIMURA 1987),the expected number of conversions is 2 10 (assuming
k
= 1 and X = If multiple bases/sites each have to be changed by single mutants (i.e.,k
>
l ) , or if conversion rates exceed lom7, the expected number of conversions greatly exceeds this.Another useful measure of constraint is the ex- pected number of generations from the initial dupli- cation until the last conversion event occurs. This is simply E ( n ) E ( T ) , where E ( T ) is the expected time between conversions, conditional on a conversion oc- curring. From the same arguments leading to ( l ) , the density of conditional conversion times is given by
p ( t = x)P(T
>
x ) / X , yielding:Upon evaluation of the inner integral and subsequent use of the gamma function,
(10)
E ( T ) = (l/Z){(l/X)[l
-
(2V/(2V+
-
[ k / ( 2 v+
X)][2v/(2v+
which reduces to
E ( T ) = 1 / X
-
[k/(2v+
X)][n/(l-
741.
( 1 1 )T h e first term in (1 1) is the unconditional mean time, which is an overestimate since we condition on a conversion occurring, resulting in a correction term. T h e expected number of generations at which the last conversion event occurs following the original dupli- cation is then:
E ( n ) E ( T ) = E(n)/X - k/(2v
+
A)
(12 4
= ( I / h ) [ E ( n )
-
k/(1+
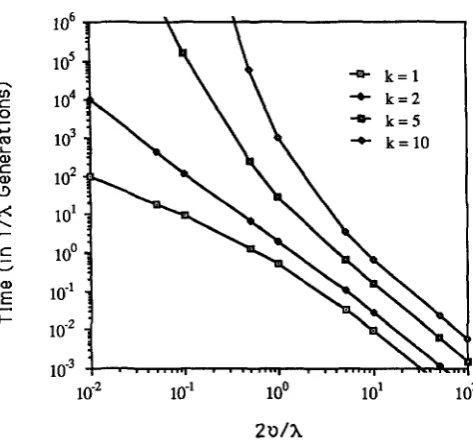
2v/X)]. (12b)Figure 2 plots the expected time constrained in A-'
generations for various values of k and 2v/X. For k =
1 , (12) simplifies to E ( n ) / ( 2 v
+
A)
= (l/X)(8/(l+
8-')),where 8 = X/2v = E(n).
MORE GENERAL SEQUENCE-DEPENDENT CONVERSION FUNCTIONS
Consider the more general situation where the con- version rate between duplicated genes can be written as Xf(x), with x the fraction of sequence similarity
lo6
lo5
lo4
lo3
loz
10'
loo
10-l
1U2
+a- k = l
*
k = 2-0- k = 5
\\
*
k = l O10-l loo 10' lo2
2U/h
FIGURE 2.-Expected time (in 1 /X generations) following the initial gene duplication until the last conversion occurs for the k-hit model.
between the two genes. (Note that this is not the most general formulation-if conversion is strictly depend- ent on the size of blocks of exact homology, knowledge of simply the amount of sequence similarity is insuffi- cient.) Unlike the previous model, conversion is not all or none, rather declines steadily as sequence simi- larity declines. Impose f ( 1 ) = 1 , so that X is the conversion rate between two identical sequences. Clearly, X varies for different duplications, depending on local chromatin configuration, the distance sepa- rating genes, etc.
T h e basic structure of this model is similar to the previous k-hit model: a single chromosome lineage, which underwent a single duplication event at time zero, is followed. Intrachromosomal conversion events are assumed to convert an entire gene, restart- ing the process. As above, this assumption implies the total number of conversions follows a geometric dis- tribution, with parameter P, the probability that the
pair diverges sufficiently on any given trail to avoid further conversions. T o compute T , consider 4(t), the
probability that no conversion occurs in the first t
generations after a duplication (or a conversion event), and define P as the limit of
4(t)
as t-
m. Observe that conversion is a time-dependent Poisson process, with the time-dependent variable being random. Thus,Prob[conversion E (t, t
+
At)I
x t ](13)
= Xf(x,)At
+
o(At).Conditioning on the sample path for xt, we have a standard time-dependent process (COX and MILLER
Prob[no conversion E (0, t , ) I x , for s 5 t ]
(1 4a)
Taking the expectation over all sample baths of the process x, in ( 0 , t ) gives:
(14b) is also the expression for $ ( t ) under the more general formulation, where x, is a markov process describing the divergence of two duplicated genes. This allows for modeling conversion based on the length distribution of blocks of exact homology be- tween two sequences, as well as other general meas- ures of sequence similarity.
Given the approximate linear relationship between rates of homologous recombination and amount of sequence similarity in both prokaryotic and mamma- lian systems, we first consider a linear conversion function:
(15)
f(x) = (x
-
xcrit)/( 1-
xcrit) for x xcrit= 0 for x 5 xCrit
f(
1) = 1 as prescribed, and conversion does not occur when sequences show less than xcrit percent similarity. Another candidate conversion function is a quad- ratic. Our motivation is the observation of AYARES etal. (1986) of a biphasic relationship (a fairly smooth linear decrease changing into a very sharp dropoff) between the frequency of homologous recombination and length of sequence homology in certain mamma- lian cells lines. Consider:
f ( x ) = 1
-
(1-
x ) ~ / ( I-
x,,it)* for x L xCrit(16)
= 0 for x 5 xCrit.
As above, conversion ceases when the genes show less that xc,it percent similarity. Note that (16) falls off more slowly that (1
5),
given the same value for x,,it.A deterministic approximation for U : Our general
expression for T is:
A = X
1
f(xt)dt. (17)T h e expectation in (1
7)
being over all possible paths for the random variable x,, the fraction of identical bases shared by the two duplicated genes at time t. In practice, (17)
is very difficult to evaluate directly, however if a diffusion can be associated with x,, the method of KAC functionals can be used (see the AP- PENDIX). In what follows, we compute T using a de-terministic approximation of (1
7),
which computer simulations show gives excellent results for the forms off@) examined here.T h e deterministic approximation is motivated by considering a long DNA sequence. For such a se-
m
T = E[exp(-A)],
quence, the stochastic process x, is expected to follow fairly closely the deterministic trajectory, given that x, is the average over all bases. For example, consider a gene of length n bases, where each base diverges by an independent, identically distributed process. If
p ,
is the probability a given base (at time t) is identical in the duplicated genes, then E[x,] =p,,
and Var[xt] =p,(
1-
p,)/n. For large n, the variance in the process issmall and paths closely follow the deterministic trajec- tory. We approximate T by exp(-A*), with
m
A* = X f { z ( t ) ) d t (18)
and z ( t ) = E@,), the expected amount of similarity at time t. Thus, we replace the expectation over all sample paths by the integral of the deterministic pro- cess. T h e validity of this approximation, as examined by simulations, is discussed below.
Before proceeding, a technical issue needs to be clarified. Consider the integral in (1
7)
as xt approaches its stationary distribution, x. For any biologically rea- sonable form of mutation, the distribution of x has support on (0, l), and thus has some nonzero proba- bility of being above xC,it, implying that the integral is unbounded, and hence a = 0 (i.e., conversion always occurs). However, the expected waiting time for a conversion once stationarity is approached is likely to be on such a large time scale as to be biologically meaningless. Assuming at equilibrium that all bases are independent and each has probability $4 of show- ing similarity, the DeMoivre-Laplace theorem states that the probability two sequences of length n show more than x,,it similarity is approximately given by the area under a normal distribution above the value 4(x,,it
-
Y4)mFor . n = 1000, and xcriI = 0.4, this probability is approximately 1 O-” (using standard a p proximations for large normal values, ABRAMOWITZ and STEGUN 1964, Eq. 26.2.12).It remains to specify xt, the amount of similarity between two sequences, which were identical at time t = 0. Assuming selection is not acting on either duplicated gene, standard results for divergence of neutral genes (JUKES and CANTOR 1969) give the expected similarity at time t as,
z ( t ) = (l/4)(1
+
3exp(-8t)), (19)where 8 = (4/3)(2p). This assumes that mutation occurs at rate /.t per base per gene, and that each base mutates
to the other three at equal rates.
viewed as highly unlikely (KIMURA 1983), but appar- ent examples are beginning to appear (LEIGH BROWN
1987; HILL and HASTIE 1987).
Consider (1 6), the linear conversion function, first. Under the deterministic process, no conversion oc- curs after xCrit is reached. T h e upper limit of the inte- gral in (18) is given by 7, which satisfies xc,il = (Y4)
(1
+
3exp(-h)). Substitution of (19) into (18), with the integral truncated at 7 gives:(20)
A* = [V(1
-
xcrit)][7('/4-
Xcrit)+
( 3/4)( 1/e)(
1-
exp( -h))].Using 7 = (-1/B)ln[(4/3)(~crit
-
%)I, and the definitionof 8, (20) reduces to
(21) A* = (X/2p)(%)[ 1
+
it
-
'/4)/(1
-
xcrit)ln((4/3)(&rit-
'/4)}].Thus, out deterministic approximation for the linear conversion function (1
5)
is?r = exp(-(X/2p)h(~c,it)},
h(X) = ('/4[ 1
+
[(X-
'/4)/(1-
x)] (22).h~{(~/s)(x
-
'A)}].Proceeding in the same fashion for the quadratic conversion function (1 6) gives:
?r = exp{-(X/2fi)g(xcrit)],
g(X) = (3/4)[1/2
+
(3/4)/(1-
X )-
(1-
(3/4)2/ (23) (1-
~)~)ln((~/3)(x-
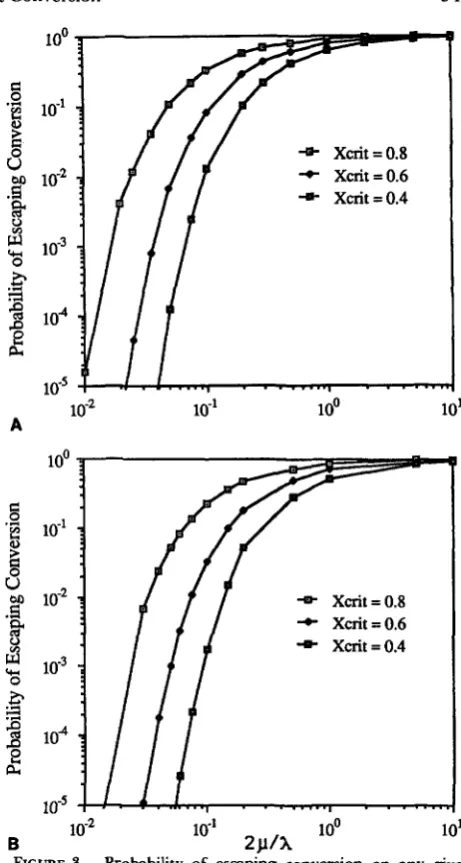
%)I].Figure 3 plots a, the probability of escaping conver- sion, for both the linear and quadratic conversion function, assuming xCrit values of 0.8,0.6 and 0.4. Data are lacking on %,,it values in nature, but they are likely
in this range.
Given ?r, the expected number of conversions is, as
above, (1
-
a)/?r. T h e validity of our deterministic approximation for ?r was checked by comparing theexpected number of conversions using (22) and (23) with the mean number of conversions in a series of simulations, assuming gene sequences of length 100 and 1000. Details of the simulation proceedure are given in the APPENDIX. As seen in Tables 1 and 2, and in Figures
4
and5,
the approximation is excellent. Further, the simulation shows no difference in mean number of conversions for gene sequences of length 100 and 1000 (Figures4B
and5B),
and the variance in number of conversions is also comparable (Tables1 and 2).
Both (22) and (23) demonstrate that ?r depends
strongly on the ratio 2p/X, so that the relevant param- eters to compare are the conversion rate and the per nucleotide mutation rate. Given a per nucleotide mu- tation rate of
5
X lo-' and conversion rates of X =4 Xcrit =0.8
*
Xcrit=O.64- Xcrit = 0 . 4
10-l loo 10'
*
Xcrit=0.8*
Xcrit=0.64 Xcrit=0.4
10'
FIGURE 3.-Probability of escaping conversion on any given trail,
*,
for linear (A) (1 5) and quadratic (B) (16) conversion func- tions, f(x). Sequences showing similarity of x,"~ or less do not undergo conversion, X is the conversion rate between identical sequences and is the per nucleotide mutation rate. Both graphs use the deterministic approximations for r given by (22) and (23) for the linear, and quadratic, conversion functions (respectively).550
TABLE 1
Simulation results for linear conversion function mean number of conversions
X,,ti,l = 0.8 XCr,t,,,l = 0.6 XCritica, = 0.4
2clX n = 1000 n = 100 n = 1000 n = 100 n = 1000 n = 100
0.025 Expected = 81.5
89.8 63.4
(7.7 x io4)
0.05 Expected = 8.08
10.7 7.98
(144) (62.9) (1.5 X IO4)
0.1 Expected = 2.01
1.7 2.6
(4.02) (7.12)
0.5 Expected = 0.25
0.21 0.31
(0.24) (0.45)
1
.o
Expected = 0.120.14 0.13
(0.17) (0.13)
0.016 0.016 (0.016) (0.016) 5.0 Expected = 0.022
Expected = 2.19 X 1 O4
>5000 >5000 Expected = 147 124.4 135.7 (1.4 x io4) (1.5 x io4)
Expected = 1 1.1
11.5 10.9
(93.2) ( 162) Expected = 0.65
0.62 0.64
(0.76) (1.10)
Expected = 0.28
0.44 0.28
(0.49) (0.34)
Expected = 0.051 0.056 0.060 (0.05 3) (0.056)
Expected = 6.12 X lo’ >5000 >5000
Expected = 7.82 X lo3 >5000 >5000
Expected = 87.5
89.1 74.6
(4.5 x 10³) (6.8 X 10’)
Expected = 1.45
1.52 1.30
(5.25) (2.97)
Expected = 0.57
0.53 0.53
(0.87) (0.98)
0.088 0.120 (0.080) (0.162)
Expected = 0.094
Number of conversions before duplicated genes diverge sufficiently to avoid further conversions, assuming a linear conversion function forfix) (15). Expected number of conversions is the deterministic approximation given by (22), while simulation results assume two different gene sizes: 100 and 1000 nucleotides per gene. The variance in number of conversions per trial is given in parenthesis below the mean observed value for each trial. For expected number of conversions >5, 50 trials per parameter set were used, while if C5, 250 trials used. Runs mean denoted by >5000 had most (all) of the trials exceed 5000 conversions (the cutoff point in the simulation program). Further simulation details given in APPENDIX.
TABLE 2
Simulation results for quadratic conversion function mean number of conversions
0.025 Expected = 385
353 178
(1.5 x 10⁵) (1.5 x 10⁴)
0.05 Expected = 18.7
17.4 13.3
(470) ( 199) 0.1 Expected = 3.44
3.20 4.10
(12.1) (28.1)
0.5 Expected = 0.35
0.32 0.34
(0.55) (0.54)
1
.o
Expected = 0.160.2 1 0.18
(0.25) (0.25)
0.028 0.028 (0.0 35) (0.0 2 7) 5.0 Expected = 0.30
Expected = 9.20 X IO5 >5000 >5000
Expected = 958
762 702
(4.1 x 10⁵)
(1.8 x 10³)
(3.9 x 10⁵)
(1.1 x 10³) Expected = 30.0
29.5 31.0
Expected = 0.99 1.07 1
.oo
(1.96) (1.88)
Expected = 0.41
0.49 0.41
(0.61) (0.74)
0.080 0.100 (0.0 8 2) (0.098)
Expected = 0.071
Expected = 1.01 X 10” >5000 >5000
Expected = 3.18 X IO5 >5000 >5000
Expected = 563
645 384
(3.3 x io5) (1.8 x io5)
Expected = 2.55
2.64 2.50
(11.5) (9.40)
Expected = 0.88
0.79 0.99
(1.37) (2.04)
Expected = 0.135 0.156 0.148 (0.172) (0.150)
~~
lo6
lo5 Xcrit=0.8
Xcrit = 0.6
lo4 Xcrit =0.4
lo3
lo2
10'
loo
lo-'
4 X=.8, n=1000
3
lo2*
X=.8,n=100.r( w2 4 X=.6,n=1000
3
*
X=.6,n=100*
X=.4,n=1000U -0- X=.4, n=100
:
i3
10';
ru 0
3
!3
100;z
B
3
10-l:
1
lo-' loo
2p/h
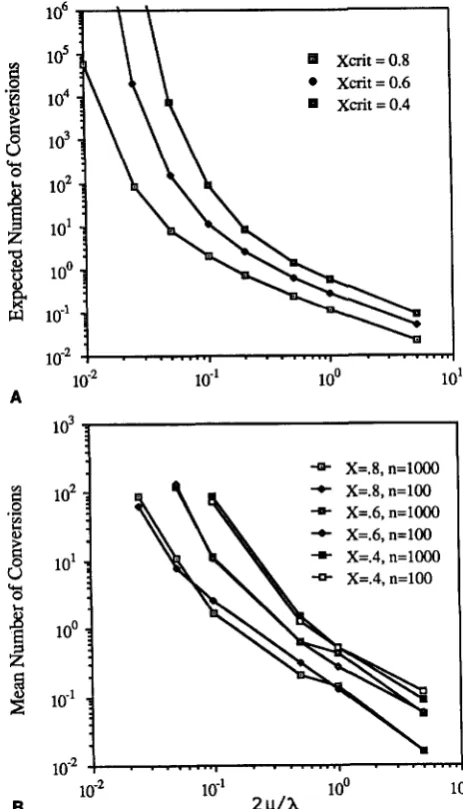
FIGURE 4.-Expected number of conversions between a pair of duplicated genes, assuming a linear conversion function (1 5). X,,, and x both denote the amount of sequence similarity below which conversion does not occur. Predicted results using the deterministic approximation (22) are shown in (A), while (B) plots the mean number of conversions per trail from a simulation assuming a gene size of A = 100 or n = 1000 nucleotides. Note in (B) that the mean number of conversions appears independent of gene size and agrees well with the approximation given by (22). Also see Table 1.
DISCUSSION
Exchange of information between duplicated genes by conversion constrains the independent evolution of each copy, a phenomenon called concerted evolu- tion. T h e amount of similarity between members of multigene families induced by concerted evolution has been the subject of considerable population genetics modeling (reviewed in OHTA 1980, 1983; NAGYLAKI
1984a,b). These models assume conversion rates are independent of the amount of sequence similarity. As a first step toward extension of these models, we examined conditions under which genes can diverge sufficiently to avoid further conversion, effectively removing these copies from the rest of the gene fam-
\ \
*
Xcrit =0.6\ \
4 Xcrit =0.41U2
A 10-l loo 10'
lo3
++ X=.8,n=1000
*
X=.8, n=100lo2 4 X=.6,n=1000
*
X=.6,n=100*
X=.4, n=100010'
*
X=.4,n=100loo
lo-'
B lo-' 2 p / h loo 10'
FIGURE 5.-Expected number of conversions between a pair of duplicated genes, assuming a quadratic conversion function (16).
X,,, and x both denote the amount of sequence similarity below which conversion does not occur. Predicted results using the deter- ministic approximation (23) are graphed in (A), while (B) plots mean number of conversions per trail from a simulation assuming a gene size of A = 100 or A = 1000 nucleotides. Agreement with the approximation is excellent. Also see Table 2.
ily. Our analysis is initially restricted to selectively neutral genes.
Two different classes of sequence-dependence are suggested by a review of the genetic and molecular data on gene conversion. First, a single or a few events may be sufficient to prevent further conversions. This is modeled by the "k-hit" process, wherein conversion occurs at rate X between duplicated genes unless k
mutational events have occurred since the last conver- sion, each mutation occurring with rate U per gene.
(occurring at rate p per base pair per generation), conversion rates also decline. Specifically, conversion occurs at rate Xf(x), where x is the amount of sequence similarity between copies and X is the rate of conver- sion between identical genes. Linear and quadratic forms for f ( x ) were examined. For both classes of models, the probability that no conversions occur, as well as the expected number of conversions, depends critically on the mutation rate to conversion rate ratio (2u/X for the k-hit model, 2p/X for the more general model).
A strong result is obtained from the point mutation model-if 2p/X
>>
0.1, few conversions occur, and the duplicated members essentially evolve independ- ently. If, however, 2p/X<<
0.1, very large numbers of conversions occur and the duplicated copies remain a family. Given p z 5 X lo-’, X>>
lo-’ is sufficient to keep duplicated genes from diverging enough to es- cape conversion, while if X<<
it is highly likely that no conversions occur between duplicated copies. Conversion rates between pairs of linked duplicated mammalian genes are typically in the range of 1 0-7 to 1w5,
suggesting that divergence simply through the accumulation of point mutations is not sufficient to allow linked copies to escape conversion.As a numerical example, consider X = IOw6, and make the conservative choice of a linear conversion function forf(x) (Eq. 15) and a large &,it value-0.8
(i.e., conversions only occur between sequences with more than 80% similarity). For this combination, the expected number of conversions between a duplicated pair before they evolve independently is =6 X lo4. T h e expected number of conversions is much higher if we assume either a quadratic conversion function
(16), or lower xc,it values. If the expected number of conversions is very large, we expect that models for the amount of concerted evolution which assume con- stant conversion rates are likely good approximations. This does not imply that neutral genes cannot es- cape conversion. Unusual events, such as large inser- tions/deletions, insertion of mobile elements, or small deletions in regions critical for conversion, may be sufficient to block further conversions. T h e k-hit model is more appropriate here, and it suggests (as- suming k = 1) that if 2v
>>
A, few conversions occur, while if 2 u<<
A, the genes evolve as a family. Given our almost complete ignorance on the nature of events sufficient to block conversion and the rate at which such events occur, we are currently not in a position to evaluate whether or not selectively neutral dupli- cated genes can escape conversion via this mechanism. Duplications where the new copy is placed on a different chromosome from the original copy have a better chance of escaping conversion that do linked duplicated genes. In addition to a reduction in con- version rates compared with linked copies, the pro-cesses generating duplicate copies on nonhomologous chromosomes may also speed up the divergence pro- cess. Reverse-transcription provides one example of a mechanism for spreading duplicate copies to different chromosomes (for reviews, see BALTIMORE 1985;
TEMIN 1985; VANIN 1985; WALSH 1985). Reverse-
transcription removes introns, which many greatly reduce (or even block) the amount of conversion with the parental gene. Further, processed PolII genes (chromosomally integrated reverse-transcribed mRNAs) are usually nonfunctional, allowing for rapid divergence. However, there are exceptions (SOARES et al. 1985; STEIN et al. 1983; LEWIS and COWAN 1986; MCCARREY and THOMAS 1987), and the suggestion has been made that reverse-transcription of an illegit- imate Pol111 transcript which spans a PolII gene can result in the new copy being functional (VANIN 1985; SOARES et al. 1985). Such a process may be important in the evolution of new gene functions, by placing genes in potentially new regulatory regions.
Caveats and directions for extension: It is impor-
tant to reiterate the tentative nature of our models relating conversion rates and sequence similarity. Most experiments examining sequence requirements looked at either homologous recombination or con- version between alleles at identical positions on ho- mologous chromosomes. Given the uncertain connec- tion between homologous recombination/conversion
at single loci and conversion between different loci, these results may be misleading. A further caution is that even in those few experiments using duplicated genes, blocks of exact homology were used, and con- version as a function of the total length of exact homology was examined. If blocks of exact homology, rather than regions of high (but not perfect) homol- ogy, are required for conversion, modeling conver- sion as a function of the fraction of sequence similarity may give misleading results.
A key assumption in our models is that conversion covers an entire gene and the amount of homology in that region, and not elsewhere, sets conversion rates. This allows us to use a, the probability that no con- versions occur following a new duplication, to obtain the expected number of conversions before genes “escape” further conversions. T h e reasoning is that each conversion event resets the process, so that the expected number of trails before an escape follows a geometric distribution with parameter a. An impor- tant extension would be to incorporate conversion tracts not covering the entire gene. It should be noted that our calculation of ?r, the probability no conver-
Role of selection: If one (or both) members of a duplicated pair are under selection, both the rate of divergence and the acceptability of certain conversion events are altered from the neutral model. Generally, one expects the rate of divergence between genes under selection to be slower than the divergence of neutral genes (but see below). For the same conversion rate, reduced rates of divergence imply (all else being equal) that more conversions occur between a dupli- cated pair than predicted from the neutral analysis. However, all else is likely not equal. If there is selec- tion to maintain at least one functional copy, conver- sion events replacing functional copies with nonfunc- tional copies will be selected against. Thus, with selec- tion to retain a functional copy, both divergence rate and effective conversion rate are reduced. As a crude bracket for extremes, divergence rates likely range from 2p (strictly neutral case) to p (one gene does not change at all), while effective conversion rates vary from
X
(all conversions acceptable) toX/2
(conversions from one gene not accepted, e.g., a pseudogene con- verting a functional copy). Under these bounds, the mutation/conversion ratio (2p/X in the strictly neutral case) ranges from p/X to 4p/X. Recall from (22) and(23) that we can write ?r = exp(-eh(x)), where 8 is the
mutation/conversion ratio. Our general conclusion is that if 8
>>
0.1, duplicated copies can escape multiple conversions, while if 8<<
0.1 the duplicated pair isstrongly constrained by conversion. Given that 8 likely ranges from p/X to 4p/X for a duplication under selection to retain a functional copy,
X
>>
40p is sufficient for conversion to constrain independent evolution, while 1 Op>>
X
is sufficient to allow the pair to escape multiple conversions.In some cases, conversion events may be selected for-events generating diversity, such as in the im- mune system genes, are possible examples. Increases in diversity via conversion may be fairly widespread- frequent conversions observed between members of the cytochrome P-450 superfamily have been sug- gested to increase the diversity of substrates acted upon by family members (AFFOLTER and ANDERSON 1984; ADESNIK and ATCHISON 1986; ATCHISON and ADESNIK 1986).
Ultimately, if the duplicated pair has diverged func- tionally, only those conversions not disrupting select- able differences are likely to be fixed. Conversions may still occur between functionally distinct genes, for example conversions have been observed between the mammalian hormone genes oxytocin and vaso- pressin (IVELL and RICHTER 1984; RUPPERT, SCHERE and SCHUTZ 1984). However, we generally expect conversions (that are to become fixed in a population) between distinct genes to be limited to short regions not interfering with gene function.
Conversions between functionally distinct genes are
expected to be deleterious, and, not surprisingly, it has been argued that selection should favor decreased conversion between such genes. SCHIMENTI and DUN- CAN (1 984) have suggested that certain Alu insertions are selected for by this very reason. Many others have argued a similar role for introns. Are such scenarios reasonable? Consider the extreme case where all con- versions produce lethals, and consider two “alleles”: allele A is a duplicated pair with a conversion blocker (such as A h ) , allele a is a normal duplicated pair, both cases assume complete linkage. Given intrachromo- soma1 conversion occurs in allele a at a maximum rate of A (and usually lower, allowing for divergence), under the assumption of lethality, the genotypes AA:Aa:aa have fitnesses 1 : 1
-
A: 1-
2X. From standard one-locus theory (KIMURA 1957), A behaves like a neutral allele unless 4NeX>>
1, where Ne is the variance effective population size. Even in the most extreme case (i.e., complete lethality), for typicalX
values (i.e.,X
=
Ne must exceed 250,000 for selection to be effective. Given a more reasonable fitness decrease for a conversion (As, with say s = 0. l), Ne must exceed 2,500,000. For typical mammalian populations, such large values of Ne are unlikely.Conversion and evolution
by
gene duplication: Evolution by gene duplication is generally regarded as a primary mechanism for the creation of new genes (OHNO 1970; LI 1983; DOOLITTLE 1985), yet our understanding of this process is still at a very primitive stage. A major conceptual problem is genes must diverge enough to become functionally distinct, and hence independently maintained by selection, but must not diverge too much, else they become inactive pseudogenes. This rather fine balance in the amount of divergence can be greatly altered by conversion. Conversions at a sufficiently frequent rate may pose a major constraint to the evolution of new genes, but, on the other hand, conversions can potentially reac- tivate pseudogenes, increasing their chances of sub- sequent functional divergence.To resolve these roles, a much better understanding than we currently possess on the amount of divergence sufficient to create a new, selectable, gene function is required. Regulatory divergence is likely to be the initial step toward evolution of a new function, with subsequent selection for structural divergence (WIL- SON, CARLSON and WHITE 19’77; HALL 1983). Much regulatory divergence occurs following gene duplica- tion (FERRIS and WHITT 1979), and simple differences in tissue-specific regulation may allow the same en- zyme to play different roles. A striking example is E-
J.
ulatory evolution and gene duplication is given by the alcohol dehydrogenase (ADH) gene in Drosophila. In most species, differences in tissue-specific levels of expression are due to the use of different 5’ promoters of the same structural gene (reviewed in FISCHER and MANIATIS 1986). However, in the mulleri subgroup, the ADH gene has duplicated and tissue-specificity is due to differences in expression of the duplicated copies (MILLS et al. 1986).
Given our ignorance in predicting regulatory changes from nucleotide changes, inferences based on sequence analysis focus on changes in amino acid sequence, potentially overlooking significant regula- tory differences in favor of functionally trivial amino acid substitutions. However, some studies indicate that amount of structural change required for a new func- tion may be Slight-HILL et al. (1984) and CARRELL
(1984) found that single amino acid changes are suf- ficient to create new functions in the mammalian plasma protease inhibitor genes. Significantly, active site regions in duplicate human serine protease inhib- itor genes evolve at a much faster rate than that seen for presumed neutral regions (HILL and HASTIE 1987;
LEIGH BROWN 1987), presumably reflecting selection favoring certain mutants following a duplication event.
Although usually not as extreme as the protease example, rapid divergence following duplication is a commonly observed feature (reviewed in LI 1983).
This has been interpreted as either a removal from selective constraints (KIMURA 1983) or positive selec- tion for new functional sites (GOODMAN 198 1). Rapid rates of evolution of pseudogenes support a neutralist explanation, while the serine proteases and calmodu- lin (the latter showing rapid evolution of sites that subsequently become invariant, BADA et al. 1984),
support a selectively-driven rate at least during parts of the initial divergence. T h e exact cause of diver- gence is of importance to modeling issues. As dis- cussed above, given the same actual conversion rates, a pair of duplicated genes experiencing divergence through positive selection is likely to escape conver- sion more readily than a pair where only one copy is under selection. This introduces an asymmetry into the conversion escape process wherein genes which have not functionally diverged are more likely to undergo repeated conversions than are genes diverg- ing under selection for new function.
An extensive population genetics theory on the rate of silencing of duplicated loci exists (reviewed in LI 1980; TAKAHATA 1982; WATTERSON 1983). In the absence of conversion, silencing of a duplicate locus can occur reasonably fast, suggesting that genes are more likely to be silenced than form new functions. Conversion can potentially both decrease the rate of silencing as well as reactivating silenced copies, pro-
vided they have not diverged sufficiently to escape further conversions. KOCH (1 972) and RIGBY, BUR- LEIGH and HARLEY (1 974) have suggested reactivation of a silenced duplicate gene is the mode for creation of new function, but there are problems with this idea as these authors present it (LI 1983). If a reactivating conversion event covers the entire pseudogene, any divergence accumulated will be lost. Even if conver- sion achieves reactivation by converting only a small region, the remaining divergence has accumulated randomly with respect to function, and are thus not likely to be important.
T h e exact role of conversion in the evolution of
new functions from duplicate genes is unresolved, although theoretical analysis of the success or failure of duplicated genes in the absence of conversion has begun (OHTA 1987). OHTA’S analysis stressed the importance of the ratio the different kinds of muta- tions (deteriorating us. useful) in the dynamics of whether a duplicated gene acquires a new function or becomes a pseudogene. When conversion is consid- ered, the spatial distributions of mutants also becomes very important. A short conversion tract is sufficient to reactivate a pseudogene if all the deteriorating mutant sites are clustered, but if such sites are scat- tered throughout the gene, conversion is unlikely to reactivate it.
T h e view we favor for the role of conversion in the evolution of new gene function is a variation of the ideas of KOCH and RIGBY et al. Given (1) the possibility that regulatory divergence is the initial driving step behind evolution by gene duplication,
(2)
the high risk of duplicate genes degenerating into pseudo- genes, and (3) the above-mentioned asymmetry in the conversion escape process, we feel that conversion may enhance the chance of a duplicated pair giving rise to a new function. If the events required to initiate the evolution of a new function are few, such as regulatory divergence (in the absence of any initial change in amino acid sequence) and/or the change of one or a few key amino acids, the amount of diver- gence required for their appearance need not be great. Conversion can potentially enhance this process by reducing the rate of pseudogene formation, allow- ing duplicate copies more of a chance to acquire a selectable difference. Once significant functional di- vergence occurs, selection is likely sufficient to main- tain the independence of each copy, allowing further evolution and refinement of the new function.Thanks to MICHAEL LISKAY for helpful discussions on homology and conversion rates, and to TOM NACYLAKI and TOMOKO OHTA for constructive comments. This paper is dedicated to the memory of LARRY SANDLER, outstanding teacher, colleague, and friend.
L I T E R A T U R E CITED
ADESNIK, M., and M. ATCHISON, 1986 Genes for cytochrome P- 450 and their regulation. CRC Crit. Rev. Biochem. 1 9 247- 305.
Segmental homologies in the coding and 3’ noncoding sequences of rat liver cytochrome P-450e and P-450b cDNAs and cytochrome P-450e-like gene. Biochem. Biophys. Res. Commun. 118: 655-662.
ATCHISON, M., and M. ADESNIK. 1986 Gene conversion in a cytochrome P-450 gene family. Proc. Natl. Acad. Sci. USA 83:
AYARES, D., L. CHEKURI, K.-Y. SONG and R. KUCHERLAPATI, 1986 Sequence homology requirements for intermolecular recombination in mammalian cells. Proc. Natl. Acad. Sci. USA
BADA, M. L., M. GOODMAN, J. BERGER-COHN, J. G. DEMAILLE and G. MATSUDA, 1984 The early adaptive evolution of calmod- ulin. Mol. Biol. Evol. 1: 442-455.
Retroviruses and retrotransposons: the role of reverse transcription in shaping the eukaryotic genome. Cell
Insertions, deletions and mismatches in heteroduplex DNA made by RecA protein. Cell 35: 5 1 1-520.
BLACKWEU, T. K., M. W. MOORE, G. D. YANCOPOULOS, H. SUH, S. LUTZKER, E. SEISING and F. W, ALT, 1986 Recombination between immunoglobulin variable region gene segments is enhanced by transcription. Nature 324: 585-589.
Programmed gene rear- rangements altering gene expression. Science 235: 658-667.
1986 Double-strand gap repair results in homologous recom- bination in mouse L cells. Proc. Natl. Acad. Sci. USA 83:
Salivary chromosome maps. J. Hered. 26:
Therapy by instant evolution. Nature 312: 14. The Theory of Stochastic Processes. Chapman & Hall, New York.
The genealogy of some recently evolved vertebrate proteins. Trends Biochem. Sci. 1 0 233-237.
Gene required for initiation and resolution of mating-type switching in fission yeast. Proc. Natl. Acad. Sci. 81: 3481-3485.
ERHART, M. A., K. S. SIMMONS and S. WEAVER, 1985 Evolution of the mouse &globin genes: a recent gene conversion in the Hbb“ haplotype. Mol. Biol. Evol. 2: 304-320.
Evolution of the differential regulation of duplicate genes after polyploidization. J. Mol.
FINK, G. R., and T. D. PETES, 1984 Gene conversion in the absence of reciprocal recombination. Nature 3 1 0 728-729. FISCHER, J. A., and T. MANIATIS, 1986 Regulatory elements in-
volved in Drosophilia Adh gene expression are conserved in divergence species and separate elements mediate expression in different tissues. EMBO J. 5: 1275-1289.
FLAVELL, R. A., H. ALLEN, L. C. BURKLY, D. H. SHERMAN, G. L. WANECK and G. WIDERA, 1986 Molecular biology of the
H-2 histocompatibility complex. Science 233: 437-443. GONDA, D. K., and C. M. RADDING, 1983 By searching proces-
sively RecA protein pairs DNA molecules that share a limited stretch of homology. Cell 3 4 647-654.
Decoding the pattern of protein evolution. Prog. Biophys. Mol. Biol. 37: 105-164.
Polymorphism of human la anti- gens: gene conversion between two DR @ loci results in a new HLA-D/DR specificity. Nature 322: 67-70.
Evolution of new metabolic functions in labo- ratory organisms. pp. 234-257. In: Evolution of Genes and AFFOLTER, M., and A. ANDERSON, 1984
2300-2304.
83: 5199-5203.
BALTIMORE, D., 1985
40: 481-482.
BIANCHI, M. E., and C. M. RADDING, 1983
BORST, P., and D. R. GREAVES, 1987
BRENNER, D. A., A. C. SMIGOCK and R. D. CAMERINI-OTERO,
1762-1766. BRIDGES, C. B., 1935
CARRELL, R., 1984
Cox, D. R., and H. D. MILLER, 1965
DOOLITTLE, R. F., 1985.
EGEL, R., D. H. BEACH and A. J. S. KLAR, 1984 60-64.
FERRIS,
s.
D., and G .s.
WHITT, 1979 EvoI. 12: 267-317.GOODMAN, M., 1981
WRSKI, J., and B. MACH, 1986
HALL, B. G., 1983
Proteins, Edited by M. NEI and R. K. KOEHN. Sinauer, Sunder- land, Mass.
A gradient of sequence divergence in the human adult a-globin duplication units. Science 2 2 6 67-70
evolution of the human a-globin-like gene region: Insertion and deletion of A l u family repeats and nondlu DNA sequences. Proc. Natl. Acad. Sci. USA 80: 5970-5974.
HILL, A. V. S., R. D. NICHOLLS, S. L. THEIN and D. R. HIGGS, 1985 Recombination within the human embryonic {-globin locus: a common {-{chromosome produced by gene conversion of the ${ gene. Cell 42: 809-819.
HILL, R. E., and N. D. HASTIE, 1987 Accelerated evolution in the reactive centre region of serine protease inhibitors. Nature
HILL, R. E., P. H. SHAW, P. A. BOYD, H. BAUMANN and N. D. HASTIE, 1984 Plasma protease inhibitors in mouse and man: divergence within the reactive centre regions. Nature 311:
175-177.
HOLLIDAY, R. 1964 A mechanism for gene conversion in fungi. Genet. Res. 5 282-304.
HSIEH, P., M. S. MEYN and R. D. CAMERINI-OTERO, 1986 Partial purification and characterization of a recombinase from human cells. Cell 44: 885-894.
IVELL, R., and D. RICHTER, 1984 Structure and comparison of the oxytocin and vasopressin genes from rat. Proc. Natl. Acad. Sci. USA 81: 2006-2010.
Meiotic recombination between duplicated elements in Saccharomyces cerevisiae. Ge- netics 1 0 9 303-332.
JASIN, M., J. DE VILLIERS, F. WEBER and W. SCHAFFNER, 1985 High frequency of homologous recombination in mam- malian cells between endogenous and introduced SV40 Ge- nomes. Cell 43: 695-703.
Hypervariable “minisatellite” regions in human DNA. Nature 3 1 4 67-73.
High frequency meiotic gene conversion between repeated genes on nonho- mologous chromosomes in yeast. Proc. Natl. Acad. Sci. USA
Chromosomal trans- locations generated by high-frequency meiotic recombination between repeated yeast genes. Genetics 114: 73 1-752.
Evolution of protein molecules. pp. 21-132. In Mammalian Protein Metabolism III,
Edited by H. N. MUNRO. Academic Press, New York. KARLIN, S., and TAYLOR, H. M. 1981 A Second Course in Stochastic
Processes. Academic Press, New York.
KEIL, R. L., and G. S. ROEDER, 1984 Cis-acting, recombination- stimulating activity in a fragment of the ribosomal DNA of
s.
cerevisiae. Cell 39: 377-386.Chi, a promoter of generalized recombination in X phage, is present in immuno- globulin genes. Nature 293: 402-404.
KIMURA, M., 1957 Some problems of stochastic processes in ge- netics. Ann. Math. Stat. 2 8 882-901.
KIMURA, M. 1983 The Neutral Theory ofMolecular Evolution. Cam- bridge University Press, Cambridge.
KLAR, A. J. S., and J. N. STRATHERN, 1984 Resolution of the recombination intermediates generated during yeast mating type switching. Nature 3 1 0 744-748.
Lack of association between intrachromosomal gene conversion and reciprocal exchange. Nature 310: 748- 753.
Intrachromosomal gene conversion in yeast. Nature 2 8 9 144-148.
Homologous pairing HESS, J. F., C. SCHMID and C.-K. J. SHEN, 1984
HESS, J. F., M. Fox, C. SCHMIDand C.-K. J. SHEN, 1983 Molecular
3 2 6 96-99.
JACKSON, J. A., and G. R. FINK, 1985
JEFFREYS, A. J., V. WILSON and S. L. THEIN, 1985
JINKS-ROBERTSON, S., and T. D. PETES, 1985
82: 3350-3354.
JINKS-ROBERTSON,
s.,
and T. D. PETES, 1986 JUKES, T. H., and C. R. CANTOR, 1969KENTER, A. L., and B. K. BIRSHTEIN, 1981
KLEIN, H. L., 1984
KLEIN, H. L., and T. D. PETES, 1981