Steam Explosion Experiments in the "Test for Real cOrium Interaction with water (TROD"
Program
I. K. Park, Y. J. Chang, Y. S. Shin, C. H. Kim, B. T. Min, S. W. Hong, J. H. Song and H. D. Kim Korea Atomic Energy Research Institute, Taejon, Republic of Korea
ABSTRACT
Korea Atomic Energy Research Institute (KAERI) launched an intermediate scale steam explosion experiment named "Test for Real cOfium Interaction with water (TROI)" using reactor material to investigate the effect of material composition, multi-dimensional melt/water interaction, and hydrogen generation. In the frst series of tests using several kg of ZrO2 where the melt/water interaction were made in the water pool at 30 - 95 °C, either a quenching or a spontaneous steam explosions was observed. The morphology of debris and pressure wave proNes show that there were mild local steam explosions. The melt water interactions were monitored by video cameras. The ZrO2/Water interaction tests will continue until early 2001, in parallel with the improvements of the design of test facility. The test using UO2 will be followed.
INTRODUCrION
The experimental research on fuel coolant intemcfion(FCi) has been perfm'ned during the last few decades. It was carried out in a wide range covering analytical work on single drop fiagmentation[1], test on mixing[2], intermediate scale experiments with simulant material on FCI energetics in the FITS[3], ALPHA[4] and experiments using prototypic materials, such as FARO[5,6], KROI'OS[7,8], and COTELS[9]. The previous work greatly contributed to the agreement that the alpha-mode failure is not likely to occur in the absence of the extemal trigger and can be considered resolved from the risk perspective as discussed at the Steam Explosion Review Group (SERG-2) workshop in 1995, and the Specialist Meeting in Tokai, in 1997. But, there still remain FCI issues of safety concern to be resolved for PWR~ The f'rst one is the stmcttml loading to the PWR cavi~ with a deep water pool. The concem is ofposs~le damage to the cavity walls, RPV (Reactor Pressure Vessel) supports and to containment penetrations. The second one is the structural loading of the lower head due to water- onto-melt steam explosions in the new plant designs adopting in-vessel retention (IVR) strategy. Steam explosions could potentially lead to a rapid failure of the RPV weakened by molten pool in the lower head. The RPV failure mode has an influence on melt ejection and spreading, and possibly an impact on coolability and on the operation of a core-retention device.
We note that the experimental data of the prototypic material was not sufficient to resolve a few uncertainties. The past prototypic experiments have some limitation such as material component, pouring diameter, and hydrogen effect. (1) Material properties: Most of the experts agree that the physical properties of the binary oxide melt seem to have a signif'r, ant eff~--t on the steam explosion triggerability and explosivity. The state of knowledge of the relevant material properties is still rather poor. (2) Hydrogen effect: The role of hydrogen augnentation or suppression in the FCI need also be investigated further, as the excessive hydrogen generation w as observed in the FAR(YKROTOS experiments using prototypic melts. (3) Large pouring diameter: The past FCI work have usually conducted with the small size pouring diameter and the fuel/water mixing zone has v~5' limited one-dimensionally geometry. It is clearly known in small scale experiments that the poured amount should have an effect on the vblence of the steam explosion[10]. But, its effect is still not clear in the medium or large scale experiments.
KAERI (Korea Atomic Energy Research Institute) launched an experimental FCI research program named as '~est for Re~I cOfiuna Interaction with water (TROI)" under govmamental long-term nuclear R&D plan since 1997. The object of the research is to resolve the generic safety issue of ex-vessel steam explosion for Korean Next Generation Reactor(KNGR) and to propose an appropriate severe accident management(SAM ) strategy. It would also contribute to the understanding ofthe effect of the material property on the conversion efficiency of steam explosion, which is the essential and high-priority research topic for the FCI community. This paper descffoes the TROI test facilities, measurement system, the cold crucible, and restdts of fwe
Zr(")z/Water
tests.SMiRT 16, Washington DC, August 2001 Paper # 1925
The TROI TEST FACILITIES
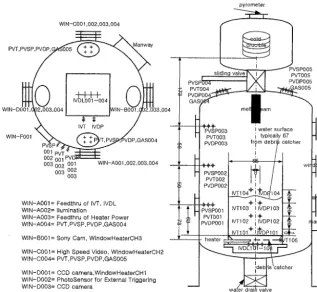
A schematic diagram ofthe TROI test facilities is shown in Fig. 1. The test facilities consist of a pressure vessel including the upper and lower vessel, a sliding valve, and a test section inside the pressure vessel. The upper vessel contains crucible and melt release assembly. A slide valve located between the lower and upper vessel is used to isolate the upper and lower vessel.
Wl N- COO 1,002,003,004
PVT,
~ M a n w a yWIN-D001
'~'004' I~DP
IWIN-B72'-003'004WIN-F001
~ D P , G A S 0 0 4
001 PVT002 001 pv[::Xea.----a--
003 002 001 WIN-A001,002,003,004 003 002
003
WIN-A001= Feedthru of IVT, IVDL WIN-A002= Ilumination
WIN-A003= Feedthru of Heater Power
W l N-A004= PVT, PVS P, PVD P,GAS 004 WIN-B001= Sony Cam, WindowHeaterCH3
WIN-C001= High Speed Video, WindowHeaterCH2
Wl N-C004= PVT, PVS P, PVDP,GAS005 WIN-D001= CCD camera,WindowHeaterCH1 WIN-D002= PhotoSensor for External Triggering
WIN-D003= CCD camera
pyrometer
sliding valve r,~! A pvSTP0005
PVSp!oo4 1 2 E l w o P o o 5
PVT004 " AS005 PVD POO4~...A~ l "~"~.L.,.~
El ~P~'SPO03 !water surface I I
17 -PvTo03- _ i typically 67 H [ PVDP003 fr?m debrt catcher 1
/ PVDP0021 - - / I
H
t t I- I~WsP001 I ' w ' 0 \ .,I IVOP103 I ~ 4 1 ~_ " PVT001 I . . . ~ ! £ . . . I JL ' I
~v~oo, I ,v,,% !£~,~ I ~ n anwlay
~, LIVT10l "~ I~'DPI01 J4-" " ' 1 • heater ~ . ~ . ~ -.-~ --~T105 - -
~
is 'catcherwafer draih valve
Fig. 1 TROI Facilities Configuration and Measurement Location(unit--cm)
Pressure Vessel and Test Section
The pressure vessel was designed to endure the static and dynamic load caused by a postulated steam explosion. The design pressure was determined to be 2 MPa, which was obtained by multiplying the safe~y factor of three to the conservative equilibrium pressure determined from the instantaneous mixing of 25 kg ofcoriuna with water. The dynamic impulse was determined from the TNT equivalent method, where the explosive energy was based on the conservative conversion efficiency of 3%, which was observed in the FCI experiments using Alumina/Water system[3]. The dynamic pressure was assumed to be in the triangular shape with duration of 3 ms. The integrity ofthe pressure vessel due to steam explosion load was demonstrated by an analysis using ANSYS computer code [11]. As the results of recent experiments
J
[7,8] indicate that the corium is much resistant to the steam explosion than Alumina, the procedure used in the analysis of the stmcaral loading provides proper safety margil~
In TROI tests, the various types oftest section could be adapted because the pressure vessel has a role of pressure boundary. The test section of TROI tests was designed to easily visualize the fuel/water interaction. The transparent (1 crn thick polycarbonate) plates were attached at the four side of 1450x65x65 crn rectangle. The lower part and the flame were made of stainless steel. The debris catcher, 15kW water heater, and thermocouple were adapted at the lower part. The one side was used for mounting thermocouple and piezo-electric pressure
Crucible and Melt Release Assembly
The cold crucible and release assembly consists of a cruc~le made of copper tubes, a plug at the bottom, and a puncher. The melt is typically contained in a cold crucible with a palisade-like wall consisting of water-cooled copper tubes. The sintered layer, which is n a t t ~ y finned along the inner surfw, e of cold crucible, plays a crucial role in retaining the molten material without direct contact. Inductive slafll melting of oxides is basically a direct inductive heating of an electricaUy conducting melt by an alternating electromagnetic field. After the plug is removed for melt deliv~y, the conical-shaped puncher punches the crust finned at the bottom of melt to initiate the melt discharge. The theory and results ofmelting experiments using cold crucible used in this facility is described in detail in Hong et. a1.[12].
Measurements System
Table 2 and Fig. 1 show the measurement conffgta~ion. An optical two-color pyrometer (Korea-Chino co., resolution : 2 °C, 1100-~3100°C) measured the melt temperature in the firmce. The pyrometer views the melt pool through a hole formed in the upper crust of the melt. The hole in the upper crust is formed at the initial charging of the powder. The hole is maintained naturally during the melting process. A number of K-type thermocouples measure temperatures in the test section, pressure vessel atmospheric space, and in the inlet and exit cooling line of the induction coil.
Piezoelectric pressure transducers(PCB piezotronics inc., model 112A, maximum pressure 69 MPa, or 6.9Mpa, r ise time 2 ps, and resonant fiequency 250 kHz) are mounted on the wall of the test section and on the wall of the pressure vessel for meastnfng dynamic pressures d u n g the melt water interaction. The static pressure transducer (Dmck Co., model pmp4060, maximum pressure 35 bar, response time 1KHz) measures the transient pressure inside the test vessel and containment chamber. V XI system (800kHz sampling/channel, lkHz/channel) by Agilent Technology is used for the data acquisition. The transient data are acquired at two different fiequencies of 100 Hz and 50 kHz by one control program.
The high-speed digital video imaging system (Phantom V 4.0, 512x512 pixels at 1000 pps) captures the pictures of explosive fuel coolant interaction. CCD camera at 4 locations (two at the lower vessel, two at the upper vessel) monitors the sequence of the events for the experiments. Two out of four CCD cameras are connected to the video system for recording. Gas samples are taken for chromatographic analysis using a gas sampling system consisting of sample cylinders with manual valves at the inlet and outlet of cylinders.
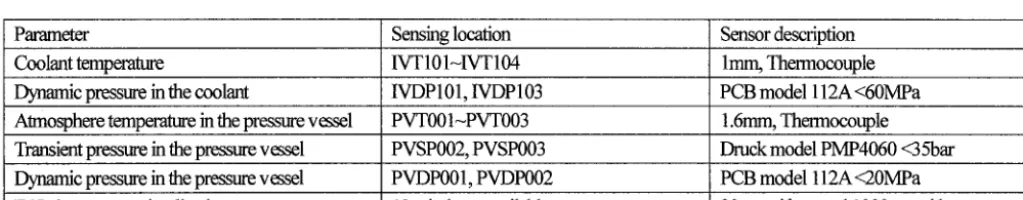
Table 1. Measurements Position and Sensor Description
Parameter Sensing location Sensor description
Coolant temperature IVT101-qgY 104 lmm, Thermocouple
Dyrmmic pressure in the coolant IVDP101,1VDP103 PCB model 112A<60MPa
Atmosphere tempemttn'e in the pressure vessel PVT001-~PVT003 1.6mm, Thermocouple Transient pressure in the pressure vessel PVSP002, PVSP003 Druck model PMP4060 <35bar Dynamic pressure in the pressure vessel PVDP001, PVDP002 PCB model 112A <20MPa
FCI phenomena visualization 13 windows available 30pps videos and 1000pps video
TROI-ZrO2 TEST PROCEDURE
1) Heat up the water in the test section. 2) Start melting of Z102 by ttnning on the power of RF generator while the slide gate valve is closed. 3) Monitor the melting process and the tempemare ofthe melts. 4) Vent the containment chamber to maintain the atmospheric pressure. 5) Open the slide gate valve 6) Turn offthe power to the RF generator. 7) Open the plug, activate puncher, and Close the slide gate valve. This proce&~re was automated with appropriate time delay. Complete data acquisition
RE~JLTS AND DISCUSSTION
below.
Table 2. Initial Condition and Results for
TROI-ZrO2
Tests(SS--Steam Spike, SE=Steam Explosion)TROI test number Melt Test Section Pressure Vessel Results Debris
, Unit
Composition UO2/ZrO2/Zr [w/o] 0/99/1
Tempemttre I[K] >3327
Charged mass [kg] 8.01
Initiator mass [kg] 0.1
Released mass [kg] 5
Initial jet diameter [m] 0.037 Free fall in gas i [m] 2.5
Water mass ![kg] 283
Height [ m ] 0.67
Cross section ! [mxm] 0.65x0.65
Initial temperature [K] 365
Subcooling [K] 5
Initial pressure(air) [MPa] 0.1
Free volume [m3] 8.032
MaximumPVpresan~ation [ M P a ] 0.02
Maximuna PV heat-up [K] 15
Maximum water heat-up [K] 4
Steam explosion SS
Dynamic pressure peak . [MPa] 1
Total amount i [kg] 2.2
Cmst(>50mm) [kg] 0.98
Crest(10-20mm) [kg] -
Particle(10-20mm) [kg] 0.2
Parficle-dominated(2-5mm) [kg] 0.67 Particle(2-710 m) [kg] 0.15 Fineparticle(<710 m) [kg] 0.04
1 2 3 4 5
0/99/1 8.4 0.1 5.5 0.052 2.5 283 0.67 0.65x0.65 365 8 0.1 8.032 0.008 20 10 NO 0/99/1 3200 7.8 0.1 4.88 0.060 2.5 283 0.67 0.65x0.65 323 50 0.1 8.032 0.01 25 10 NO 0/99/1 3200 7.2 0.1 4.2 0.028 2.5 283 0.67 0.65x0.65 292 81 0.1 8.032 0.03 37 SE 2. l(3peaks) 0/98/2 3900 6.4 0.1 2.9 0.038 2.5 283 0.67 0.65x0.65 337 36 0.1 8.032 0.035 40 SE 0.9(2peaks) 5.5 2.54 2 0.67 0.25 0.04 4.88 2.56 1.12 0.77 0.35 0.08 4.256 1.36 0.76 0.18 1.116 0.54 0.26 3.02 0.62 0.58 0.04 0.74 0.54 0.5 FCI Visualization
The five 30pps videos and one 1000pps video were used for visualizing FCI phenomena and melt release. The exposure time was set with v~ry short time and/or the n e ~ density triter was needed because melt was v ~3' bright. Fig. 2 shows that the mixare is nearly 20cm wide body. We focus on taking the picture of the mixing phenomena .The recording speed, exposure time, and recording time were 500pps, 0.8ms, and 8sec respectively. Thus, the whole picture became v~'y bright when the explosion occtnTed.
Melt Temperature
During melting process, the melt temperature was measured using the two-color pyrometer. When the melt temperature was out of the upper range ofthe pyrometer., it can be extrapolated by using Eqn (1).
1 1
- - = - - + K l n ( y ) (1)
S T
~~,i'~ N',~Nii!il Ill !ill i: i i i!ii',iiii :,i',!~i~! ',:':: i i~,::! :: :: i: :::: ~ i i i~:,i i~ i iiii~ !i ili i:ili ~i~ii i:~i',i'~ii'~ iiii i'~ '~il i', !iiii ',il ili ii i i',N i~iiiNii!ii!!iiiii ii iliill il ii','~ !i i i i: !~i~ii",~ i i: i! !@!.:~
i#i tiiiiiiiiiiiiiiiiiiiiiii !i!::iii~! ili~iii:i;i,i i i;i; i :i::i::::ii;;i !:~I :: :.: :. :: i i ! i :: ;::i':iii::;ili i i:~ili ili iiii~i iiii~iiiii~!~i~ ~:,::::iiiii~i::iii:::.!!::i~!i:J~i:J~i!i::iii!!~:.!i!:::::!::il ::: ! i ~ : : ; ~ ! ~
i!iiiiii~il Iilili!i!ii!iiiiiiiiii:,i',~,i'::i~ i','~ii~,',!ii~!ii!iiiiiii!i?~;~i'~:!~ii~i,~,~91!iiii!ii iii',~:',~ii,,~i iii~i~i~ ,iii ::i: i~:!~: i~ ~:N~
::i~iiii!~-}iiii::i!il ~iiiii~iii~i~i~i2!~i~?~i~i~i!~!~i!~!~iii~!i~i :!:!:iiii:i:ii::i::i~!~!i!!i:?i:iii~i~:iii~ ~i~)i;iiiii~i::::::::::::::::::::::: :!~ii; i ~
•
I
:! ':::
:!ii!!
::::::::::::::::::::::::::::::: .~:~:~.`:~..~..~..*.::~.~.!.~.;...~;~:.~...:~s~.`:~.~:`~.,:~..*..~*~..~.:.~ - ... ~ : :.' - : . . . .:~i~ ~.".iii~.;..s.;~$.:,';2~}.'..!,ii !.'..i.'~!-': ~.~!
:~ :::::::::::::::::::::::::::::: ;..~i' .... ~!;~...:~,~;i~::~.~:~i::~i:i::::~.i~i~!~i~ ~:i:.::!'i~.i :! : :i~ii::.:i::~! ;: : : : : : : : ::N~:N~..,.::,..:~ ,.,% ~..
• ~.:~.~i;~:..~ ~:~i.'.~]~:.::~: ~.,]~:~.;~:~:-~:i~. ~,:,, .~ ~ ' : , ~ . . : ~:~:..~ : : . : : .:.~.~ ~:~. :-,.~ ... •
Fig. 2 The High Speed Photo Image of the ZrO2/Water Mixing Behaviors
Dynamic Pressure
Fig. 3 shows the measured dynamic pressure wave profiles. The dynamic pressures were measured at the test section and the violent sound could be heard outside pressure vessel in TROI-1, 4, 5 tests. The measured peak pressure at TROI-5 was less than the TROI-1, 4 tests, but its pressure wave width was larger than those. The explosion sound and the mechanical damage of the test section were most severe at TROI-5. It implies that the explosion work was not proportional to the peak pressure, but dependent upon the width ofthe pressure wave. The pressure wave at TROI-1 has a peak without width, the sound was vo'y weak, and there was no damage in the test sectiorL There exist two pressure peaks in TROI-5 test. The frst peak is due to explosion and the second peak is reflected pressure wave. The pressure wave speed can be obtained as around 300m/s considering test section width and the time delay between two pressure peaks. It must be noted that the measured explosion pressure might be reduced due to the destruction of the interaction vessel wall.
2 . 5 , i , I , i , i , I ,
2 . 0 .
,-, 1.5.
1.0.
• 0 . 5 ,
- 0 . 5
0 . 2 0 0 0 0 . 2 0 2 5 0 . 2 0 5 0 0 . 2 0 7 5 0 . 2 1 0 0 0 . 2 1 2 5 0 . 2 1 5 0
T i m e ( s e e )
2 . 5
2 . 0
~"
1"5¸¸
1 . 0 -
0 . 5 -
0 . 0 -
- 0 . 5 .
5 . 1 0 0 0 5 . 1 0 2 5 5 . 1 0 5 0 5 . 1 0 7 5 5 . 1 1 0 0 5 . 1 1 2 5 5 . 1 1 5 0
T i m e ( s e e )
2 . 5
2 . 0 -
~ . 1 . 5 .
1 . 0 -
0 . 5 .
0 . 0 .
I V D P 1 0 1 ]
- 0 . 5
5 . 0 2 5 0 ' 5 . 0 2 7 5 ' 5 . 0 3 0 0 ' 5.0~325 ' 5 . 0 3 5 0 ' 5 . 0 3 7 5 ' 5 . 0 4 0 0
T i m e ( s e e )
Fig. 3 M e a s u ~ l Dynamic Pressure Profiles at TROI-1, 4, 5 tests
Pressure and Temperature of the Pressure Vessel Atmosphere
Fig. 4 shows that if the FCI is more vblent, the rate of the pressure vessel presstn'ization is larger. The pressure vesdel pressta~ation for TROI-4, 5 tests were much higher than those at TROI-1, 2, 3. The pressure buildup of the pressure vessel seems to be caused by steam generation. Thus, the fine fiagmentation due to the explosion increased the heat transfer area between coolant and ftel, and the rates of
steaming and pressure buildup were high.
Fig. 5 shows that the pressure vessel atmospheric temperatures had the same trend as the pressure profile. The temperature increases at TROI 4, 5 tests, in which steam explosion occtm'ed, were sharper and larger than those at TROI-1, 2, 3 tests. The temperature increase in the explosive case was above 35K, but the increase in the non-explosive case was below 25K. The vmj sharp increase in temperature of the pressure vessel atmosphere was measured in TROI-5 test. The temperature prot~es of TROI-5 test have two peaks: The f'rst peak is very sharp and the second peak is relatively broader than the frst. It is estimated that the frst peak was generated bythe compression work and the second peak indicated heating by steam generation. That behavior did not occur in TROI-4, in which the interaction was less vblent than TROI-5 test.
0.15
340 ,-, 0.14 g.
"~ 0.13.
0.12. Q.
0.11
0.10
800 820
I , i
[
~ PVSP002. . . . PVSPO03
840 8&o 8~0 9oo
0.16
0.15-
~, 0.14 o_
~ 0.13
0.12
0.11
PVSP002 . . . . PVSP003 0.16
0.10
3940 39'6o 39'60 40'o0 40'20 4040
T i m e ( s e c ) T i m e ( s e c )
0 . 1 6 - ~
0.15-
..~ 0.14-
0.13
g
0.12
0.11, I
0.10.
3500 3520 3540 3560 3580 T i m e ( s e e )
Fig. 4 Transient Pressure Profiles in the Pressure Vessel Atmosphere at TROI- 2, 4, 5 tests
340,
iii t
~- aoo~--'-: :~
29o 1
8O0
, i , 1 , i , I ,
- PVT001
I . . . . PVT002 . . . . PVT003
°oO°'°°°o-o . . . O o o . . .
, • • . ** ,~ t,. j ° % o ' - ' - ~ , . ' ' - _ . = . . . : . . . : . ~ , " . . . -" -
330. ,.-., v
~ 320.
~ 3 1 0 -
~- 300-
290
340.
, i , i , i , i ,
PVT001 . . . . PVT002 . . . . PVT003
..,,'.~-'--.":--~
..t. . . . . - : . . . . ! - . . " : . - - . . . .
°= ,_,,,
40'00 40'20 4040 T i m e ( s e e )
330
~ 320 .,..,
310. E ~- 300,
290.
P V T 0 0 1
~ ' , , ~ . . . . evm002
, .~ "¢.~,..,.,
I';- ~ , , ~ . . . . . PVTO03
I "~%~.~, . ~ , . . . . . o ~ . . % . ; . . . . ~ -,
i
i
J
8½0 " 8~,0 ' 860 ' 880 ' 900 3940 39'60 39'80 35'00 35'20 35'40 35'60 35'80
T i m e ( s e e ) T i m e ( s e e )
Fig. 5 Transient Temperature Profiles in the Pressure Vessel Atmosphere at TROI 2, 4, 5 tests
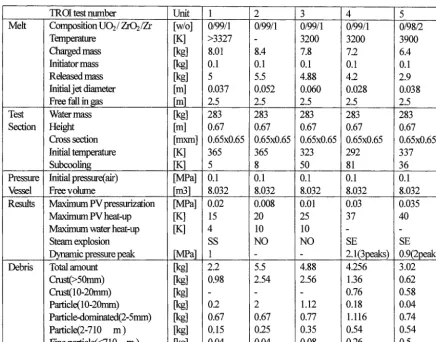
Water Temperature
Fig. 6 show that the coolant temperature increase at TROI-ZI'O 2 test was relatively low because the coolant volume was v~xy large
compared to the fuel amount and the thermocouple location was far from the mixture. The coolant temperature at TROI-4, 5 tests showed the atmospheric temperature because the test section was broken and empty when the fuel was poured into the coolant. In the f'rst three series TROI- 1, 2, 3 tests, the coolant temperature increase was nearly 1 OK.
390
385
380
~
375&
E 370
365
- - I V ' 1 " 1 0 1
IVT102 IVT103
360
800 8~0 8;,0 8~0 8~0
390-
385
~, 380 3
375
&
E 370 F-
365
I V T 1 0 1
IVT102 IVT103
... • .¢ 360
900 800 8~0 8~0 8~0 8~0 900
T i m e ( s e e ) T i m e ( s e e )
35°t ~ V T l O l
1
.560 580 600 620 640
T i m e ( s e e )
Fig. 6 Transient Temperature Profiles of the Water at TROI 1, 2, 3 tests
Debris Analysis
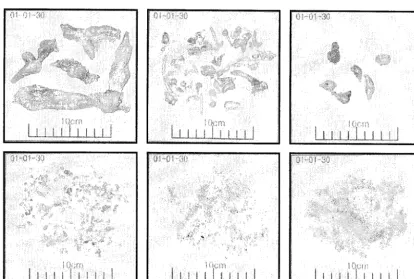
After all test, the debris were collected and analyzed using meshes at sizes 20mrn, 5mm, 2nma, 710 m as shown as Table 2 and Fig.
7. Two kinds of debris were produced during ZrOJWater interaction: particles and cnN. In TROI-2,3 tests, the amount of large size(5-10cm)
crest is about 50% of total poured melt, and the amount of large particle size at 1-2cm is 20% and the other are smaller particles. In TROI-4, 5
Thus, the primary difference of debris dism'bution between explosive case and quenching case were in the amount of large particles and fine particles. The fine particles were only discovered in TROI-4, 5, in which FCI was violent. The amount of fine particles at TROI-5 was 0.5kg as much as the double of 026kg at TROI-4, while the amount of other size particles were larger at TROI-4 than at TROI-5. Thus, the fiae particle mass should be explosive measure together with the explosion pressure wave. The FCI was more explosive, the portion of fine particles was larger and the potion of large particles was smaller. It seems that the large particles generated in mixing process should be participated in the steam explosion and be conve~WA into the free particles.
When there was no spontaneous explosion, the debris distribution was quite different from that of previous work using UO~-ZrO2 melt. This ZrO2AVater interaction induce~ a lot of large size particle with l~2cm diameter, while the primary portion of the particle had the diameter of less than 5mm in the previous UO2-ZaO2AVater interactior~
!
¸
ii i;iil;il i,,ii,:;i; :i
'.. ( } s , ~'v".,. . ' i
L ~ ± , L L _ L 2 L L I
... :: .... ... i .... i
[ i : :.. ~f.::; : . : . . " :~:~{"~. :~:~i :~ ... ~i!~iii!ii~::~~.!~i~i!iii!ii~:i::~;iii~ii:,.:..::ii~::~:
: i, ,!''i ~: !i:~
:
: . . . ~ ~ ~l ~ ~ ! ~ :: i ' i
!i!
¸ i
: l :: "i - i: " .... • • . : : - :::::i • " .. . : . . . . . ~' i ~ : " : " : : " " "
: .... - :!i!:~i)::..~:-:;:~i~:~:!i : -~!:::~:~::i::! ~:~ . . . . :::i..::....::;:ii~:::.~.:{.::!.::.;:i:~. ~
LJ
J
~ L ~ :
:
::~
' x 4 I o :i ,
. . . ~ :~ ::i~il : , , ,
... :..~.~..L..::....~.'::!:...:..-.-.:=:.:~..: ~ ~ - - I - - - - ~ - .-
. . .I I :1 ~ , , ± t
~ ... ..::.,.~o .~:::~ ... .:.~..:.~ L J
.I I
Fig. 7 Debris Configurations (a. Crust 5~10cm, b. Crust 1-~2cm, c. Particle l~2cm, d: Particle-dominated 2--Smm, e. Particle 24).710nun, f. Particle <710 m)
Violent FCI vs. Quenching FCI
The violent cases could be distinguished from the quenching cases by the dynamic pressure wave, the exploding sound, the free fragments, and the sharp pressure and temperature increase. The results of TROI-2 and TROI-5 test, which are chosen as the representative quenching test and steam explosion test, obviously show this difference. In TROI-5 test, the explosion pressure with the peak of 1 MPa and the width of several mill-seconds was measured and the violent exploding sound was heard. The pressure and temperature in the pressure vessel rapidly increased. In TROI-2 test, however, there were no explosion pressure wave and violent sound. Also, the pressure ~nd temperature increase were mild and small.
In TROI-5 test, 0.54kg of the tiny particles with about 2ram diameter and the fine fiagments with the diameter below 0.7mm of 0.5kg were collected, while the large particle with 1-2cm diameter was rarely collected. The TROI-2 test shows exactly the reverse behaviors. The small particle and fnae fragments was rarely collected and the mass of large particle amounts to 1.12 kg. This trend is consistently observed in the TROI-1, 3, 4 tests.
SUMMARY AND CONCLUSION
'ff'est for Real cOrium Interaction with water (TROI)" using reactor material to investigate the effect of material composition. The construction of the test facilities for FCI test in a multi-dimensional geometry was completed and the insmnnentation and control system was set up and the cold crucible technology was implemented for the melting of UO2-~2 mixture. TROI-Z/O2 tests were performed and relevant transient data are collected. From the results oftest it is observed that
(1) The Z[O2/Water
system induced spontaneous steam explosion, even though the subcooling of coolant was not very high. Thedynamic pressure, which is considered to occur due to FCI, was measured in three tests among f'we tests.
(2) The energetic steam explosion is able to be identif'ext by the measured dynamic pressure, the explosive sound, the mechanical damage of test section, the atmospheric pressure and temperature increase profile, and collected debris distribution.
(3) The debris analysis implied that the breakxtp phenomena might be quite different from that ofprevbus work using UO2-ZrO2 melt.
ACKNOWLEDGEMENT
Present research is supported by the long-term nuclear R&D plan of the Ministry of Science and Technology in Republic of Korea. Mr. Hwang had an effort for preparing these experiments.
REFEREN:~ES
1. X. Chela, R. Luo, W. W. Yuen, T. G Theofanous, "Experimental simulation of microinteractions in large scale explosions", Proc. offinal
program of CSNI specialist meeting on fuel coolant interactions, pp. 364-390, JAERI-Tokai, Japan, 1997.
2. M. K. Denham, A. E Taylor, and D. E Fletcher, "Experiments on the mixing of molten Uranium dioxide with water and initial comparisons with Chymes code calculations", Proc. ofNUT~TH-5, Vol. IV, Utah, SA, 1992.
3. D. E. Mitchell, M. L. Con'adini, W. W. Tarbell, Intermediate scale steam explosion phenomena." Experiments and analysis, SAND81-0124, SNL,1981.
4. N. Yamano, Y. Maruyama, T. Kudo, A. Hidaka, J. Sugimoto, "Pehnomenological studies on melt-coolant interactions in the ALPHA program", Nuclear Engineering and Design, Vol. 155, 1995, pp.369-389.
5. D. Magallon, I. Huhtiniemi, and H. Hohmann, "Lessens learnt from FARO/TERMOS corium melt quenching experiments", Proc. offinal
program of CSNI specialist meeting on fuel coolant interactiom, JAERI-Tokai, Japan, May 19-21, 1997.
6. D. Magallon and I. Huhtiniemi, "Corium melt quenching tests at low pressure and subcooling water in FARO", Proc. of NUREI7-I-9, San- Francisco, Califc~tia, U.S.A. October 1999.
7. I Huhtiniemi, D. Magallon, and H. Hohmann, "Results ofrecent KROTOS FCI tests: Alumina vs Corium Melts", Proc. off'naal program of CSNI specialist meeting on fuel coolant interactions, JAERI-Tokai, Japan, May 19-21, 1997.
8. Huhtiniemi and D. Magallon, "Insight into Steam Explosions with Corium Melts in KROTOS", Proc. of NURETH-9, San-Francisco, Calif~aia, U.S.A. October 1999.
9. M. Kato, H. Nagasaka, Y. Vasilyev, A. Kolodesshnikov, and V. Zhdanov, "Fuel coolant interaction tests under ex-vessel conditions", Proc. of
the OECD workshop on ex-vessel debris coolabilitty, pp. 293-300, Karlsmhe, November 1999.
10. M. L. Corradini, "A Review of Experiments for Accident Analysis", Nuclear Safety, Vol. 32, No. 3, July-September, 1991.
11. C. R. Cho, J. H. Song, H. D. Kim, "An Assessment of the Integrity ofthe TROI Vessel under the Steam Explosion Loads", Proc. of Korean
Nuclear Society Meeting, Fall, 2000.
Steam Explosion Experiments in the "Test for Real cOrium Interaction with water (TROI)"
Program
I. K. Park, Y. J. Chang, Y. S. Shin, C. PL Kim, B. T. Min, S. W. Hong J. H. Song and H. D. Kim Korea Atomic Energy Research Institute, Taejon, Republic of Korea
ABSTRACT