ISSN: 2319-8753
I
nternational
J
ournal of
I
nnovative
R
esearch in
S
cience,
E
ngineering and
T
echnology
(An ISO 3297: 2007 Certified Organization)
Vol. 3, Issue 9, September 2014
Performance Assessment of Heat Exchanger
Using Mamdani Based Adaptive Neuro-Fuzzy
Inference System (M-ANFIS) and Dynamic
Fuzzy Reliability Modeling
1
Pravin Kumar Borkar,
2Manoj Jha,
3M. F. Qureshi,
4G.K.Agrawal
1Department of Mechanical Engg., Rungta College of Engg. & Tech., Raipur, India. 2
Department of Applied Mathematics, RSR Rungta College of Engg. & Tech., Raipur, India.
3
Department of Electrical Engg., Govt. Polytechnic, Janjgir-Chapa, India.
4Department of Mechanical Engg., Govt. Engg. College, Bilaspur, India .
ABSTRACT: Performance monitoring system for shell and tube heat exchanger is developed using Mamdani Adaptive Neuro-Fuzzy Inference System (M-ANFIS). Experiments are conducted based on full factorial design of experiments to develop a model using the parameters such as temperatures and flow rates. M-ANFIS model for overall heat transfer coefficient of a design /clean heat exchanger system is developed. The developed model is validated and tested by comparing the results with the experimental results. This model is used to assess the performance of heat exchanger with the real/fouled system. The performance degradation is expressed using fouling factor (FF), which is derived from the overall heat transfer coefficient of design system and real system. Hybrid algorithm is the hot issue in Computational Intelligence (CI) study. From in-depth discussion on Simulation Mechanism Based (SMB) classification method and composite patterns, this paper presents the Mamdani model based Adaptive Neural Fuzzy Inference System (M-ANFIS) and weight updating formula in consideration with qualitative representation of inference consequent parts in fuzzy neural networks. M-ANFIS model adopts Mamdani fuzzy inference system which has advantages in consequent part. Experiment results of applying M-ANFIS to evaluate Reliable Performance Assessment of Heat Exchangershow that M-ANFIS, as a new hybrid algorithm in computational intelligence, has great advantages in non-linear modeling, membership functions in consequent parts, scale of training data and amount of adjusted parameters. This paper proposes a new perspective and methodology to model the fouling factor (FF) of the heat exchanger using the fuzzy reliability theory. We propose to use the indicator or performance or substitute variable which is very well understood by the power plant engineer to fuzzify the states of heat exchanger.
KEYWORDS: Heat exchanger; Overall heat transfer coefficient; Fouling factor (FF), Fuzzy reliability, performance characteristics, Mamdani Adaptive Neuro-Fuzzy Inference System (M-ANFIS).
I.INTRODUCTION
Heat exchanger process is complex due to its nonlinear dynamics and particularly the variable steady state gain and time constant with the process fluid (Mandanvgane et al 2006). Heat exchangers are used to transfer the heat between two fluids across a solid surface that are at different temperatures. The commonly used shell and tube heat exchangers are used in refrigeration, power generation, heating, air conditioning ,chemical processes, manufacturing and medical applications (Ozcelik , 2007)). The performance of heat exchanger deteriorates with time due to formation of fouling on heat transfer surface. It is a very complicated phenomenon and can be broadly categorized into particulate, corrosion, biological, crystallization, chemical reaction and freeze. It is necessary to assess periodically the heat exchanger performance, in order to maintain at high efficiency level. Performance of heat exchanger is monitored by the following methods: i) Outlet temperature of the hot stream (Tho) profile, ii) Approach temperature (Tho - Tci) profile, iii)
ISSN: 2319-8753
I
nternational
J
ournal of
I
nnovative
R
esearch in
S
cience,
E
ngineering and
T
echnology
(An ISO 3297: 2007 Certified Organization)
Vol. 3, Issue 9, September 2014
coefficient. The first four methods are widely used and are ineffective in terms of isolating the net impact of fouling from process upsets. But the overall heat transfer coefficient method requires detailed calculations and knowledge of the geometry of the exchangers (Radhakrishnan et al 2007) Any deviation from the heat transfer coefficient of design/clean heat exchanger will indicate the occurrence of fouling( Vijaysa et al 2006). Tubular Exchanger Manufacturing Association recommends an allowable fouling factor (FF) or fouling resistance to tolerate some degree of fouling before cleaning must be undertaken. Hence, monitoring system is needed to assess the performance of heat exchanger. In experimental studies and engineering applications of thermal science, researchers and engineers are expected to reduce experimental data into one or more simple and compact dimensionless heat transfer correlations (Wang et al 2006). The limitations of correlation methods are addressed by computational intelligent (CI) techniques, such as M-ANFIS and fuzzy reliability. M-ANFIS is one of the most powerful computer modeling techniques, based on fuzzy approach, currently being used in many fields of engineering for modeling complex relationships which are difficult to describe with physical models.
In this paper, a performance monitoring system is developed for a shell-and-tube heat exchanger using secondary measurements namely the temperatures and flow rates of the hot and cold fluid (water).Experimental system is developed to investigate the performance of heat exchanger. M-ANFIS is applied to model the heat exchanger with experimental data. The input parameters to develop a model for design/clean heat exchanger are inlet temperature and flow rate of shell and tube side fluids and output is overall heat transfer coefficient (UDesign). The overall heat transfer
coefficient of real/fouled system (UReal) is calculated using measured values such as inlet temperature, outlet
temperature and flow rate of shell and tube side fluids. The heat exchanger performance is assessed by comparing the results of clean/design and fouled/real system. Any deviation from the result of design/clean system indicates that the performance is degraded due to fouling. Its degree of membership is derived from fouling factor (FF) using UDesign and
UReal.A Mamdani model based Adaptive Neural Fuzzy Inference System, which named M-ANFIS is proposed here.
Experimental results show that this model can achieve the desired targets and have a preferable capacity in performance assessment of heat exchanger.
This paper proposes to use the theory and methods for fuzzy sets to model the reliability for a system with continuous stochastic performance degradation. We use the performance characteristic variable which indicates the continuous performance levels of degradable systems to fuzzify the states of a component or system. The engineering or technological performance variable is well understood by the system designers and can be used to represent different degrees of success. Thus, the imprecision in the meaning of success/failure is quantified through the fuzzy success/failure membership function which is defined over the performance characteristic variable. The proposed fuzzy reliability measures provide an alternative to model the continuous state behavior for a system. The dynamic behavior of fuzzy reliability is investigated using the concept of fuzzy random variable under appropriate stochastic performance degradation processes.
II. MAMDANI BASED ADAPTIVE NEURO FUZZY INFERENCE SYSTEM (M-ANFIS)
ISSN: 2319-8753
I
nternational
J
ournal of
I
nnovative
R
esearch in
S
cience,
E
ngineering and
T
echnology
(An ISO 3297: 2007 Certified Organization)
Vol. 3, Issue 9, September 2014
Model Description
The T-S fuzzy inference system works well with linear techniques and guarantees continuity of the output surface (Tan et al 2009). But the T-S fuzzy inference system has difficulties in dealing with the multi-parameter synthetic evaluation; it has difficulties in assigning weight to each input and fuzzy rules. Mamdani model can show its legibility and understandability to the lay people. The Mamdani fuzzy inference system shows its advantage in output expression and is used in this project. We derive the following theorem. Advantages of applying such composite inference methods are that such Mamdani ANFIS model has the ability of learning because of differentiability during computation. The sum-product composition provides the following theorem (Yang et al 2000), see in Eq.1 and Eq.2. Final crisp output when using centroid defuzzification is equal to weighted average of centroids of consequent MFs, where:
ψ(ri) = ω(ri) × a (1)
where, ψ(ri) is the weighted factor of ri; ri is the ith fuzzy rule; ω(ri) is the firing strength of ri; a is the area of the
consequent MFs of ri.
ZCOA =
μC′(z)zdz Z
μC′(z)dz
Z
=ω1a1z1+ω2a2z2
ω1a1+ω2a2 (2)
=ω . z1a1 1+ω . z2a2 2
Where, ai and zi are the area and the center of the consequent MFμCi(z) respectively. According to Eq.1 and Eq.2, we
obtain corresponding Mamdani ANFIS model after some modifications.
The overall output f is given. {bi, ci, di} are premise parameters and ai, zi are consequent parameters which need to
adjust. The type of membership functions (MFs) of the inputs are generalized bell functions, each MF has 3 nonlinear parameters; each consequent MF has 2 nonlinear parameters which are area and center of the consequent part. Totally, there are 16 parameters in this example. A general M-ANFIS model can be expressed as Fig.1.
Rule 1: If x is A1 and y is B1, then Z = C1;
Rule 2: If x is A2 and y is B2, then Z = C2.
Fuzzification Inference Implication Aggregation Defuzzification
Fig.1 General Model of Mamdani ANFIS
General Mamdani ANFIS architecture consists of five layers, output of each layer is the following.
Layer 1: Fuzzification layer.
𝑂1,𝑖 = 𝜇𝐴𝑖 𝑥 , 𝑖 =
1,2; (3)
𝑂1,𝑖 = 𝜇𝐵𝑖−2 𝑦 , 𝑖 =
ISSN: 2319-8753
I
nternational
J
ournal of
I
nnovative
R
esearch in
S
cience,
E
ngineering and
T
echnology
(An ISO 3297: 2007 Certified Organization)
Vol. 3, Issue 9, September 2014
𝜇𝐴𝑖 𝑥
= 1
1 + 𝑥 − 𝑐𝑑 𝑖 𝑖
2 𝑏𝑖 (5)
Where {bi, ci, di} is the parameter set referred to as premise parameters.
Layer 2: Inference layer or rule layer
O2,i =ωi=μAi x ×μBi y , i =
1,2. (6) Firing strength ωi is generated with product method.
Layer 3: Implication layer
O3,i =ωio Ci, i =
1,2. (7)
Implication operator is product.
Layer 4: Aggregation layer
O4= ωi o Ci, i =
1,2. (8)
Aggregate operator is sum. The consequent parameters are determined by Ci. If the consequent MF is trapezoidal
membership function, each MF has 4 nonlinear parameters to be adjusted.
Layer 5: defuzzification layer
O5=
D o O4 (9)
UDesign (COA) =
µUDesign .z 𝑛
𝑖=0
µ𝐷𝑒𝑠𝑖𝑔𝑛 𝑛
𝑖=0
The crisp output f is achieved with the defuzzification method, COA (center of area). {bi, ci, di} are premise parameters
. The type of membership functions (MF) of the inputs are generalized bell functions, each MF has 3 nonlinear parameters. If the consequent MF is trapezoidal membership function, then each MF has 4 nonlinear parameters to be adjusted. Total nonlinear parameters in this example are 20. When there is adequate training data, we can achieve M-ANFIS model. We can also test the M model by checking data.
Weight Updating Formula
ISSN: 2319-8753
I
nternational
J
ournal of
I
nnovative
R
esearch in
S
cience,
E
ngineering and
T
echnology
(An ISO 3297: 2007 Certified Organization)
Vol. 3, Issue 9, September 2014
EP = _(k = 1)^N(L)▒(d_k −
x_(l, k) )^2 (10)
Where, dk is the kth component of the pth desired output vector and xl,k is the kth component of the predicted output
vector produced by presenting the pth input vector to the network. The general weight-updating formula is
∆ωji = −η di− xi . xj.X (11)
Where, η is the learning step, di is the desired output for node i, xi is the real output for node i, xj is the input for node i,
X is a Polynomial, usually (xi × (1 − xi)).
III.MODELING OF HEAT EXCHANGER USING M-ANFIS
In order to verify the validity of M-ANFIS model of heat exchanger presented in this paper, we apply this M-ANFIS into the evaluation UDesign of heat exchanger. Through training and testing this model by historical sample data, the
results indicate that this model has ability of mapping heat exchange input data to the value of overall heat transfer coefficient designed UDesign. In the mean time, it is illuminated that M-ANFIS model shows great superiority to ANFIS
model according to the experiments results analysis between them. Sample data in this experiment are supported by power plant expert engineers. All these data are obtained by experts confirm and are reliable.
Overall heat transfer coefficient Designed UDesign Evaluation
In heat exchanger system, UDesign is a quality measure describing operational conditions within a system. Now a day in
power plant evaluation of UDesign is a fundamental factor for reliable performance decision-making. Basic sensor data
(such as Thi- hot water inlet temperature, flow rate of cold water Fci and flow rate of hot water Fhi) are obtained by detector and are effective for UDesign synthetic evaluation. All these data are divided into training data and testing data.
According to potential mapping relation between UDesign and those three indices, we apply this M-ANFIS to UDesign
evaluation. Consequently, experiments by these sample data shows that the M-ANFIS model introduced in this paper provide theoretical basis and a new methodology for multi-inputs synthetic UDesign evaluating.
M-ANFIS model
In ANFIS, the output of each rule is a linear combination of input variables plus a constant term, and the final output is the weighted average of each rule’s output. UDesign reflects the operator’s subjective feelings on the heat exchanger;
obviously the above model can’t reflect the true nature of UDesign because of its linear output. M-ANFIS model is able
to resolve this issue because grades of UDesign in consequent part are expressed as membership function rather than a
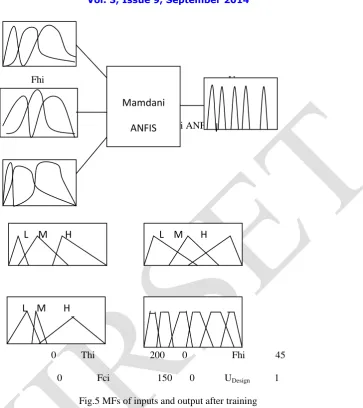
simple linear equation. M model reflects the true meaning of UDesign and logic reasoning of operator. In Fig.3, the
evaluating process of UDesign is illustrated. Consequently, we construct the following model. See in Fig.4. In this model,
x, y, z represents the input, which is Thi, Fci and Fhi. A1-A3 represents membership functions of Thi; B1-B3 represents
ISSN: 2319-8753
I
nternational
J
ournal of
I
nnovative
R
esearch in
S
cience,
E
ngineering and
T
echnology
(An ISO 3297: 2007 Certified Organization)
Vol. 3, Issue 9, September 2014
Fig.2 Structure of M-ANFIS for UDesign Evaluation
Fig.3 Process of Mamdani ANFIS for UDesign Evaluation
represents membership functions of Fhi. D1-D6 represents membership functions of UDesign output. Rule’s format is: Rule 1: If x is A1 and y is B1 and z is C1, then UDesign =A.
In this model, premise parameters are 27 and consequent parameters are 24, which are all nonlinear parameters. We adjust all these parameters in M-ANFIS based on the weights updating formula, which is shown in Eq.16 and Eq.17. All procedures are implemented with Matlab 7.1. The experiment on evaluating UDesign chooses 2000 pairs sample data
(1500 pairs for training and 500 for testing).
The training process takes 0.55 second and 500 steps. The mean square error is 0.0003. The training errors are shown in Fig.6. The desired output and real output of M-ANFIS are in Fig.7. Testing errors are in Fig.8. Average test error is 0.0412. Indices of ANFIS and M-ANFIS are in Table 1. From this table , we can conclude that M-ANFIS model is superior to ANFIS in amount of adjusted parameters, scale of training data ,consume time and testing error. Training error satisfies
Thi
Fhi
Fci
M-ANFIS
U
DesignП
f
A1
A2
A3
П D1
D2
B1
B2
B3
C1
C2
C3 П D2
∑
Fuzzificatio
n
Inference
Implication Aggregation
Defuzzification
ω 2
2
ω 1
ω 27
2
ωi o Di
2
ω1 o D1
2
ω2 o D2
2
x
y
ISSN: 2319-8753
I
nternational
J
ournal of
I
nnovative
R
esearch in
S
cience,
E
ngineering and
T
echnology
(An ISO 3297: 2007 Certified Organization)
Vol. 3, Issue 9, September 2014
Thi
Fhi UDesign
Fci
Fig.4 Mamdani ANFIS
0 Thi 200 0 Fhi 45
0 Fci 150 0 UDesign 1
Fig.5 MFs of inputs and output after training
the requirements. It is clear that ANFIS is more effective subject to small-scale sample data. In the experiment, M-ANFIS, with 6 MFs in the consequent part, reflect the essence of UDesign precisely.
Table 1 Comparison between M-ANFIS and ANFIS M-ANFIS ANFIS Parameter Number 45 150 Training Steps 500 1500 Training Error 0.0003 8.558 e-006 Testing Error 0.0412 0.0897 Time Taken in Seconds 0.55 8.45
IV. EXPERIMENTAL SET-UP
Experiments are conducted on a 1-1 shell and tube heat exchanger. Cold and hot water flow into the shell and tubes respectively can be changed using pneumatic control valves. The inlet flow of the cold water can be varied in the range of 0 - 400 liter per hour (LPH) and that of hot water between 0 and 300 LPH. The flow rate of cold and hot water were measured using flow transmitter. In experimental design, three levels of process parameters hot water inlet temperature,
Mamdani
ANFIS
L M H
L M H
ISSN: 2319-8753
I
nternational
J
ournal of
I
nnovative
R
esearch in
S
cience,
E
ngineering and
T
echnology
(An ISO 3297: 2007 Certified Organization)
Vol. 3, Issue 9, September 2014
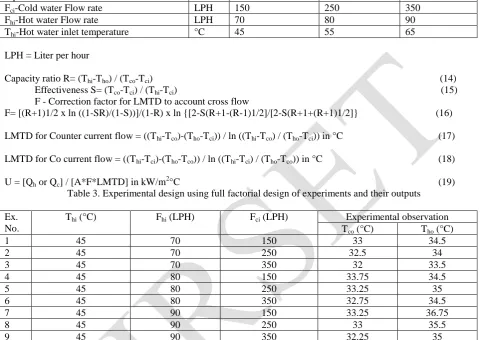
cold water flow rate and hot water flow rate were selected and are tabulated in Table 2. In this study, full factorial design of experiments is used and their experimental combinations of process parameters were presented in Table 3. The overhead tank water temperature is set initially as 45°C, cold water flow rate as 150 LPH and hot water flow rate as 70 LPH. In this set condition, the process was continued until it reaches the steady state. In steady state, the outlet temperatures of cold and hot water are observed. The flow rate of cold water was changed to 250 LPH and 350 LPH and continues the process to reach steady state. Then the outlet temperatures of cold and hot water were observed. The above step can be repeated by changing the hot water flow rate to 80 LPH and 90 LPH and the outlet temperatures were observed. Similarly for the hot water inlet temperature
Fig.6 Training error Fig.7 Desired and real output
Fig.8 Testing error
55°C and 65°C the above procedure was repeated and the readings were observed. Based on the experimental design combination experiments were conducted for water – hot water system and their results are tabulated in the Table 3. The performance of the heat exchanger is assessed by computing overall heat transfer coefficient. The overall heat transfer coefficient is calculated using log mean temperature difference (LMTD) approach because the inlet temperature, outlet temperature and flow rate of the cold and hot water are known. The overall heat transfer coefficient of shell and tube heat exchanger is calculated by using below equations.
Qh = mh Cph (Thi – Tho) in kW (12)
(or) Qc = mc Cpc (Tco – Tci) in kW (13)
Where Qh - heat transfer rate of hot water side, Qc - heat transfer rate of cold water side, mh - mass flow rate of hot
water in kg/hr, mc - mass flow rate of cold water in kg/hr, Cph – specific heat capacity of hot water in kJ/kgK, Cpc –
specific heat capacity of hot water in kJ/kgK, Thi – hot water inlet temperature in °C, Tho - hot water outlet temperature
ISSN: 2319-8753
I
nternational
J
ournal of
I
nnovative
R
esearch in
S
cience,
E
ngineering and
T
echnology
(An ISO 3297: 2007 Certified Organization)
Vol. 3, Issue 9, September 2014
Table 2. Selected parameters and their levels
Input Parameter Unit Level 1 Level 2 Level 3 Fci-Cold water Flow rate LPH 150 250 350
Fhi-Hot water Flow rate LPH 70 80 90
Thi-Hot water inlet temperature °C 45 55 65
LPH = Liter per hour
Capacity ratio R= (Thi-Tho) / (Tco-Tci) (14)
Effectiveness S= (Tco-Tci) / (Thi-Tci) (15)
F - Correction factor for LMTD to account cross flow F= [(R+1)1/2 x ln ((1-SR)/(1-S))]/(1-R) x ln {[2-S(R+1-(R-1)1/2]/[2-S(R+1+(R+1)1/2]} (16)
LMTD for Counter current flow = ((Thi-Tco)-(Tho-Tci)) / ln ((Thi-Tco) / (Tho-Tci)) in °C (17)
LMTD for Co current flow = ((Thi-Tci)-(Tho-Tco)) / ln ((Thi-Tci) / (Tho-Tco)) in °C (18)
U = [Qh or Qc] / [A*F*LMTD] in kW/m2°C (19)
Table 3. Experimental design using full factorial design of experiments and their outputs Ex.
No.
Thi (°C) Fhi (LPH) Fci (LPH) Experimental observation
Tco (°C) Tho (°C)
1 45 70 150 33 34.5
2 45 70 250 32.5 34
3 45 70 350 32 33.5
4 45 80 150 33.75 34.5 5 45 80 250 33.25 35 6 45 80 350 32.75 34.5 7 45 90 150 33.25 36.75
8 45 90 250 33 35.5
9 45 90 350 32.25 35
V. DESIGN AND DEVELOPMENT OF PERFORMANCE ASSESSMENT SYSTEM FOR HEAT EXCHANGER
Design of performance assessment system
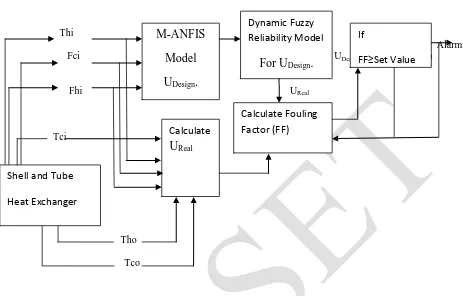
A monitoring system for shell and tube heat exchanger was designed based on the current need to evaluate the performance. In this an M-ANFIS is used to develop the model for predicting the overall heat transfer coefficient
(UDesign) of the design system using secondary measurements temperature and flow rates. Inputs of the developed
network were Thi- hot water inlet temperature , flow rate of cold water Fci and flow rate of hot water Fhi and output was UDesign. Data acquired from the design of experiments were used for training, validation and testing the M-ANFIS
model. Heat transfer coefficient of real system (UReal) is derived using secondary measurements such as Tci, Thi, Tco,
Tho, Fci and Fhi. This system imitate the real time system and used for performance assessment (fouling) of the system.
Measured values of Tci, Thi, Tco, Tho, Fci and Fhi are used to predict the value of UDesign and compute the value of UReal.
FF value is computed with the predicted value of UDesign and the computed value of UReal. It is used to identify the
ISSN: 2319-8753
I
nternational
J
ournal of
I
nnovative
R
esearch in
S
cience,
E
ngineering and
T
echnology
(An ISO 3297: 2007 Certified Organization)
Vol. 3, Issue 9, September 2014
Thi
Alarm Fci Defuzzified UDesign. Else No Alarm
Fhi UReal
Tci
Tho Tco
Fig. 9 Schematic diagram of proposed performance monitoring system
M-ANFIS model development
Thi, Fci and Fhi and one neuron in the output layer, corresponding to the process response UDesign. The topography of
the M-ANFIS model for UDesign is shown in Fig.2. and the developed model in MATLAB environment is shown in
Fig.3.
Table 4. Heat transfer rate (Qh) and overall heat transfer coefficient (U) of experimental data Ex. No Qh (kW) A*F*LMTD (m2.°C) UDesign (kW/m2.°C)
1 0.4114 2.0791 0.1721 2 0.4491 2.1176 0.1843 3 0.4867 2.1640 0.1954 4 0.4041 2.1901 0.1576 5 0.4375 2.0480 0.1851 6 0.4809 2.0791 0.2001 7 0.3536 2.8124 0.1206 8 0.4174 2.4381 0.1607 9 0.4966 2.4601 0.1772
M-ANFIS
Model
U
Design.
Calculate
U
RealCalculate Fouling
Factor (FF)
If
FF≥Set Value
Shell and Tube
Heat Exchanger
Dynamic Fuzzy
Reliability Model
ISSN: 2319-8753
I
nternational
J
ournal of
I
nnovative
R
esearch in
S
cience,
E
ngineering and
T
echnology
(An ISO 3297: 2007 Certified Organization)
Vol. 3, Issue 9, September 2014
Fig.10 Training graph of developed Fig.11 Training Output value graph M-ANFIS model for UDesi of developed M-ANFIS model for UDesign
Fig.12. Validation Output value graph of Fig.13 Testing Output value graph of
developed M- ANFIS model for UDesign developed M-ANFIS model for UDesign
Experimental data set are used to train, validate and test the UDesign network. The variation of MSE during the training is
shown in Fig.10. The graphical output of M-ANFIS is shown in Fig.13 for UDesign.
It is observed that predicted values of UDesign are very closer to the actual values that are shown in Fig.12. It is also
found that maximum absolute error of UDesign is 3.46 % is tabulated in Table 4. This indicates that the model accuracy
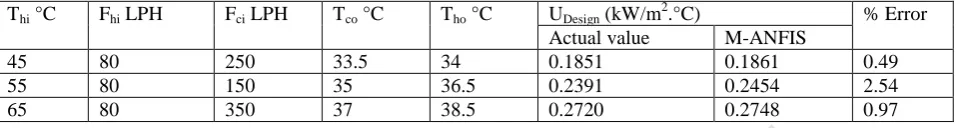
for predicting the process responses is well adequate. For testing, other three new data set are used which do not belong to the training and validation data set. For this testing data set, the overall heat transfer coefficient is predicted using the M-ANFIS model and then compared with the actual values. It is observed that predicted values of UDesign are very
closer to the actual values that are shown in Fig.13. It is also found that maximum absolute error of UDesign is 2.54 % is
presented in Table 6.
Table 5. Experimental results vs M-ANFIS prediction results for validation
Thi °C Fhi LPH Fci LPH Tco °C Tho °C UDesign (kW/m2.°C) % Error
Actual value M-ANFIS
ISSN: 2319-8753
I
nternational
J
ournal of
I
nnovative
R
esearch in
S
cience,
E
ngineering and
T
echnology
(An ISO 3297: 2007 Certified Organization)
Vol. 3, Issue 9, September 2014
Table 6. Experimental results v/s M-ANFIS prediction results for testing data
Thi °C Fhi LPH Fci LPH Tco °C Tho °C UDesign (kW/m2.°C) % Error
Actual value M-ANFIS
45 80 250 33.5 34 0.1851 0.1861 0.49 55 80 150 35 36.5 0.2391 0.2454 2.54 65 80 350 37 38.5 0.2720 0.2748 0.97
This indicates that the model for predicting the process responses is well adequate for generalization. M-ANFIS model for UDesign is developed to study the performance degradation by estimating the fouling of the shell and tube heat
exchanger.
Performance assessment
Effective and majorly applied method for fouling detection is to compare the UDesign and UReal. It cannot be measured
directly and it uses the secondary measurements such as flow rates and temperatures as inputs from the experimental data to estimate it. From the online measured values such as Tci, Thi, Tco, Tho, Fci and Fhi the performance of the heat exchanger is assessed. Thi, Fci and Fhi were used to predict the value of UDesign using developed M-ANFIS model. The
consequent part of M-ANFIS is fuzzy in nature and its defuzzyfication gives the crisp value of UDesign. UReal value is
computed using LMTD approach with Tci, Thi, Tco, Tho, Fci and Fhi. The performance of heat exchanger is assessed by comparing the UReal value with UDesign value. The decrease in UReal value indicates the degradation of performance
by formation of fouling. In this, performance degradation or fouling is estimated using FF approach and this will indicate the degree of fouling. The degradation in performance is expressed by the FF, as calculated by the equation: FF= [(1/UReal)-(1/UDesign)] (20)
Here
UDesign is predicted using M-ANFIS model with Thi, Fci and Fhi.
UReal value is computed using LMTD approach with Tci, Thi, Tco, Tho, Fci and Fhi.
The FF value of heat exchanger is calculated using the equation (21). In design stage, the allowable fouling resistance i.e. FF is specified for all the heat exchangers by manufacturer’s to avoid frequent cleaning or maintenance. The tolerance value of FF is obtained from the specification or from the data book. If the estimated FF value is greater than or equal to set value of FF, it gives warning message for cleaning or maintenance and continues the operation. Otherwise, no warning message is given and the operation continues.
VI. DYNAMIC FUZZY RELIABILITY MODELING
The success and failure are treated as fuzzy events, which contains continuous performance characteristic values exhibiting different degrees of success or failure. The dynamic fuzzy reliability of a component depends on time and it can be evaluated as the probability of the fuzzy event of success (Zadeh, 1968). Thus fuzzy reliability is defined as: RSUDesign= Pr [fuzzy success] = ∫ µSUDesign (y) dF (y(t) = E [µSUDesign (Y)] (21)
Similarly Fuzzy unreliability is defined in terms of the fuzzy failure event as:
RFUDesign= Pr [fuzzy failure] = ∫ µFUDesign (y) dF(y(t)= E[µFUDesign (Y)] (22)
µFUDesign (y) = 1- µSUDesign (y), and E [µSUDesign (Y)] is a function of time.
µSUDesign = Membership function of overall heat transfer coefficient (UDesign) for success
µFUDesign = Membership function of overall heat transfer coefficient (UDesign)for failure
where F(y(t) is the cumulative distribution function of the performance characteristic variable at a given time point. The fuzzy reliability definition degenerates to the classic binary reliability model when the membership function of fuzzy success event is substituted with the characteristic function of a crisp success event. This fuzzy reliability definition is also an analog to the system’s performance measure based on the state expectation definition given by E[X] = 𝑀 𝑖 ∗ Pr[𝑋 = 𝑖]
ISSN: 2319-8753
I
nternational
J
ournal of
I
nnovative
R
esearch in
S
cience,
E
ngineering and
T
echnology
(An ISO 3297: 2007 Certified Organization)
Vol. 3, Issue 9, September 2014
VII. RESULTS AND DISCUSSION
The proposed performance monitoring scheme is implemented in the developed experimental setup located in the process lab. The data of heat exchanger such as Tci, Tco, Thi, Tho, Fci and Fhi are captured by running the MATLAB
program in PC, which is connected to the data acquisition system. The system initially predicts the UDesign value with
M-ANFIS model and dynamic fuzzy reliability model and computes the UReal value through the experimental observed
values. The dynamic reliability for success and failure events of UDesign are calculated using dynamic reliability
modeling formulae.Then the system computed the FF value using UReal and UDesign values. Based on the FF value the
system gives the information to the operator. The results of the system for typical condition are shown in table 6. Here for FF<Set FF=Not Alarming, and for FF>Set FF=Alarming.
Table7. FF Calculation S.N
o
UDesign By
M-ANFIS & Fuzzy Reliability model
UReal 1/ UDesign 1/UReal
FF=(5)-(4)
Set FF (Allowable)
Alarm Condition
(1) (2) (3) (4) (5) (6) (7) (8) 1 0.1721 0.17209 58.1057 58.1079 0.0022 0.0025 Not Alarming 2 0.1843 0.18428 54.2593 54.2631 0.0038 0.0025 Alarming 3 0.1954 0.19538 51.1770 51.1799 0.0029 0.0025 Alarming 4 0.1576 0.15759 63.4517 63.4530 0.0013 0.0025 Not Alarming 5 0.1851 0.18509 54.0248 54.0267 0.0019 0.0025 Not Alarming 6 0.2001 0.20008 49.9750 49.9782 0.0032 0.0025 Alarming 7 0.1206 0.12059 82.9187 82.9238 0.0051 0.0025 Alarming 8 0.1607 0.16069 62.2277 62.2285 0.0008 0.0025 Not Alarming 9 0.1772 0.17719 56.4334 56.4351 0.0017 0.0025 Not Alarming 10 0.2368 0.23677 42.2297 42.2333 0.0036 0.0025 Alarming 11 0.2417 0.24167 41.3736 41.3780 0.0044 0.0025 Alarming 12 0.2497 0.24966 40.0480 40.0542 0.0062 0.0025 Alarming 13 0.2391 0.23908 41.8235 41.8256 0.0021 0.0025 Not Alarming 14 0.2748 0.27478 36.3901 36.3925 0.0024 0.0025 Not Alarming 15 0.2853 0.28525 35.0508 35.0569 0.0061 0.0025 Alarming
From the results it is identified that the heat exchanger performance is within the tolerance value (set by field engineer/maintenance engineer) of FF. It shows no warning message to field engineers. Another typical condition results are shown in table 6. This inferred that the performance of the heat exchanger is above the tolerance value of FF. It needs immediate maintenance or corrective action to recover the heat transfer efficiency. This gives intimation to the operator for planning maintenance well ahead to minimize operational disturbance due to unplanned shutdowns.
VIII. CONCLUSION
ISSN: 2319-8753
I
nternational
J
ournal of
I
nnovative
R
esearch in
S
cience,
E
ngineering and
T
echnology
(An ISO 3297: 2007 Certified Organization)
Vol. 3, Issue 9, September 2014
M-ANFIS into Performance Assessment of Heat Exchanger. The experimental results show that M-ANFIS model is superior to ANFIS in amount of adjusted parameters, scale of training data ,consume time and testing error.
Experiments were conducted on a 1-1 shell and tube heat exchanger with different cold water flow rates, hot water flow rate, and hot water inlet temperature to assess the performance of the system. The experimental observations were incorporated into the M-ANFIS model development. A M-ANFIS model was developed to predict overall heat transfer coefficient UDesign of the design heat exchanger system and the model was trained, validated and tested for
generalization. Good agreement was identified between the predictive model results and the experimental results. M-ANFIS model was used to predict the value UDesign and UReal was derived from measured values. A dynamic fuzzy
reliability model is proposed to evaluate the reliable value of UDesign for the reliable performance assessment of heat
exchanger in terms of FF. It is shown that fuzzy modeling is more realistic for systems with continuous performance levels. FF is found from the predicted UDesign and UReal value. From the estimated FF value, the performance
degradation/fouling effect was within the tolerance limit (margin) or not is identified. Based on the results, degree of fouling and precaution information like warning or maintenance was given. Further, it needs intelligent approach to do fouling analysis and maintenance decision.
REFERENCES
1. Mandavgane S. A., Pandharipande S. L., “Application of optimum ANN architecture for heat exchanger modeling”. Indian Journal of Chemical Technology, vol.13, pp. 634-639, 2006.
2. Ozcelik Y., “Exergetic optimization of shell and tube heat exchangers using genetic based algorithm”. Applied Thermal Engineering, vol.27, pp. 1849-1856, 2007.
3. Radhakrishnan V. R., Ramasamy M., Zabiri H., Thanh V. D., Tahir N. M., Mukhtar H., Hamdi M. R., Ramli N., “Heat exchanger fouling model and preventive maintenance scheduling tool”.
4. Applied Thermal Engineering, , vol.27, pp. 2791-2802, 2007
5. Vijaysai P., Osborn M.D., Au S.S., Ravi Chandra Reddy K., “Prediction of performance assessment of heat exchangers for proactive remediation”. IEEE transaction, pp. 3055-3060, 2006.
6. Riverol C., Napolitano V., “Estimation of fouling in a plate heat exchanger through the application of neural networks”.Journal of Chemical Technology and Biotechnology, vol. 80, pp. 594-600, 2005.
7. Thirumarimurugan M., Kannadasan T., Ramasamy E., “Performance Analysis of Shell and Tube Heat Exchanger Using Miscible System”. American Journal of Applied Science, vol. 5, pp. 548-552, 2008.
8. Wang Q., Xie G., Zeng M., Luo L., “Prediction of heat transfer rates for shell and tube heat exchangers by artificial neural networks approach”. Journal of Thermal Science, vol. 15, pp. 257- 262, 2006
9. Zhao X., “Performance of a single-row heat exchanger at low in-tube flow rates”. Master Thesis, University of Notre Dame, 1995.
10. Xie G.N., Wang Q.W., Zeng M., Luo L.Q.,“Heat transfer analysis for shell-and-tube heat exchangers with experimental data by artificial neural networks approach”. Applied Thermal Engineering, vol. 27, pp. 1096–1104, 2007.
11. Jambunathan K., Hartle S. L., Ashforth-Frost S., Fontama V., “Evaluating heat transfer coefficients using neural networks”, International Journal of Heat and Mass Transfer, vol. 39, pp. 2329–2332,1996.