The Influence of Surface Roughness on the Flow Fields Generated by an
Oscillating Cantilever
CiaranConway1,and JeffPunch1
1Stokes Laboratories, University of Limerick, Ireland
Abstract. With the current trend of miniaturisation of electronic devices, piezoelectric fans have attracted increasing interest as a means of inducing forced convection cooling, instead of traditional rotary solutions. Although there exists an abundance of research on various piezo-actuated flapping fans in the literature, the geometries of these fans all consist of a smooth rectangular cross section with thicknesses typically of the order of 100µm. The focus of these studies has primarily been on variables such as frequency, amplitude and, in some cases, resonance mode. It is generally noted that the induced flow dynamics are a direct consequence of the pressure differential at the fan tip as well as the pressure driven ‘over the top’ vortices generated at the upper
and lower edges of the fan. Rough surfaces such as golf ball dimples or vortex generators on an aircraft wing have proven to be beneficial by tripping the boundary layer and energising the adjacent airflow. This paper aims to examine the influence of surface roughness on the airflow generation of a flapping fan, and to determine if the induced wake can be manipulated or enhanced by energising the airflow around the fan tip. Particle-Image Velocimetry (PIV) is carried out on mechanically oscillated rigid fans with surfaces consisting of protruding pillars and dimples. A smooth rigid fan surface is also investigated as a control. No significant difference
was noted between the smooth and roughened fans through observation of the induced flow fields. Both fans produced results that were largely consistent with the existing literature on oscillating cantilevers. The results of this paper may be used to inform the design of piezoelectric fans and to aid in understanding the complex aerodynamics inherent in flapping wing flight.
1 Introduction
Advances in electronics, coupled with modern
micro-fabrication methods, have accelerated the trend of miniaturisation for many compact electrical devices. This has resulted in increasing power densities and significantly high heat fluxes that can be generated when in use. Existing rotary fan solutions may struggle to provide adequate cooling due to strict size and space requirements within these devices. As an alternative, oscillating cantilevers, or piezoelectric fans, are seen as a promising thermal solution due to their low power, frictionless air moving capabilities [1].
Research on piezoelectric fans was first carried out in the 1970’s by Toda [2] who presented both a theoretical model and experimental analysis of the airflow induced by a resonating piezoelectric fan. Later work by Toda and Osaka [3] first proposed the use of piezoelectric fans for
thermal management in electronic devices. Acikalin et
al. [4] investigated the feasibility of using piezoelectric
fans to cool portable electronic devices. In this study, a heat source was placed into an enclosure of similar dimensions to a mobile phone and subsequently cooled by a piezoelectric fan operating in various orientations. A heat transfer enhancement of over 100% was recorded when operating in the horizontal orientation relative to
e-mail: [email protected]
passive cooling. Kimber and Garimella [5] investigated the influence of variables such as amplitude, frequency and fan height on the thermal performance of piezoelectric fans oscillating normal to a heated surface. It was found that the performance of a given fan can be described in terms of oscillation frequency and amplitude only, with frequency being more influential on maximum heat transfer rates.
Many studies have also focused entirely on the
fluid mechanics of oscillating cantilevers. Kim et
al. [6] conducted flow visualisation and velocity field
measurements on a piezo-actuated oscillating cantilever
confined between two end plates. They noted the
development of two counter-rotating vortices generated by
the pressure differentials across the tip of the fan as it
oscillated over a period of one cycle. The velocity between these vortices reached over four times the maximum fan tip velocity and resulted in a jet-like flow originating at the fan tip. The three-dimensional nature of oscillating cantilever aerodynamics was investigated by Agarwal
The majority of the literature on the fluid mechanics of oscillating cantilevers is mainly conducted on smooth surfaced blades where the primary variables under investigation are vibrating frequency and amplitude. There is relatively little focus on the influence of surface roughness on the induced flow dynamics of oscillating cantilevers. In many fluid mechanics applications, surface structures are used to change the local flow dynamics. A well known example of this is the dimpled surface of a golf ball. The dimples trip the boundary layer around the ball and transition it to a turbulent regime. The energised flow adjacent to the surface delays the separation of airflow from the ball and thus reduces pressure drag, allowing it to travel a further distance [7]. Similarly, the presence of protruding vortex generators on aircraft wings can also promote separation and delay the onset of aerodyamic stall. This study considers the influence of surface roughness on the aerodynamics of rigid fans that are mechanically oscillated at a fixed frequency and amplitude. Two surface roughnesses are considered. The first is a dimpled surface similar to that of a golf ball. The second is a reverse of the dimpled surface with protruding pillars. The induced flow fields are recorded and visualised using Particle-Image Velocimetry (PIV). The setup and procedure for the PIV experimentation is described in the next section and, following this, the PIV results are
presented. Vorticity, ω = ∇ ×v, is used to highlight
and quantify the flow structures generated by the fans as they oscillate, whilst wake regions are visualised through the use of velocity magnitude plots. The results of this work may inform the design of oscillating fans for use in thermal management applications, as well as contribute to the literature on the complex phenomenon of flapping wing flight.
2 Experimental Method
In this section, the experimental apparatus used to mechanically oscillate the fans is described. Following this, the geometries of the two fans under investigation in this study are defined, and the final part of this section outlines the experimental methodology.
2.1 Mechanical Oscillator
Mechanically oscillated rigid fans were used in this study in order to achieve desired amplitudes, frequencies
and surface roughness patterns. A custom designed
mechanical oscillator was used which converts rotary motion into oscillatory motion of the fan tips. The rotary motion – provided by a Maxon A-max32 brushed motor – was initially converted into reciprocating linear motion of a 3D-printed driveshaft. The driveshaft linearly displaces the “dead” side of the oscillating fan relative to a fixed pivot point thus inducing an oscillation at the fan tip; this is illustrated in Figure 1. Oscillating frequency was
controlled by the motor RPM where f = RPM/60. Tip
amplitude depended both on the length of the fan and the distance between the 3D-printed driveshaft and fixed pivot point.
Fig. 1.Mechanical oscillator and method of oscillation
2.2 Fan Characterisation
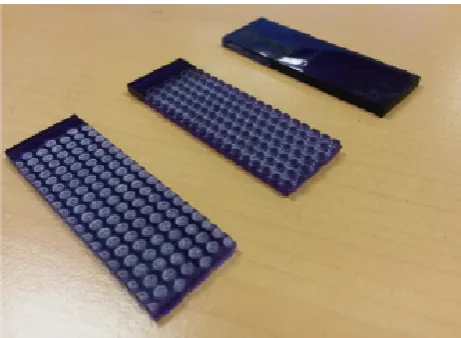
The fans in this work were cut from 2.8 mm thick acrylic sheeting. The fans were rectangular in shape with cross-sectional dimensions of 60 mm x 20 mm. A surface roughness was imparted on two of the fans by etching the material with a GCC LaserPro X380 laser cutter. A diagonal grid of circular dimples was etched on to both sides of one fan as depicted in Figure 2. A reverse of this pattern was etched onto another fan which created a series of circular protrusions, or pillars. The depth of the etchings on the roughened fans was approximately 1 mm. No surface roughness was imparted on the final fan so the smooth surface of the acrylic could be used as a control. Each fan was placed in a custom designed 3D-printed holder during experimentation.
Fig. 2. Tested fans with dimpled surface (nearest), protruding pillars (middle) and smooth surface (furthest)
The point about which the fans were rotated by the oscillating mechanism was 47 mm behind the fan tip. The fans were oscillated at a frequency of 40 Hz with a tip-to-tip amplitude of 14 mm. This resulted in a tip Reynolds number of 4,480 according to Equation 1,
wheref,a,c, andvare oscillating frequency, oscillating
amplitude, fan width and kinematic viscosity respectively.
Re=2πf ac
The majority of the literature on the fluid mechanics of oscillating cantilevers is mainly conducted on smooth surfaced blades where the primary variables under investigation are vibrating frequency and amplitude. There is relatively little focus on the influence of surface roughness on the induced flow dynamics of oscillating cantilevers. In many fluid mechanics applications, surface structures are used to change the local flow dynamics. A well known example of this is the dimpled surface of a golf ball. The dimples trip the boundary layer around the ball and transition it to a turbulent regime. The energised flow adjacent to the surface delays the separation of airflow from the ball and thus reduces pressure drag, allowing it to travel a further distance [7]. Similarly, the presence of protruding vortex generators on aircraft wings can also promote separation and delay the onset of aerodyamic stall. This study considers the influence of surface roughness on the aerodynamics of rigid fans that are mechanically oscillated at a fixed frequency and amplitude. Two surface roughnesses are considered. The first is a dimpled surface similar to that of a golf ball. The second is a reverse of the dimpled surface with protruding pillars. The induced flow fields are recorded and visualised using Particle-Image Velocimetry (PIV). The setup and procedure for the PIV experimentation is described in the next section and, following this, the PIV results are
presented. Vorticity, ω = ∇ ×v, is used to highlight
and quantify the flow structures generated by the fans as they oscillate, whilst wake regions are visualised through the use of velocity magnitude plots. The results of this work may inform the design of oscillating fans for use in thermal management applications, as well as contribute to the literature on the complex phenomenon of flapping wing flight.
2 Experimental Method
In this section, the experimental apparatus used to mechanically oscillate the fans is described. Following this, the geometries of the two fans under investigation in this study are defined, and the final part of this section outlines the experimental methodology.
2.1 Mechanical Oscillator
Mechanically oscillated rigid fans were used in this study in order to achieve desired amplitudes, frequencies
and surface roughness patterns. A custom designed
mechanical oscillator was used which converts rotary motion into oscillatory motion of the fan tips. The rotary motion – provided by a Maxon A-max32 brushed motor – was initially converted into reciprocating linear motion of a 3D-printed driveshaft. The driveshaft linearly displaces the “dead” side of the oscillating fan relative to a fixed pivot point thus inducing an oscillation at the fan tip; this is illustrated in Figure 1. Oscillating frequency was
controlled by the motor RPM where f = RPM/60. Tip
amplitude depended both on the length of the fan and the distance between the 3D-printed driveshaft and fixed pivot point.
Fig. 1.Mechanical oscillator and method of oscillation
2.2 Fan Characterisation
The fans in this work were cut from 2.8 mm thick acrylic sheeting. The fans were rectangular in shape with cross-sectional dimensions of 60 mm x 20 mm. A surface roughness was imparted on two of the fans by etching the material with a GCC LaserPro X380 laser cutter. A diagonal grid of circular dimples was etched on to both sides of one fan as depicted in Figure 2. A reverse of this pattern was etched onto another fan which created a series of circular protrusions, or pillars. The depth of the etchings on the roughened fans was approximately 1 mm. No surface roughness was imparted on the final fan so the smooth surface of the acrylic could be used as a control. Each fan was placed in a custom designed 3D-printed holder during experimentation.
Fig. 2. Tested fans with dimpled surface (nearest), protruding pillars (middle) and smooth surface (furthest)
The point about which the fans were rotated by the oscillating mechanism was 47 mm behind the fan tip. The fans were oscillated at a frequency of 40 Hz with a tip-to-tip amplitude of 14 mm. This resulted in a tip Reynolds number of 4,480 according to Equation 1,
wheref,a,c, andvare oscillating frequency, oscillating
amplitude, fan width and kinematic viscosity respectively.
Re=2πf ac
v (1)
2.3 Flow Field Measurement
The velocity fields induced by the oscillating fans were recorded using PIV. A Quantel Big Sky Laser was used to generated a double pulsed, 532 nm wavelength laser sheet which illuminated the seeded flow field. Seeding was provided by water based tracer particles issued from a Martin Magnum 2500 Hz hazer. A TSI PowerView Plus 2MP CCD camera recorded a series of image pairs
of the illuminated flowfield. The camera and laser
were synchronised using a TSI Laser Pulse Synchroniser (Model no: 610035). The mechanism was placed within an acrylic enclosure with dimensions of 880 x 540 x 600
mm to protect against external air currents affecting the
induced flow fields. The distance between the fan and the nearest wall was 20 cm therefore the fan was considered to be unconfined. The enclosure was perforated to allow air to enter and exit the system, and it had an open slot at one side to allow the laser sheet to enter unobstructed.
Phase-locked image pairs were obtained by triggering the PIV system to capture images at various points of the fan oscillating cycle. A 5V TTL pulse emitted from the motor corresponding to each revolution was sent to the TSI synchroniser as a triggering signal.
Desired phase angles were achieved by setting appropriate time delays between the trigger signal and the beginning of the resulting image capture sequence. Image pairs were recorded at incremental time delays of 1 ms from 0 up to 24 ms. This corresponded to one period of the fan motion when oscillating at 40 Hz.
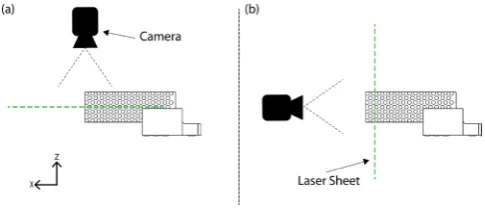
PIV images were recorded for two different
configurations of the oscillating fan. In the first
configuration, the camera was placed normal to the oscillating plane (Figure 3(a)), resulting in a plan view of
the induced flow fields in thex-y plane. The laser sheet
intersected the fan at mid-chord in this configuration. In the second configuration, the camera was positioned
such that it captured flow dynamics in the y-z plane as
shown in Figure 3(b). Here, the laser sheet was positioned 5 mm behind the fan tip. The recorded image pairs were processed with a multi-pass, image deformation processing algorithm using TSI Insight4G software.
Fig. 3. PIV configurations: (a) laser sheet, oscillation plane, and camera image plane are all parallel to capture data in thex-y
plane; (b) laser sheet and camera image plane are normal to the oscillation plane to capture data in they-zplane
3 Results and Discussion
The primary objective of this study is investigate the influence of surface roughness on the flow fields induced by rigid, oscillating fans. The PIV results are initially
presented in the x-y plane though vorticity and velocity
magnitude plots. The three-dimensional nature of the flow
is subsequently displayed through measurements in they-z
plane.
3.1 x-yPlane Measurements
Vorticity plots for the smooth surfaced fan are largely consistent with existing literature on oscillating fan aerodynamics [1, 6, 8]. Vortex formation is driven by
the pressure differential across the fan tip. This pressure
differential arises due to a pressure increase on the leading
surface of the fan as it accelerates from points of zero
velocity (φ =90◦/270◦) to points of maximum velocity
(φ = 0◦/180◦). Figure 4(a) shows the smooth fan at a
phase angle of approximately 300◦. Here, the fan is
accelerating towards a phase angle of 360◦/0◦. Airflow
from the high pressure leading surface of the fan is seen to flow around the fan tip to the low pressure surface resulting in the generation of a counter-clockwise tip vortex. The
clockwise vortex shed from the previous half period (90◦
→270◦) is visible adjacent to the fan tip.
There is constructive interference in the region between the shed vortex and the developing vortex at the fan tip whereby a high velocity jet flow is induced.
As the fan accelerates through a phase angle of φ =0◦,
the counter-clockwise tip vortex develops as it remains attached to the fan structure. The shed clockwise vortex from the previous half period propagates away from the fan and its energy dissipates due to shear with the
stationary ambient air. Atφ=90◦in Figure 4(c), similar
flow behaviours to those of φ = 300◦ are observed.
The counter-clockwise tip vortex has been shed and a new clockwise vortex has begun to develop as the fan
accelerates away from the point of zero velocity at φ =
270◦. Again, a high velocty jet region is visible between
the two vortices that helps to generate jet-like wakes emanating from the fan tip as seen in the time-averaged results.
The time-averaged velocity flow field generated by the smooth oscillating fan is displayed in Figure 5. There is a clear symmetry in the induced flow field, consistent
with the findings of Stafford and Jeffers [9] and Bidakhvidi
et al. [10]. Steamlines reveal a large inflow region in front of the fan tip from which air is drawn before being expelled by the oscillating fan into two high velocity lateral jet regions. The direction of these jet regions is
approximately 90◦ to the initial inflow direction with no
apparent airflow generated by the fan in the positive x
Fig. 4.Vorticity plots for the smooth fan at phase angles of (a) 300◦, (b) 12◦and (c) 127◦in thex-yplane
are a consequence of the fan thickness (2.8 mm) which is significantly larger than the thicknesses of piezofans investigated in literature (O ≈ 0.1 mm). The effect of thickness on the flowfields induced by oscillating fans is investigated further by Conway et al. [14]. Regions of maximum average velocity in Figure 5 occur immediately adjacent to the fan tip at points of maximum deflection (zero tip velocity). This is consistent with the high velocity regions noted in the previous section between clockwise and counter-clockwise rotating vortices.
Fig. 5. Time-averaged velocity magnitude plot for the smooth fan in thex-yplane
The rough surfaced fans shown in Figure 6 give similar results to those of the smooth fan. Figure 7 shows the development of tip vortices for the two roughened fans in this study. A counter-clockwise, pressure driven tip vortex is again developed as the fans move from φ = 270◦ toφ =90◦. Vorticity values are largely consistent with the smooth fan. Maximum vorticity magnitudes of approximately 2.5/s were recorded for all three fans indicating that the induced flow structures are entirely pressure driven, with surface roughness having little influence at this Reynolds number. The time-averaged velocity magnitude plots for the roughened fans displayed in Figure 6 again bear similarities to the smooth fan.
Fig. 6. Time-averaged velocity magnitude plots for (a) dimpled surface and (b) protruding pillar surface in thex-yplane
3.2 y-zPlane Measurements
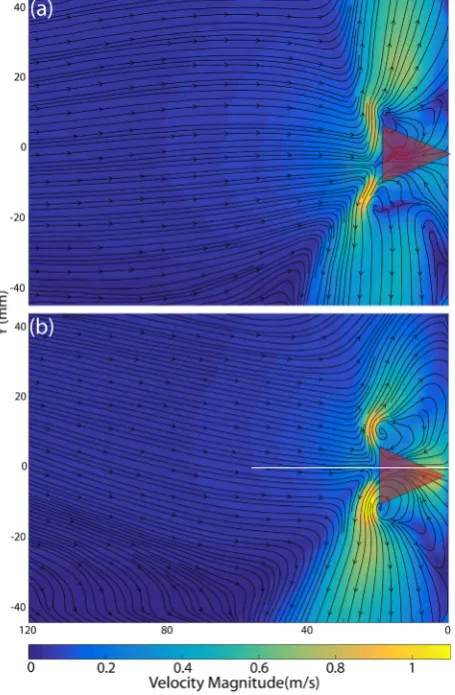
The time-averaged velocity magnitude plots in the y-z plane for the smooth and rough surfaced fans are displayed in Figure 8 and Figure 9 respectively. The shadow on the right hand side of the plots is a consequence of the opaque material from which the fans were fabricated. Symmetry is therefore assumed and the detail on the left side of the fan is considered to be representative of the time-averaged fluid mechanics on both sides of the fan as it oscillates.
1 -1 0 0.5 -0.5 1.5 2 2.5 -1.5 -2 -2.5 Vor ticit y(1/s) Dimples 0 0 2 -0 4 -0 6 -0 8 -0 0 1 --40 -30 -20 -10 0 10 20 30 40 Dimples 0 0 2 -0 4 -0 6 -0 8-0 0 1 --40 -30 -20 -10 0 10 20 30 40 Dimples 0 0 2 -0 4 -0 6 -0 8 -0 0 1 --40 -30 -20 -10 0 10 20 30 40 Protrusions 0 0 2 -0 4 -0 6 -0 8 -0 0 1 --40 -30 -20 -10 0 10 20 30 40 Protrusions 0 0 2 -0 4 -0 6 -0 8-0 0 1 --40 -30 -20 -10 0 10 20 30 40 Protrusions 0 0 2 -0 4 -0 6-0 8 -0 0 1 --40 -30 -20 -10 0 10 20 30 40 0 40 80 120 0 40 80 120 0 40 80 120 0 20 40 -40 -20 0 20 40 -40 -20 (mm) (mm)
Remnants of clockwise tip vortex
(b)
(a) (c)
(d) (e) (f)
Shed clockwise vortex
High velocity fluid between counter-rotating vortices
Φ = 300o Φ = 12o Φ = 127o
Fig. 7.Vorticity plots for the roughened surface fans in thex-yplane: (a-c) dimpled surface and (d-f) protruding pillars
Fig. 8. Time-averaged velocity magnitude profiles in they-z
plane for smooth surfaced fan
As shown in Figure 8 and Figure 9, each fan generates strong lateral flow components that are symmetrical in nature – consistent with the time-averaged velocity plots in thex-yplane. The roughened suface fans of Figure 9 appear to generate a slightly angled flow field. This may be an effect of the unaligned surface structures on each side of the fan, as the smooth surfaced fan of Figure 8 produces a relatively unbiased lateral wake. The fan with the protruding surface structures appears to generate the smallest wake (Figure 9(b)). The average velocity reaches a maximum of approximately 1.5 m/s in the immediate vicinity of the fan structure. This is slightly larger than the maximum velocites of approximately 1 m/s surrounding the smooth and dimpled fans. Downstream of the fan structures, the jet velocities are largely consistent for all three of the tested fans at 0.5 – 0.7 m/s.
Streamlines within the plots in Figure 9 illustrate the development of the flow fields that are induced by the fans. The pressure-driven counter rotating vortices generated at
Fig. 9. Time-averaged velocity magnitude profiles in they-z
plane for the fans with (a) dimpled surface and (b) protrusions
Fig. 10.Vorticity plots in they-zplane for the smooth fan as it moves fromφ=141◦toφ=228◦
into the lateral jets through the influence of viscous shear. The streamlines also highlight the presence of saddle points at the lower velocity regions to the left of the fan structures in Figures 8 and 9. The low velocity regions and diverging streamlines indicate out-of-plane flow components parallel to the span of the fan blades.
Spanwise vorticity results for the smooth fan as it
moves from φ = 90◦ to φ = 270◦ are presented in
Figure 10. Pressure driven vortices are generated at the upper and lower edges of the fan and develop as the fan accelerates. The vortices appear to partly separate from the fan at the midpoint of its half period sweep however the cores remain attached, adjacent to the fan surfaces with decreasing vorticity as the fan decelerates. The roughened fans produced identical results.
4 Conclusions
PIV experimentation was carried out on three oscillating
fans with different surface roughnesses. Flow fields were
recorded in two planes to capture the three-dimensional nature of oscillating fan aerodynamics. The development and behaviour of the vortices around the fan structure was similar for each of the three fans tested, and these results were also consistent with the literature on piezoelectric fan aerodynamics. The development and propagation of the pressure-driven vortices surrounding the fan blades did not appear to be inhibited or aided by the presence of the dimpled and protruding surface structures. Time-averaged velocity plots revealed similar wake profiles generated
by the fans in both the x-y plane and y-z planes. The
time-averaged wakes are lateral in direction with little disturbance ahead of the fan tip. This is a consequence of the relatively thick fan structures used in this study in contrast to the significantly thinner blades found in the
literature. There appears to be no noticeable difference
in the flow fields induced by the surface roughened fans in comparison to the smooth surfaced fan at the tested Reynolds number. This would suggest that flow structures and flow fields generated by the fans at this Reynolds
number are purely a result of pressure differentials across
the surfaces of the fans as they oscillate.
Acknowledgements
The author acknowledges the financial support of the Irish Research Council (IRC) for funding under the Government of Ireland Postgraduate Scholarship Scheme:
Project ID GOIP/2014/1480.
References
1. A. Agarwal, K.P. Nolan, J. Stafford, N. Jeffers,
Journal of Fluids and Structures70, 450 (2017)
2. M. Toda, Ferroelectrics22, 911 (1978)
3. M. Toda, S. Osaka,6, 1171 (1979)
4. T. Açikalin, S.M. Wait, S.V. Garimella, A. Raman,
Heat Transfer Engineering25, 4 (2004)
5. M. Kimber, S.V. Garimella, International Journal of
Heat and Mass Transfer52, 4470 (2009)
6. Y.H. Kim, S.T. Wereley, C.H. Chun, Physics of Fluids
16, 145 (2004)
7. J.A. Scobie, C.M. Sangan, G.D. Lock, Procedia
Engineering72, 738 (2014), the Engineering of Sport
10
8. M. Choi, C. Cierpka, Y.H. Kim, Journal of Fluids and
Structures31, 67 (2012)
9. J. Stafford, N. Jeffers, IEEE Transactions on
Components, Packaging and Manufacturing
Technology7, 751 (2017)
10. M.A. Bidakhvidi, R. Shirzadeh, G. Steenackers,
S. Vanlanduit, Experiments in Fluids54(2013)
11. T. Açikalin, S.V. Garimella, A. Raman, J. Petroski,
International Journal of Heat and Fluid Flow28, 806
(2007)
12. C.N. Lin, International Journal of Heat and Mass
Transfer55, 3043 (2012)
13. M.K. Abdullah, B.H. Murni, M.Z. Abdullah, M.a.
Mujeebu, F. Hussin, H. Yusoff, N.C. Ismail, K.a.
Ahmad, Z. Mohd Ripin, Isi Bilimi Ve Teknigi Dergisi/
Journal of Thermal Science and Technology 32, 41
(2012)
14. C. Conway, N. Jeffers, J. Punch, ‘The Influence of