Query-Driven Visualization of Large Data Sets
Kurt Stockinger∗ John Shalf† Kesheng Wu‡ E. Wes Bethel§
Computational Research Division Lawrence Berkeley National Laboratory
University of California
ABSTRACT
We present a practical and general-purpose approach to large and complex visual data analysis where visualization processing, ren-dering and subsequent human interpretation is constrained to the subset of data deemed interesting by the user. In many scien-tific data analysis applications, “interesting” data can be defined by compound Boolean range queries of the form(temperature>
1000)AND (70<pressure<90). As data sizes grow larger, a
central challenge is to answer such queries as efficiently as possible. Prior work in the visualization community has focused on answer-ing range queries for scalar fields within the context of acceleratanswer-ing the search phase of isosurface algorithms. In contrast, our work de-scribes an approach that leverages state-of-the-art indexing technol-ogy from the scientific data management community called “bitmap indexing.” Our implementation, which we call “DEX” (short for dextrous data explorer), uses bitmap indexing to efficiently answer multivariate, multidimensional data queries to provide input to a visualization pipeline. We present an analysis overview and bench-mark results that show bitmap indexing offers significant storage and performance improvements when compared to previous ap-proaches for accelerating the search phase of isosurface algorithms. More importantly, since bitmap indexing supports complex multi-dimensional, multivariate range queries, it is more generally appli-cable to scientific data visualization and analysis problems. In ad-dition to benchmark performance and analysis, we apply DEX to a typical scientific visualization problem encountered in combustion simulation data analysis.
CR Categories: I.3.6 [Computer Graphics]: Methodology and Techniques—Graphics data structures and data types H.3.3 [Infor-mation Systems]: Infor[Infor-mation Storage and Retrieval—Infor[Infor-mation Filtering
Keywords: query-driven visualization, visual analytics, bitmap index, multivariate visualization, large data visualization, data anal-ysis, scientific data management
1 INTRODUCTION
Many application scientists attending a recent series of workshops held by the Scientific Data Management community1have stated that information management and analysis is a limiting factor in scientific research. Simply put, there is too much data to analyze or visualize. Our work is motivated by the desire to provide new capabilities to meet the “large data” challenge. Our work diverges from previous efforts in large- and complex-data visualization in
∗[email protected] †[email protected] ‡[email protected] §[email protected]
that we combine state-of-the-art scientific data management tech-nology with visualization tools to implement a methodology known as “query-driven visualization.” The fundamental premise of our work is to focus visualization processing and subsequent visual in-terpretation only on data deemed to be “interesting” as defined by the user and to use state-of-the-art technology from the scientific data management community to implement the data query portion of the processing pipeline.
One of the significant challenges from the field of data manage-ment is data searching. Many approaches have been used over the years, ranging from well-known constructs like B-trees to complex indexing techniques. The visualization community has tackled this problem as well, notably in the topic of isosurface acceleration. The main thrust of many isosurface papers during the last decade is how to more quickly find cells intersecting the isosurface ([9], [10], [17], [27]). While these approaches work well for single-valued search criteria, we use a methodology that offers a capability not possible with isosurface acceleration techniques, namely the ability to per-form complex multidimensional, multivariate queries as part of the visualization and analysis process and in a fashion that is generally applicable to a wide variety of applications.
To efficiently answer complex data queries, we turn to the scien-tific data management community. We leverage an indexing tech-nology known as “bitmap indexing.” This approach is more gen-eral than previous works describing isosurface acceleration for two primary reasons. First, the queries themselves may be complex, multidimensional and multivariate rather than single-valued. Sec-ond, the DEX architecture effectively compartmentalizes the query phase from the analysis, visualization and rendering phases. The result is a flexible architecture that is widely applicable to many different types of data analysis and visualization problems. This approach is not entirely new, as FastBit has been used to provide multidimensional, multivariate, large-scale data query capabilities to challenging analysis problems posed by data produced by High Energy Physics experiments [37].
There are two main contributions of this paper. First, we in-troduce an architecture that leverages state-of-the-art scientific data management software to perform highly efficient multivariate data queries that are used as input to a general visualization pipeline. Our DEX implementation realizes interactive query-driven visual-ization of complex data sets produced by contemporary computa-tional science. Second, we provide an analysis overview and empir-ical benchmark results that compare our approach with prior work. Our benchmark studies focus on the data query phase of the iso-surface algorithm: we compare the performance of the data query phase of a well-known accelerated isosurfacing algorithm with that of the data query phase of DEX. The analysis indicates that DEX has favorable storage and computational complexity when com-pared to previous work. The experimental results show that DEX outperforms the well-known accelerated isosurfacing algorithm by factors ranging from 137% to 392% depending upon the source data.
The rest of this paper is organized as follows. In the next sec-tion, we discuss previous work in several topics germane to the overall theme of this paper. In Section 3 we present the DEX archi-tecture along with a discussion of storage and performance com-plexity. Our experimental results follow in Section 4, where we provide a detailed description of the benchmark used to obtain per-formance profiles of DEX and a well-known accelerated isosurface implementation. We conclude with discussion and suggestions for potential future research.
2 RELATEDWORK
In the following subsections, we review previous research in sev-eral areas germane to query-driven visualization of large and com-plex data. Previous large-data visualization research topics have tended to focus on scalable techniques that increase the capacity of the visualization pipeline rather than to reduce the amount of “non-interesting” data that must be visually interpreted. Previous work in the field of query-driven visualization has focused on presenta-tion and optimal implementapresenta-tion strategies. The related emerging field of Visual Analytics is predicated upon the ability to find and display “interesting data.” Previous work in isosurface acceleration includes numerous techniques to more efficiently locate cells that intersect an isosurface. Bitmap indexing is a technology for per-forming rapid searches within datasets.
2.1 Large and Complex Data Visualization
In response to increased data resolution, a number of research projects have focused on techniques for increasing the capacity of a visualization pipeline through parallelism, or scalable visualiza-tion. VisIt [16] and ParaView [1] are two examples of scalable ap-plications that use a parallel and pipelined architecture to support visualization of large datasets on parallel platforms. They represent a small sample of the enormous body of scalable visualization and rendering research from the past two decades. The aim of these ap-plications, and similar research efforts, is to address the large data challenge by bringing more resources to bear on the visualization problem. While they are effective in that regard, they also increase the processing load on the human observer, and do not necessarily aid in the understanding of large and complex datasets.
Other approaches aim to reduce the downstream processing and visual interpretation load by limiting the amount of data presented to the visualization pipeline. The data simplification approach in [28] accelerates visualization by focusing processing only on data at the boundaries between two materials. Other examples can be found in the myriad approaches to automatic feature detection and data-mining approaches [25, 19]. These approaches are most appli-cable to confirm the presence or absence of known phenomena. The opportunity cost is the lost possiblity of discovering unexpected features in the data not saved to disk.
2.2 Query-Driven Visualization
The idea of query-driven visualization is not new. Like our work here, previous works in query-driven visualization have the aim of highlighting data that a user defines as “interesting.”
The VisDB system described in [15] couples a guided query-formulation facility with a relevance-based visualization and pre-sentation paradigm. All data in a given dataset is examined and ranked in terms of its relevance to each query. The result is O(n)memory and processing complexity for each and every query.
VisDB aims to reduce the amount of data that is displayed by us-ing a set of statistical heuristics to select the data most relevant to a query. It uses a “relevance factor” to place “similar data” close to-gether during rendering to produce the visual appearance of
“clus-bitmap index RID I =0 =1 =2 =3 1 0 1 0 0 0 2 1 0 1 0 0 3 3 0 0 0 1 4 2 0 0 1 0 5 3 0 0 0 1 b1 b2 b3 b4
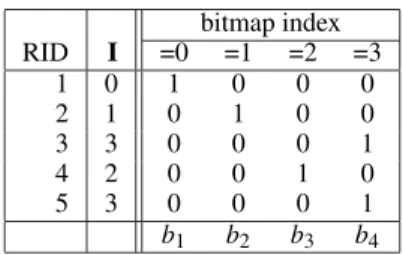
Figure 1: A sample bitmap index where RID is the record ID andIis the integer attribute with values in the range of 0 to 3.
ters.” It appears to be particularly well-suited for use with qualita-tive and “fuzzy” queries.
More recently, the Scout software system described in [20] pro-vides the ability to perform expression-based queries using a sim-ple programming language along with visualization, where both queries and visualization are executed entirely on a GPU. The Scout program, which is realized (compiled) as fragment assembler, op-erates on source data that is loaded as an OpenGL texture on the GPU. The program (fragment assembler) is executed during render-ing: two-dimensional data is rendered as a single quadrilateral, and three-dimensional data is rendered as view-aligned slices in back-to-front order as direct volume rendering. As described, Scout op-erates only on 2D or 3D regular grid structures, and its capacity is limited by the amount of data that can be fit entirely into GPU texture memory. The computational complexity of Scout’s query-driven visualization appears to beO(n), as each data cell must be
examined in answering the query. However, sincenis small due to the GPU memory footprint and the GPU supports concurrent si-multaneous execution, Scout exhibits excellent performance char-acteristics.
In both of these cases, the data query phase is ofO(n)
complex-ity, and is also inextricably embedded within a visualization appli-cation. The search results in VisDB, which are in effect a ranked ordering of the entire dataset according to a relevance factor, are then used as input to a set of subsetting tools that use statistics to partition the ranked search results. The search results in Scout are the pixel fragments that ultimately appear on-screen.
The term “visual analytics” has been coined to describe a set of activities that add discourse and dynamic interaction to the pro-cess of analysis and visualization. Recent progress in these areas spans a diversity of topics, ranging from more effective means for displaying complex and multidimensional data [15, 24, 26], novel approaches for interaction that aid in navigating through complex information spaces [32, 14], and a class of applications that encom-pass both visualization and analysis [12]. Arguably, a central theme of these works is to aid in discovery by reducing visual complexity by conveying only that information of interest to a particular line of inquiry.
2.3 Bitmap Indices
Bitmap indices are efficient index data structures for accelerating multi-dimensional range queries for read-only or read-mostly data [22, 36]. Givennrecords withcdistinct attribute values, the basic bitmap index [8] generatescbitmaps withnbits each. A bit in a bitmap is set to 1 if the attribute in the record is of a specific value, otherwise the bit is set to 0. For example, the integer attributeI shown in Figure 1 can be one of four distinct values, 0, 1, 2, and 3. For each value one bitmap is generated. Since the value in record 5 is 3, the fifth bit inb4is set to 1 and the same bits in other bitmaps are 0.
Bitmap indices are efficient for processing multidimensional range queries such as “I<2 andJ>3”. The queries are
com-puter hardware. Multidimensional and multivariate queries are sim-ply linear combinations of single-valued queries. For this reason, bitmap indexing does not suffer from the “Curse of Dimensional-ity” [5] in which adding more dimensions results in an exponential growth in storage and processing requirements. Such are character-istics commonly associated with tree-based methods for indexing and searching.
One concern with any indexing strategy is the storage cost for the index itself. One way to reduce the storage requirement for bitmap indices is via compression. An efficient bitmap compres-sion scheme must reduce the size of bitmaps as well as efficiently perform bitwise Boolean operations. Several bitmap compression methods were studied in [2, 13]. The authors demonstrated that the Byte-aligned Bitmap Code (BBC) [3, 4] shows the best over-all performance characteristics. More recently, [36] introduced a new compression method called Word-Aligned Hybrid (WAH). [36] shows the time required to answer a range query using a com-pressed bitmap index to be optimal, where the worst case response time is proportional to the number of hits returned by the query.
Traditional bitmap indices encode each distinct attribute value as one bitmap vector, which is very efficient for data of low car-dinality. Scientific data, however, is typically of high cardinality and represented in floating point format. [31] demonstrates that bitmap indices with binning can significantly speed up multidimen-sional queries for high-cardinality attributes. Rather than encode each distinct attribute value, bitmap indices with binning encode attribute ranges. FastBit supports two different binning strategies – equidepth binning and equiwidth binning. The equidepth approach selects bin sizes in a manner that ensures that nearly the same num-ber of items end up in each bin. (Note: An analogy is “histogram equalization,” which employs a monotonic, non-linear mapping that reassigns the intensity values of pixels in the input image such that the output image contains a uniform distribution of intensities.) The equiwidth approach simply subdivides the range of the dataset into a fixed number of bins. [31] shows that binning is very effective for high-cardinality attributes, including double precision floating point data, and the performance is insensitive to the query specifi-cation.
2.4 Isosurfaces
The canonical isosurface algorithm consists of two broad process-ing steps: first, find cells that contain the isosurface, and then gen-erate geometry for the surface passing through the cell. Generally speaking, the evolution of isosurface algorithms over the past two decades has focused on improving performance of the search phase: as data grows larger, the cost of searching cells to find those that in-tersect the surface dominates the complexity term.
An early implementation is the Marching Cubes algorithm [18]. It exhibitsO(n)complexity in the search phase as it must examine
every cell in the dataset to determine if the cell intersects the isosur-face. Interval-tree indexing structures can help accelerate the search process. One such implementation, based on an octree and de-scribed in [34] accelerates the search phase by eliminating branches that do not contain any cells intersecting the isosurface. Such ap-proaches are susceptible to worst-case complexity when the source data is noisy or contains small-scale fluctuations. The complexity of the octree approach was later analyzed in [17] and found to have complexityO(k+klog(n/k))wherenis the size of the dataset and
kis the number of cells that intersect the isosurface. Span-space searches, an alternative to interval-trees, as described in [17] result inO(√n+k)complexity by using k-d trees [6] to quickly locate
cells that intersect the isosurface. [27] further improves on this ba-sic idea by using a 2D regular lattice of tunable resolution rather than a k-d tree in the search phase. This approach was shown to lend itself well to effective load balancing in a parallel implemen-tation. [9] describes a two-level, out-of-core approach to accelerate
isosurface extraction that is based on the ideas of interval trees and spatial partitioning/clustering that is amenable to efficient I/O.
None of these search algorithms would be effective for the type of multidimensional, multivariate queries needed for query-driven visualization. Nor do any appear to be well suited for use with dynamic (e.g., streaming) data sources. One of the key features of our approach is the ability to support multidimensional feature-based searches for interactive refinement of feature values such as temperatureorpressure.
3 DEX ARCHITECTURE
The DEX implementation consists of four broad processing phases. First, we create index structures later used to accelerate data searches. Once the index structures are constructed, they are reused and their construction cost amortized across many data queries, or index searches. Second, an index searching phase uses the index structures to quickly find data that satisfies user-specified search criteria. Third, the search results (data cells) are organized into connected spatial regions in a processing operation we refer to here as “region growing.” In practice, the data cells produced from the initial query or the connected regions are then passed along to the fourth stage, which is visualization and rendering. In the imple-mentation we present here, the connected regions are then con-verted directly to geometry for direct rendering using a cuberille-style presentation [23]. Generally speaking, the results from the index searching phase may be used as input to codes that perform analysis or other types of visualization or rendering.
3.1 Index Construction
In the context of this paper, there are two primary factors of concern with respect to constructing the index structures used to accelerate data queries: the computational complexity of the index construc-tion algorithm and the storage requirements of the resulting index.
In the case of bitmap indices, the index construction step requires that each data value be examined and the corresponding bitmap code appended to the bitmap index structure. The result is ofO(n)
computational complexity. In contrast, tree-based methods in gen-eral require either a complete sort so that insertions are performed in linear time, or they perform a sorted insertion into a tree-based index structure for each data point. Either approach results in a complexity ofO(nlogn), which is consistent with results reported
by others who have accelerated isosurface extraction using span-space indexing structures ([27], [17], [9], [10]). Since no inser-tions, sorts or tree rebalancing operations are are needed to con-struct bitmap indices, they are particularly attractive as the value of nincreases. Similarly, bitmap indices are particularly well suited for use in streaming (append) and out-of-core operations.
A complete discussion of the storage requirements for bitmap indices as well as a comparison with tree-based methods is beyond the scope of this paper. The ultimate size of any indexing structure is highly dependent upon the characteristics of the underlying data. Nonetheless, previous studies ([35], [36]) prove that in the worst case for a dataset ofnvalues, the upper bound in size of the bitmap index is 2nwords. In contrast, the upper bound worst case for tree-based structures (B-trees, octrees, quad-trees, etc.) is expected to beO(nlogkn)in theory, and has been observed to be about 4nin
practice as the logarithmic basekincreases to reflect a large data page size [36].
3.2 Index Searching
Once the search data structures (bitmap indices) have been con-structed, the next phase of processing is to find data cells that fulfill
search criteria and prepare the results for efficient downstream pro-cessing. The primary strengths of the bitmap indexing approach are: (1) its low computational and storage complexity, and (2) its ability to efficiently answer complex, multidimensional range queries in time complexity proportional to the number of items re-turned by the query. The DEX implementation presents the user with a GUI that facilitates the composition of a query, and is de-scribed in more detail in [29]. Behind the GUI, the FastBit software performs data queries in worst-caseO(k)complexity, wherekis the
number of cells that match the search criteria [36].
For convenience of later operations, we convert the compressed bitmap generated by indexing operations into a list of blocks in space, where each block represents a series of cells that were con-secutive in the bitmap representation. For data from 3D space, there are three types of blocks that can be generated from a compressed bitmap: a line segment of connected cells; a group of connected lines; and a group of connected planes. Each of these blocks of cells represents a set of consecutive bits that are 1. These bits are typi-cally represented in a very compact form in the compressed bitmap. Therefore, the space occupied by the compressed bitmap is propor-tional to the number of blocks produced. If only one attribute is involved in the query, the total size of all bitmaps involved in an-swering the query is also about the size of the resulting bitmap [36]. The process of converting a consecutive group of 1s to a block takes a constant number of machine instructions, therefore converting a word-aligned hybrid (WAH) compressed bitmap to a list of blocks scales linearly with the number of blocks [36].
3.3 Region Growing
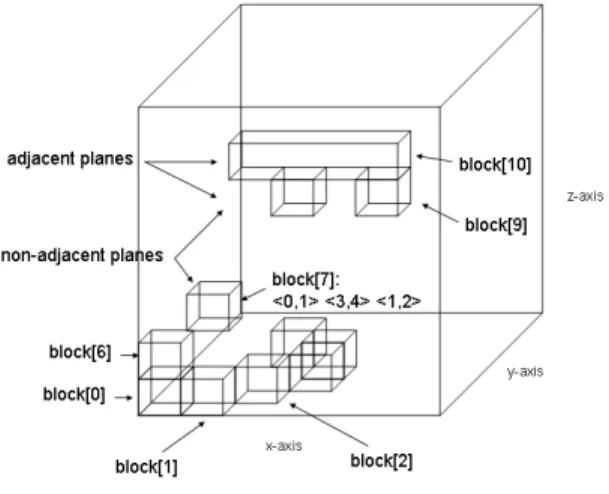
Next, we take the blocks returned by the index search and group them into arbitrarily shaped connected regions, a process we re-fer here to as “region growing.” Our basic approach is to identify blocks that belong to the same region using an algorithm that has an order of complexity that is sublinear with the number of blocks. Blocks are considered neighbors if they share any face, edge or corner (26-connected neighbors). Unique regions identified via the region growing process are then assigned a unique label. This type of approach operates well regardless of the resulting concavity or convexity of the resulting grown region.
Figure 2: Blocks in space with three spatial dimensions. A typical representation of blocks in a space with three spatial dimensions is shown in Figure 2. The region growing algorithm steps through these blocks and labels the regions that are connected.
In this example, there are three regions that are labeled from 1 to 3. See [30] for details.
3.4 Geometry Construction
FastBit uses a very compact mechanism for presenting the cells that match a query expression in the form of a list of blocks. The blocks are 3D bounding box coordinates for the regions that match the query, and cover the entire selected space. While this approach of-fers a compact representation for identifying the selection, it cannot be used in the visualization pipeline because neighboring blocks will be topologically disjoint unless the corners of the bounding boxes are coincident. The cell-centered data values associated with the selection cannot be mapped onto such a disjoint topology in a manner that can be used by later stages of the visualization pro-cessing pipeline. Therefore, we convert the list of blocks into an unstructured finite element mesh that represents the outer hull of the selection. The latter conversion is useful for simply represent-ing the outer hulls without gaps between neighborrepresent-ing mesh points. The former is useful for passing the cells that match the selection to other visualization algorithms. For example, one may first subset cells based upon theCH4concentration, then do a volume rendering ofdensityonly on cells within a certain range ofCH4.
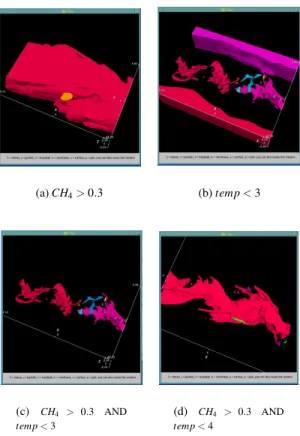
An example visualization produced by DEX is shown in Figure 3. It shows four different user queries of a typical interactive analy-sis on a combustion simulation data set. It demonstrates how data is progressively interrogated to focus on cells that contain properties of interest. In the first frame (a), the search finds the areas con-taining a high concentration ofCH4, a key ingredient needed for combustion (fuel). The second frame (b) shows the areas in the dataset where the temperature is low indicating areas that are ei-ther pre- or post-combustion. The complex structures in the center show the turbulence in the cooler fuel before combustion, whereas the smoother areas at the top and bottom are outside the ignition zone. The third frame (c) shows how the query can be modified to reject low temperature areas that are outside the region where CH4concentration is high. It leaves only the complex structures of the cooler fuel in the center of the simulation domain, eliminating the “uninteresting” data at the outer boundaries. The last frame (d) shows how the search is progressively refined to winnow in on the “interesting” data.
3.5 Multiresolution Support
In some cases, the number of data values returned by a query can exceed the available processing resources. For this reason, FastBit supports a strategy for returning query results at different levels of resolution. FastBit can encode the indices for a hierarchy of reso-lutions – each representing a coarser downsampled version of the original data. When a query is performed, the application can spec-ify a level of resolution that is desired for the returned results.
Bitmap indices efficiently estimate the number of cells that would be returned by a query. The application can request an exact count of the number of cells that a query would return before the list of blocks is generated. Given an accurate performance model for pipeline processing of the cells or rendering performance, the esti-mation inforesti-mation can guide selection of a level of resolution that would stay within the response time or resource budget specified by the user or application.
Currently, the downsampled versions of the data use a naive al-gorithm that takes one cell out of a 2x2x2 cluster of cells for the coarsened grid. Topological detail can be lost in this kind of down-sampling process. In the future we will consider multiresolution sampling strategies that address concerns about topological correct-ness.
(a)CH4>0.3 (b)temp<3
(c) CH4 > 0.3 AND
temp<3
(d) CH4 > 0.3 AND
temp<4
Figure 3: A visualization of a combustion analysis dataset displays the cells selected by various user queries. The selected cells are colorized by their region label that is assigned by a 3D region grow-ing algorithm. The image is an example taken from the combustion studies where the goal is to track the ignition kernel of a flame. 4 EXPERIMENTALRESULTS
The benchmarks we present in this section are intended to answer two key questions. First, what is the cost of constructing bitmap indices? Second, how does the data search capability of DEX com-pare to a “standard implementation” of an isosurface algorithm that uses a span-space technique to accelerate data queries?
The source data for the benchmarks consists of a multivalued combustion simulation dataset containing about 56 million data points from a grid that is 3833in resolution and 38 variables per grid cell [33]. While we have access to much larger datasets, we chose this resolution so that both DEX and VTK’s Accelerated March-ing Cubes algorithm would run completely in-core, and eliminate any issues that might arise from memory swapping. The hardware we used for the benchmarks is a 2.8Ghz P4 machine with 2GB of RAM, and a SCSI RAID capable of 60MB/s in I/O bandwidth. 4.1 Index Construction
As previously discussed, the size of any indexing structure is influ-enced by the qualities of the underlying data as well as the specific indexing scheme. For the purposes of this experiment, we wrote a standalone application that reads all data values for a given field into memory, performs the indexing, then writes the index out to a file. This processing step need be performed only once, and the resulting index is used as input only to the data query stage of pro-cessing. Note that the data query stage of processing produces data cells that are then passed along to downstream analysis,
visualiza-Variable Index Size (MB) Index Size Factor Time (sec)
pressure 77.59 0.36 7.47 density 128.70 .60 8.56 temp 124.93 .58 8.76 x velocity 247.49 1.15 13.30 H2O 263.64 1.23 13.04 CH4 314.88 1.46 13.49
Table 1: The table above shows the time and storage requirements for the Index Construction portion of processing. The size of each input variable is 214.31MB, which is the space requirement for an uncompressed3833 grid of 4-byte floating point values. The time column indicates the number of elapsed seconds required to create the bitmap index from the original data field.
tion and rendering modules.
Table 1 lists the size of the original data field, the size of the cor-responding bitmap index, and the length of time required to con-struct the bitmap index from the source data for a random subset of the 38 simulation variables. Each bitmap index consists of 100 range-encoded bins compressed with WAH [36]. The size of the index for each given field varies as a function of the source data. At the low end, thepressureindex is 36% the size of the original data, while at the high end, theCH4index is 146% the size of the orig-inal data. For these experiments, we were not able to measure the size of the span-space tree VTK constructs to accelerate its isosur-face algorithm. Tree-based structures, however, are known to have O(nlogkn)storage requirements.
4.2 Data Search Performance Analysis
We constructed a benchmark that is intended to measure the perfor-mance of the data search phase of DEX with that of VTK’s Accel-erated Marching Cubes implementation, which uses a span-space technique to accelerate data search operations. Ideally, we would measure and report the time required for the cell search phase to compare only the search capabilities of bitmap indexing with that of a span-space search algorithm. Due to the details of how an ap-plication can use VTK’s algorithm, such an exact comparison is not possible. Therefore, the series of results that follow include timings for two stages of processing: (1) the time required to find cells that intersect the isosurface (VTK) or meet given search criteria (DEX), and (2) the time required to generate isosurface triangles from each cell containing the isosurface (VTK) or to generate a finite-element hexahedron from the cell satisfying the search criteria (DEX).
For the first stage – finding cells that meet a search criteria – VTK and DEX are performing similar but slightly different tasks. VTK is using a span-space algorithm to find cells that intersect the isosurface. This corresponds to an==operation in the sense that
the search finds all cells that contain the isosurface. In contrast, DEX is performing a<=search operation, which effectively finds
all data points that lie inside the isosurface, not just those cells on the surface. In the first stage of processing, our benchmark gives VTK an advantage in that DEX produces more output due to differ-ent search criteria. Span-space searches return cells based upon a min/max encodings in the search structure, whereas FastBit returns data points based upon range queries.
For the second stage – generating isosurface geometry from cells that meet the search criteria – VTK and DEX again are performing somewhat different tasks. For each cell that intersects the isosur-face, VTK produces triangles that represent the isosurface inter-secting the cell. We estimate that approximately 2.5 triangles are generated per cell [7]. In contrast, DEX is producing a finite ele-ment hexahedron for each cell consisting of 12 triangles. Both VTK and DEX are doingO(k)work in this stage of processing, but DEX
generating geometry for a volume of cells rather than for cells on the surface of the isosurface.
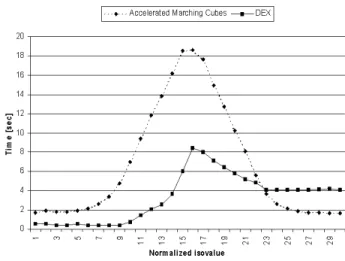
For the benchmark, we performed data extraction and geoemtry generation over thirty different isovalues evenly distributed over the range of the domain space for a particular data field. We performed this test over three different fields: density,H2O, andx velocity. The execution times for these queries for both DEX and VTK are shown in Figures 4 to 6. The results are summarized in Table 2, and indicate that DEX is outperforming VTK by factors ranging from 137% to 392% in task consisting of a search phase followed by a geometry production phase.
Figure 4: Performance comparison of VTK’s Accelerated Marching Cubes and DEX for attributedensity.
Figure 5: Performance comparison of accelerated Marching Cubes and DEX for attributeH2O.
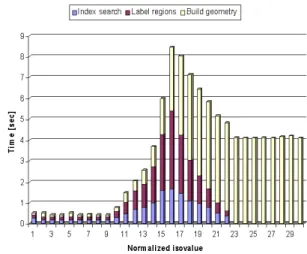
Digging deeper into the DEX pipeline, we measured the con-tributions from each of the three stages of processing involved in producing output. These are reported in Figures 7 through 9. These stages are (1) index searching to locate the cells that satisfy the search criteria, (2) labeling the connected regions, and (3) con-structing finite element geometry for each of these regions. For the
Figure 6: Performance comparison of accelerated Marching Cubes and DEX for attributex velocity.
Algorithm Density H2O X velocity Avg VTK time 9.22 7.36 6.79 Avg DEX time 2.35 5.34 3.32 DEX speedup 392% 137% 204%
Table 2: Summarizing the overall performance numbers from Figures 4 to 6, we see that the data searching and geometry construction times for DEX are better than VTK’s accelerated Marching Cubes implementation by factors ranging from 137% to 392%.
attributedensity, these three time factors are about equal. For the attributesH2Oandx velocity, the time for building the geometry takes up most of the time, and is linear with the number of cells in the isovolume. The time for the bitmap index search and the region labeling depends on the distribution of the attribute. In other words, if the cells and regions that satisfy a particular region are densely packed in space, the cost of finding those cells and labeling the re-gion is substantially sublinear. Note that the rere-gion labeling step is a feature not commonly associated with the data search algorithms in any of the published isosurface acceleration algorithms, and reflects one of the unique capabilities of using the FastBit bitmap indexing implementation.
5 FUTUREWORK
The work we have described illustrates how state-of-the-art data in-dexing and searching technology from the scientific data manage-ment community can be successfully leveraged to accelerate query-driven visualization. As a result of this initial effort, we envision further research and development along a number of different av-enues.
• Incorporation into Mainstream Visualization Tools: The
capa-bilities of fast bitmap indices need not be marooned in a stan-dalone research prototype like DEX. We already have work underway that will result in these capabilities being an in-tegral part of mainstream visualization applications. This is important for it represents a transition of research technology into the hands of scientists with challenging data analysis and visualization problems.
• Search Estimation and Multiresolution Queries: an ill-formed
pre-Figure 7: Various time factors of DEX pipeline for attributedensity.
Figure 8: Various time factors of DEX pipeline for attributeH2O.
vent downstream saturation, we can take advantage of Fast-Bit’s ability to quickly generate an estimate of the number of cells that will satisfy a multidimensional, multivariate range query to request reduced-resolution searches.
• Topology-Preserving Multiresolution Queries: An early
pro-totype (not discussed in this paper) creates multiresolution data hierarchies using simple subsampling of data. A better approach is to modify the methods for developing multireso-lution indices so that ifanyof the cells that are contained by a coarsened cell meet the query requirements, the finer cell will be selected. This approach ensures that features that would otherwise disappear at coarser levels of the multiresolution hierarchy will remain at any level of detail.
• View Dependent Subsetting: The query response times for fast
bitmap indices are relatively insensitive to the complexity of the query expression. Therefore, if the cartesian location of each grid point is encoded in the indices, queries can embed a region of interest (or a list of ROIs) that are within the viewing cone of the projection matrix. This information can be used
Figure 9: Various time factors of DEX pipeline for attributex velocity.
to return only the cells that are currently in the viewport. 6 CONCLUSIONS
We have presented DEX, an implementation of query-driven visu-alization that leverages state-of-the-art data indexing and search-ing technology from the scientific data management community. Leveraging such technology allows us to benefit from reduced com-putational and storage complexity when compared to previous work in both query-driven visualization as well as isosurface acceleration algorithms. The basis for comparison was two primary processing regimes: index construction and data query. For the index con-struction phase, our index concon-struction algorithm hasO(n)
com-plexity, and requiresO(n)storage. In contrast, previous methods
from span-space accelerated isosurfacing requireO(nlogn)
stor-age and computational complexity. For the search phase, FastBit was shown to haveO(k)complexity, wherekis the number of data
cells returned from a search ofndata items. The benchmark results show that our data search algorithm performs, on the average and for the dataset we tested, from 137% to 392% faster than VTK’s Accelerated Marching Cubes algorithm, which uses a span-space technique to accelerate data queries. Beyond the performance ben-efits, our approach is capable of performing arbitrarily complex, multivariate and multidimensional range queries inO(k)time. This
new capability is beyond the scope of what is possible with tree-based methods, and has been shown to be applicable in other re-search to challenging data analysis problems in the High Energy Physics community. The DEX implementation is structured so as to demonstrate how modularizing the pipeline processing stages – index construction, index searching, visualization, and rendering – results in a flexible architecture in which state-of-the-art scientific data management technology can be effectively applied to a large number of data analysis and visualization problems.
7 ACKNOWLEDGEMENT
This work was supported by the Director, Office of Science, Of-fice of Advanced Scientific Computing, of the U.S. Department of Energy under Contract No. DE-AC03-76SF00098.
REFERENCES
[1] J. Ahrens, B. Geveci, and C. Law. ParaView: An End-User Tool for Large Data Visualization. In C. Hansen and C. Johnson, editors,The Visualization Handbook, pages 717–731. Academic Press, 2005. [2] S. Amer-Yahia and T. Johnson. Optimizing Queries on Compressed
Bitmaps. InInternational Conference on Very Large Data Bases, Cairo, Egypt, September 2000. Morgan Kaufmann.
[3] G. Antoshenkov. Byte-aligned Bitmap Compression. Technical re-port, Oracle Corp., 1994. U.S. Patent number 5,363,098.
[4] G. Antoshenkov and M. Ziauddin. Query Processing and Optimiza-tion in ORACLE RDB.VLDB Journal, 5:229–237, 1996.
[5] R. Bellman. Adaptive Control Processes: A Guided Tour. Princeton University Press, 1961.
[6] J. L. Bentley. Multidimensional Binary Search Trees Used for Asso-ciative Search.Comm. ACM, 18(9):509–516, 1975.
[7] I. Bowman, J. Shalf, K. L. Ma, and E. W. Bethel. Performance Model-ing for Grid-Based Visualization. Technical report, Lawrence Berke-ley National Laboratory, April 2004. LBNL-56977.
[8] C. Y. Chan and Y. E. Ioannidis. An Efficient Bitmap Encoding Scheme for Selection Queries. InSIGMOD, Philadelphia, Pennsylvania, USA, June 1999. ACM Press.
[9] Y.-J. Chiang, C. T. Silva, and W. J. Schroeder. Interactive Out-Of-Core Isosurface Extraction. InIEEE Visualization, Research Triangle Park, North Carolina, USA, October 1998. IEEE Computer Society Press. [10] P. Cignoni, C. Montani, E. Puppo, and R. Scopigno. Optimal
Isosur-face Extraction from Irregular Volume Data. InVolume Visualization Symposium, pages 31–38, 1996.
[11] C. S. Co, B. Hamann, and K. I. Joy. Iso-Splatting: A Point-based Alternative to Isosurface Visualization. InProceedings of the Eleventh Pacific Conference on Computer Graphics and Applications - Pacific Graphics 2003, Canmore, Alberta, Canada, October 2003.
[12] E. Hetzler and A. Turner. Analysis Experiences Using Information Visualization.IEEE Computer Graphics and Applications, 24(5):22– 26, 2004.
[13] T. Johnson. Performance Measurements of Compressed Bitmap In-dices. InInternational Conference on Very Large Data Bases, Edin-burgh, Scotland, September 1999. Morgan Kaufmann.
[14] D. Keim and S. North. Visual Data Mining in Large Geospatial Point Sets.IEEE Computer Graphics and Applications, 24(5):36–44, 2004. [15] D. A. Keim and H.-P. Kriegel. VisDB: Database Exploration using Multidimensional Visualization. IEEE Computer Graphics and Ap-plications, 14(5):40–49, 1994.
[16] Lawrence Livermore National Laboratory. VisIt: Distributed and Par-allel Visualization Application.http://www.llnl.gov/visit/, 2003. [17] Y. Livnat, H. W. Shen, and C. R. Johnson. A Near Optimal Isosurface
Extraction Algorithm Using the Span Space. IEEE Transactions on Visualization and Computer Graphics, 2(1), March 1996.
[18] W. E. Lorensen and H. E. Cline. Maching Cubes: A High Resolution 3D Surface Construction Algorithm.Computer Graphics, 21(4):163– 169, 1987.
[19] R. Machiraju, J. E. Fowler, D. Thompson, W. Schroeder, and B. Soni. EVITA: A Prototype System for Efficient Visualization and Interroga-tion of Terascale Datasets. Technical report, Engineering Research Center, Mississippi State University, November 2000. Tech. Rep. MSSU-COE-ERC-01-02.
[20] Patrick S. McCormick, Jeff Inman, James P. Ahrens, Charles Hansen, and Greg Roth. Scout: A hardware-accelerated system for quantita-tively driven visualization and analysis. InVIS ’04: Proceedings of the conference on Visualization ’04, pages 171–178, Washington, DC, USA, 2004. IEEE Computer Society.
[21] Patrick J. Moran and Chris Henze. Large field visualization with demand-driven calculation. InVIS ’99: Proceedings of the conference on Visualization ’99, pages 27–33, Los Alamitos, CA, USA, 1999. IEEE Computer Society Press.
[22] P. O’Neil. Model 204 Architecture and Performance. In2nd Interna-tional Workshop in High Performance Transaction Systems, Asilomar, California, USA, 1987. Springer-Verlag.
[23] Xiaoqing Qu and Wayne A. Davis. An extended cuberille model for identification and display of 3d objects from 3d gray value data. In
Proceedings of the conference on Graphics interface ’92, pages 70– 77, San Francisco, CA, USA, 1992. Morgan Kaufmann Publishers Inc.
[24] J. Saffer and P. van der Speck. Visual Analytics in the Pharmaceutical Industry. IEEE Computer Graphics and Applications, 24(5):10–15, 2004.
[25] N. Sawant, C. Scharver, J. Leigh, A Johnson, G. Reinhart, E. Creel, S. Batchu, S. Bailey, and R. L. Grossman. The Tele-Immersive Data Explorer: A Distributed Architecture for Collaborative Interactive Vi-sualization of Large Data-sets. In4th International Immersive Projec-tion Technology Workshop, Ames, Iowa, June 19-20 2000.
[26] G. Schmidt, S-L. Chen, A. Bryden, M. Livingston, L. Rosenblum, and B. Osborn. Multidimensional Visual Representations for Underwater Environmental Uncertainty. IEEE Computer Graphics and Applica-tions, 24(5):56–65, 2004.
[27] H. W. Shen, C. D. Hansen, Y. Livnat, and C. R. Johnson. Isosurfacing in Span Space with Utmost Efficiency (ISSUE). InIEEE Visualization ‘96, San Francisco, CA, USA, October 1996.
[28] D. Sigeti, B. Gregorski, J. Ambrosiano, G. Graham, M. Wolinsky, M. Duchaineau, B. Hamann, and K. Joy. Approximating Material Interfaces in Two- and Three-dimensional Meshes during Data Sim-plification.Hierarchical Approximation and Geometrical Methods for Scientific Visualization, 2002. Springer-Verlag.
[29] K. Stockinger, John Shalf, Wes Bethel, and K. Wu. DEX: Increasing the Capability of Scientific Data Analysis Pipelines by Using Efficient Bitmap Indices to Accelerate Scientific Visualization. InInternational Conference on Scientific and Statistical Database Management (SS-DBM), Santa Barbara, California, USA, June 2005. IEEE Computer Society Press.
[30] K. Stockinger and K. Wu. Improved Searching for Spatial Features in Spatio-Temporal Data. Technical report, Lawrence Berkeley National Laboratory, Berkeley, California, USA, September 2004. LBNL-56376.
[31] K. Stockinger, K. Wu, and A. Shoshani. Evaluation Strategies for Bitmap Indices with Binning. InInternational Conference on Database and Expert Systems Applications (DEXA), Zaragoza, Spain, September 2004. Springer-Verlag.
[32] S. T. Teoh, K-L. Ma, S. F. Wu, and T. J. Jankun-Kelly. Detecting Flaws and Intruders with Visual Data Analysis. IEEE Computer Graphics and Applications, 24(5):27–35, 2004.
[33] TeraScale High-Fidelity Simulation of Turbulent Combustion with Detailed Chemistry. http://www.scidac.psc.edu.
[34] J. Wilhelms and A. Van Gelder. Octrees for Faster Isosurface Genera-tion.ACM Transactions on Graphics, 11(3):201–227, 1992. [35] K. Wu, E. Otoo, and A. Shoshani. An Efficient Compression Scheme
for Bitmap Indices.to appear in ACM Transactions on Database Sys-tems, 2005.
[36] K. Wu, E. J. Otoo, and A. Shoshani. On the Performance of Bitmap Indices for High Cardinality Attributes. InInternational Conference on Very Large Data Bases, Toronto, Canada, September 2004. Morgan Kaufmann.
[37] K. Wu, W.-M. Zhang, V. Perevoztchikov, J. Lauret, and A. Shoshani. The Grid Collector: Using an Event Catalog to Speedup User Anal-ysis in Distributed Environment. InComputing in High Energy and Nuclear Physics (CHEP) 2004, Interlaken, Switzerland, September 2004.