8 July – 15 July, 2012, COEX, Seoul, Korea (This part is for LOC use only. Please do not change this part.)
abcde
DEVELOPING A MODELING APPROACH TO PROBABILITY
USING COMPUTER
−
BASED SIMULATIONS
Theodosia Prodromou
University of New England, Australia [email protected]
This research study investigates how middle school students use probability to model random behaviour in real-world contexts and the connections that they build among fundamental probabilistic concepts when they engage in exploring computer-based simulations that treat probability as a modelling tool. This article also discusses how students use the modelling approach to probability to draw basic inferences about data from examination of distributions. The results suggest that the way students express the relationship between signal and noise is of importance while building models from the observation of a real situation. This relationship seems to have a particular importance in students’ abilities to build comprehensive models that link observed data with modelling distributions.
Keywords: modelling, probability, computer-based simulations, signal, noise.
INTRODUCTION
At a secondary level, the notion of probability has traditionally been introduced either by means of relative frequencies (frequentist) or by means of the classical definition (classicist).
In the Classicist approach, which is based on combinatorial calculus, probability is a fraction of which the “Numerator is the number of chances whereby an event may happen and the denominator is the number of all chances whereby it may either happen or fail” (deMoivre, 1718/1967, p. 1). This perspective introduces an a priori approach to probability in which probabilities can be calculated before any physical experiment is performed.
The frequentist approach to probability is based on observations of relative frequencies of an event associated with a random experiment that is repeated a sufficiently large number of times under the same conditions. In this view, experimental probability is estimated as a limit towards which the relative frequencies tend when stabilizing (Von Mises, 1928). The idea of stabilization is based on the empirical laws of large numbers.
This paper is concerned with the modeling approach (Chaput et al., 2011), which attempts to synthesize these two perspectives. Recent research (Prodromou, 2008) showed that this synthesis is better achieved by the use of simulations. Curricula studies (Chaput et al., 2011) have adopted this approach using simulations of models in stochastics (probability and statistics). But there is need for further research on how this approach shapes students’ understandings.
PROBABILITY IN THE CURRICULUM
The Australian Curriculum and Reporting Authority K-10 (ACARA, 2010) advocates initially the parallel development of statistics and probability and then progressive development of the links between them. According to the “statistics and probability” content strand students are expected to “assess likelihood and assign probabilities using experimental and theoretical approaches; develop an increasingly sophisticated ability to critically evaluate chance and data concepts and make reasoned judgments and decisions, as well as building skills to critically evaluate statistical information and develop intuitions about data (p. 2)”.
Despite the aim of the national Australian curriculum (ACARA, 2010) to support the parallel development of statistics and probability, at present statistics are given the bulk of attention for several reasons. On the one hand the multiple applications of probability to different sciences were hidden and probability was considered as a subsidiary part of mathematics, since it is so tightly connected to games of chance and only dealt with such games. This tight connection of probability with games of chance was sometimes perceived as amoral. On the other hand, the increasing interest in statistics and the growing expectations around what it is expected from students when handling data are changing rapidly. The new techniques in Exploratory Data Analysis (EDA, Tukey, 1977) and continuing developments in pioneering software used in statistics education, such as Fathom
and Tinkerplots, are ideally suited for supporting students, as they allow students to
manipulate data and portray it in a range of different representations to draw inferences from it, reducing the need for sophisticated understanding of probability theory.
EDA is developing interesting pedagogic approaches towards informal inference (Tukey, 1977). EDA was developed as a means of engaging students in data analysis; it promotes an approach to interpreting data using multiple graphical representations and summary statistics to see the underlying structure of the data. In terms of the classical approach, the sample is not assumed to be random or a sample from a larger population. In essence, EDA is concerned with whole populations or unique data sets. In particular, a focus on comparing data and focusing on the group propensities of data have been seen as particularly productive for supporting students in making sense of data in a meaningful way.
The technological developments together with EDA techniques have prompted researchers’ interest in students’ informal inferential reasoning (IIR), a learning process of drawing conclusions from data and (1) generalizing beyond data available (e.g., parameter estimates, conclusions, and predictions); (2) using data as evidence of the generalisation; (3) articulating the degree of certainty (due to variability) embedded in a generalisation (Makar & Rubin, 2009, p. 15). Introducing statistical concepts at an informal level to students from the early school years carries with it a potential to change the focus of statistics from the calculations and graphing techniques that usually define statistics in schools to a revolutionary way of reasoning. This change in the focus of statistics supports students in building stronger connections between statistics and data from real world phenomena through long-term everyday experiences. By strengthening links between statistics and everyday experiences through repeated and long-term exposure to inferential reasoning,
children will acquire deep conceptions of data before formal ideas are introduced. Making informal inferences does not require any recourse to a classical understanding of probability. The third characteristic of the informal statistical inference, however, emphasizes that inferences encompass uncertainty and their degree of uncertainty should be fully expressed. For example, when estimating a population mean from a sample, this estimate must be made acknowledging its inherent uncertainty. The expression of such an uncertainty however, does not lead to any formal probabilistic articulations.
While the statistics curriculum has adopted new approaches like EDA, and new technologies such as Fathom and Tinkerplots, and is changing in an attempt to adapt to the current software innovations and the enquiry-based stance for learning and teaching statistics, the probability curriculum remains isolated in its world of dice, spinners, and coins. The modelling approach provides a response to the reasons that probability has been vanishing from some international curricula (Borovcnik, 2011). This approach reinforces use of models that are formalised in a symbolic system and developed to represent concrete situations or problems arising from reality. Such modelling of concrete situations is a process of building models that cannot always be deterministic. The models that incorporate uncertainty or random error in a formalized way instead, are called probabilistic models. These probabilistic models, according to their inherent rules, are expected to simulate the exact behaviour of random phenomena and also predict specific properties of random phenomena. For instance, random generators can be seen as determined if one is aware of a set of factors that causally affect the generator’s behaviour, in which case the outcomes would be entirely predictable. In practice, this is an unlikely state of affairs and it is likely that one would be interested instead in adopting a probabilistic model.
In this framework, a probability distribution of some discernible characteristics has the status of a model of the data that describes what one could expect to see if many samples were collected from a population, enabling us to compare data from a real observation of this population with a theoretical distribution. This perspective is in accord with the
modelling process of contemporary statistical thinking (Wild & Pfannkuch, 1999) that
allows the application of theoretical results when making statistical inferences regarding particular observed sample statistics or data analysis.
The modelling approach points out that probability should not only be used to explain the methods of inferential statistics at the high school level but also “as a tool for modelling computer-based action and for simulating real-world events and phenomena” (Pratt, 2011, p. 3).
Recent developments in software provide the user with modelling tools based on probability (i.e., the user can set the probability of some event) that can be used to construct models used by computer-based simulations. Recent teaching studies have led to teaching based on the modelling approach using simulations of models in connecting statistics to simulated real phenomena, fostering the growth of basic probabilistic concepts. Such a choice will necessarily bring with it new challenges in how children learn and gives rise to research questions about the conceptual development of students who are engaged in connecting probability to statistics and to simulated real phenomena.
This paper reflects on how middle school students articulated fundamental probabilistic concepts associated with the construction of univariate probability models in two studies that used probability to model random behaviour.
This paper is part of larger examination of four research questions: (1) How do middle school students use probability to model random behaviour in real-world contexts? (2) What connections do they build among fundamental probabilistic concepts when treating probability as a modelling tool? (3) How do they synthesize the modelling approach to probability with the use of distributions while concurrently making basic inferences about data? (4) What activities can be designed to prompt and support the proposed alternative approach for teaching probability?
The next two sections of this paper will examine the building of middle school students’ understanding when using probability as a modelling tool.
First study: BasketBall
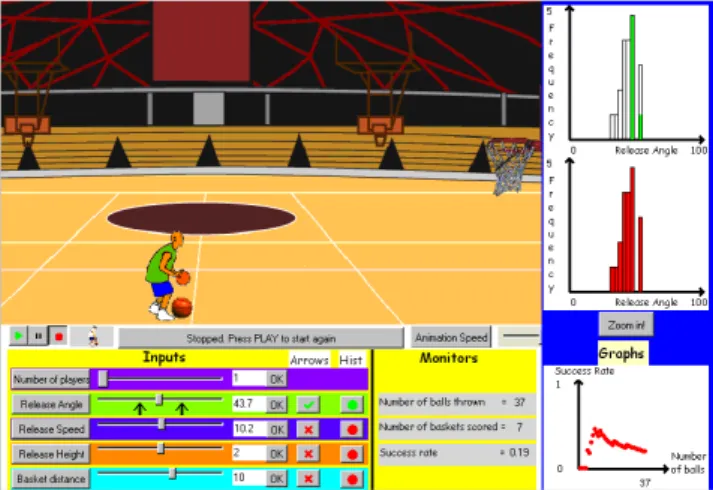
The BasketBall simulation is a computer-based simulation of a basketball player attempting
to make a basket (Prodromou, 2008). Based on a secondary curriculum with its focus on using distributions to make inferences, it was anticipated that students might view what Prodromou and Pratt (2006) called a data-centric perspective on distribution that would be consistent with the Exploratory Data Analysis (EDA) approach. The BasketBall simulation promotes an alternative view that learners might adopt by recognizing the probabilistic features of distribution. Such a view is consistent with how statisticians explain variation in data distributions as being either the result of noise or error randomly affecting the main effect, or higher random effects. In the modelling perspective, data are the outcomes, generated out of random error and various effects as expressed in the model.
Figure 1: The histograms of successes and attempts against release angle (two top graphs on the right) plot the data generated by the computer. These graphs display the data-centric
perspective on distribution (Prodromou, 2008, p. 166).
Two mechanisms were used by the BasketBall simulation to generate the trajectories of the balls following Newton’s Laws of motion; one was fully deterministic; the other used a probabilistic model that incorporated variation in the trajectories of the balls. The interface was designed to present the data-centric perspective graphically as a set of data about the trajectories and success of shots at the basket (Figure 1), and the modelling perspective was
presented as the probability distribution that generated the varying trajectories of the balls. Hence, in the BasketBall simulation, the modelling distribution takes on the utility of generating data.
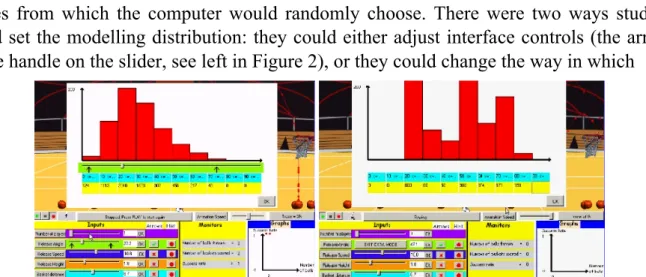
In the final iteration of the research study students were given the opportunity to access the graphical representation of the modelling distribution, which showed a distribution of values from which the computer would randomly choose. There were two ways students could set the modelling distribution: they could either adjust interface controls (the arrows or the handle on the slider, see left in Figure 2), or they could change the way in which
Figure 2: The students altered the modelling perspective directly by moving either the arrows or the handle on the slider (left), or by setting numerical values associated with each
possible outcome for a given variable (right).
values were chosen by directly entering their own value for each outcome interval (right in Figure 2). In both cases, the simulation allowed students the facility to transform the modelling distribution (which generates the output data) directly and thus they have indirect control over the data-centric distribution.
Prodromou’s research was interested in investigating whether and how 15-year-old students built connections between the data-centric perspective on distribution and the modelling perspective on distribution.
The studies show the construction of three interpretations for bridging the modelling and the data-centric perspectives on distribution:
• General Intention (IG): The modelling distribution (MD) was perceived as the
intended outcome and the data distribution (DD) as the actual outcome, suggesting a connection being made in which the modelling distribution in some sense generates the data.
• Stochastic intention (IST): General intention becomes stochastic intention (IST) when
randomness becomes a part of the interpretation of the student.
• Target: The modelling distribution (MD) was perceived as the target (T) to which the
data distribution (DD) is directed.
When students manipulated the BasketBall simulation, some of them appeared to perceive the modelling distribution as the intended outcome and the data-centric distribution as the actual outcome. Two pairs of students had a sense of a general intention (IG) when they
strong sense of the probabilistic mechanism and as evidenced, there was not a progressive articulation of intuitive relationships, leading gradually to a clear probabilistic-type language for talking about randomness and probability.
Their reasoning about intentionality remains insufficiently clear. We can have at least two different possible interpretations: a) the intention is simply an expression of the pre-programmed deterministic nature of the computer – at least in their experience, or b) intentions are reflected in the actions of a model builder.
When students gave evidence of a sense of a stochastic intention (IST), they spoke of the
modelling distribution as the intended outcome, progressively generating the data-centric distribution. It can be concluded from their various references to chance that this perception of intention is probabilistic, and underpins the idea that the modelling distribution precedes, indeed generates, the data-centric distribution. Hence, the students refer to the computer ‘wanting’ to throw the ball at various angles, a sentiment that we characterise as the situated abstraction, “the more the computer wants to throw at a particular angle, the higher is that angle’s bar”.
Some students made the opposite connection from the data to the modelling distribution by perceiving the latter to be the target to which the former is directed, without understanding the probabilistic mechanism by which the throws were selected randomly from the intervals of the modelling distribution.
When students manipulated the frequencies, they constructed a target interpretation (T) of the connection between the perspectives on distribution. During this second phase, these students’ comprehension of the random choices of the modelling distribution became more explicit. At the end of the session, their intuitive understanding of the probability distribution as a “calculating mechanism” led them to perceive the modelling distribution as the intended outcome (IG or IST) and the data distribution as the actual outcome, when an
unknown finite number of throws would be randomly generated from the modelling distribution. Indeed, the students clearly articulated that the modelling distribution displays the “future” outcome and the data-centric distribution displays the results of the present mechanism at play.
Overall, with the exception of 3 students who paid attention to superficial elements of the two perspectives (such as different sizes of the two graphs), and 2 students who made only a target type connection, all other students (10) were able to articulate both intention and target type connections. The very fact that these students did articulate both types of connection suggests that exercises of the sort described in this study might contribute to successful co-ordination of the two perspectives. In fact, we claim that 2 students did successfully co-ordinate target and intention connections.
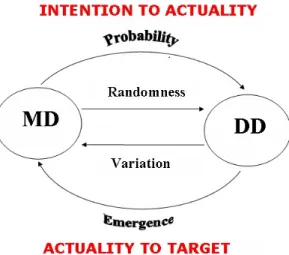
During the second phase, the students constructed a tentative model for the connection of the data-centric and modelling perspectives on distribution (Figure 3). They typically tended to gravitate towards simple causal explanations when they observed the modelling distribution, which, in some sense, generates the data. As soon as they discovered the
random mechanism that underlies the generation of the throws, they sought to assimilate this unexpected obstacle to employing causal explanations. They substituted for true
Figure 3: A tentative model for the connection of the data-centric and modelling perspectives on distribution.
deterministic causality the quasi-causal actions of agents to operationalise randomness, in a parallel manner to how Piaget claims that mankind invents probability to operationalise randomness (Piaget and Inhelder, 1951/1975).
Many students first recognised variation in data and made the connection from data-centric to modelling perspectives, the target interpretation. Students had great difficulty, however, in operationalising variation to explain this connection, and turned to relatively vague references to emergence, as if emergence were a causal agent. Quasi-causal emergence becomes, therefore, the driving mechanism by which the data-centric distribution targets the modelling distribution.
Some students made an intuitive synthesis of the modelling and data-centric distributions when they constructed an intentionality model that is dependent upon a strong appreciation of quasi-causal probability and a target model that is dependent upon the recognition of quasi-causal emergence.
Second Study: Virtual School
The Virtual School simulation study investigated how 15-year-old students built connections between probability to statistics and to simulated phenomena within a
TinkerPlots2 computer-based environment.
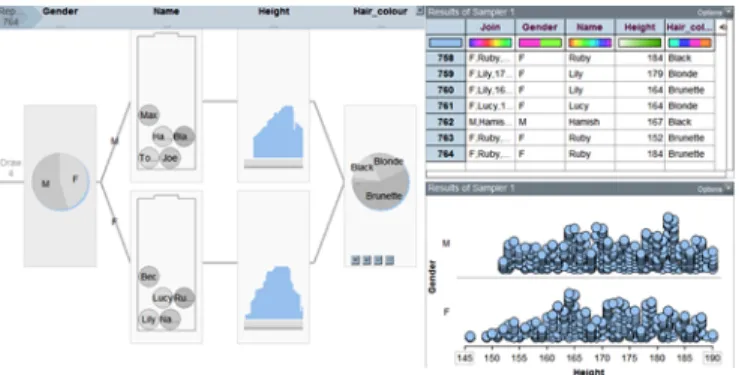
Students were asked to use TinkerPlots2 features to build a “Data Factory” (see Figure 4) to generate a number of individual “virtual students” to populate a “virtual secondary school” with each virtual student created using student-defined probability distributions for each of the different variables (e.g., gender, name, height).
Tinkerplots2 provided students with tools to exploit probability as a modelling tool using
the sampler, which is essentially a non-conventional form of probability distribution. The students began by setting up the sampler as a spinner in which they could visually assign
different angles for the sectors that correspond to the probability of selecting a gender for each virtual student (Figure 4). They then created two different “mixers”, one for the names
Figure 4: Data factory that simulates a ‘virtual school’
of each gender, and placed names in each mixer, from which one name was chosen at random for each virtual student of the appropriate gender.
The students decided to introduce another attribute for the virtual students: height. The boys set up two samplers, one each for boys’ and girls’ heights, as a probability density function by drawing two curves, as shown in figure 4. They also designated the additional attribute of hair colour and set up a sampler for this attribute as a spinner defining the sizes of its sectors.
The students of this study realised that they were going to have many data for each student. They clearly articulated that: “This is getting complex. For a student, we have a choice of gender, name, and height. We are going to have many data for each student”. The students of this study seemed to find it complex when a person or an object is presented as comprising a set of attributes. It was interesting how they used a modelling approach as an intermediate step in attempting to perceive a holistic entity, such as a virtual student, as consisting of a cluster of pieces of data.
When they set a sampler as a probability density function by drawing a curve based on the users’ personal experiences, they drew connections between probability, statistics, and the simulated phenomenon. When the boys were challenged to draw a curve that mirrored a probability density function of heights, they first identified the area where the most common heights were accumulated (what we could consider the “signal,” though they did not use this term) and then talked about the variation (what we could consider the “noise”) of heights around that area. These students seemed to realise that the nature of a reasonable approximation of real or simulated phenomena lies in the relationship between signal and noise. A good co-ordination of signal and noise requires a fairly good knowledge of the phenomenon at hand, so that the students could design the TinkerPlots Data Factory in such a way that it would generate sample data which would resemble the real-world phenomena it was intended to model. The students seemed to realise the importance of the choices they made as modellers, thus they focused their attention on the distribution of heights they created in the sampler and the other attributes, such as gender and hair colour.
Results from the students’ activity, showed that the positioning of probability as a modelling tool that was used to build models in computer-based simulations, brings as, Pratt
(2011) suggested, distribution of data (e.g. distribution of students’ heights) into the foreground, not as a pre-determined entity, but as a non-fixed entity, open to debate.
When students were working on the task of comparing the data distribution of the simulated heights to the distribution they created in the sampler, they appeared to have some difficulty understanding the nuances of probability. Nonetheless, they were not without insight. The students articulated situated heuristics, for example “there is always gonna be exceptions to the graph. They’re not always gonna be exactly as we plan out. Because this is based on probability and probability...just because we see that (pointing to the distributions they created in the sampler)...like it doesn’t mean that it will follow that 100%”. This situated abstraction can be interpreted as a construction of a relatively naïve conception of the use of probability both as a modelling tool and as a measure of confidence that one can give to the model they created. However, another possible interpretation of this situation could be that when the model is run a few times, there is stability in the peaked data but there is some variation observed in the details of the shape, thus one of the students in the study could not recognize or accept the absolute resemblance of the distributions of heights to the curves students created in the sampler due to the existence of many variables that caused variation. When they excluded one variable from the attributes, the students were better able to draw conclusions about the resemblance of the distribution of the generated data with what they designed in the sampler. By excluding variables from the model, thus reducing complexity, the students expressed an approach to introducing the variables in a systematic way that might benefit students exploring the connections between probability and the statistical data generated by simulated phenomena.
DISCUSSION
A good co-ordination of signal and noise requires a fairly good knowledge of the phenomenon at hand, so that modellers can make “optimal” choices when designing a model that will generate sample data that resembles as much as possible the real-world phenomena it is intended to model. The way students express this relationship between signal and noise is of paramount importance while they are working at the concrete level (Batanero et al., 2005) observing a real situation. Expressions focusing on the relation of signal and noise, involve elements of abstraction and simplification of reality with respect to the real situation studied. This might help students move to the second modelling stage (Batanero et al., 2005) and develop models that are represented in a symbolic system suitable for probability calculus.
Computer simulations such as the BasketBall simulation or Tinkerplots2, must lead to consideration of associating a probability distribution with a random experiment, with the important part played by building links between variation, theoretical models, simulations, and probability. These are the areas where sophisticated understanding and application of chance can be useful to students in decision making and modelling when modelling everyday phenomena.
REFERENCES
Australian Curriculum, Assessment and Reporting Authority. (2010). Australian
Curriculum: Mathematics.
Batanero, C, Henry, M, & Parzysz, B. (2005). The Nature of Chance and probability. . In G. A. Jones (Ed.), Exploring Probability in School: Challenges for Teaching and Learning
(p. 15-37). New York: Springer.
Borovcnik, M. (2011). Strengthening the role of probability within statistics curricula. In C. Batanero, G. Burrill, and C. Reading (Eds.), Teaching Statistics in School
Mathematics−Challenges for Teaching and Teacher Education, A Joint ICMI/IASE
Study: The 18th ICMI Study. (pp. 71-83). New York: Springer.
Chaput, M., Girard, J.-C., & Henry, M. (2011). Frequentist approach: Modelling and simulation in statistics and probability teaching. In C. Batanero, G. Burrill, & C. Reading (Eds.), Teaching Statistics in School Mathematics−Challenges for Teaching and Teacher
Education, A Joint ICMI/IASE Study: The 18th ICMI Study. (pp. 85-95). New York:
Springer.
De Moivre, A. (1967). The doctrine of chances: or a method of calculating the probabilities
of events in play. New York: Chelsea Publishing Company (Original work published in
1756, London: A. Millar).
Makar, K., & Rubin, A. (2009). A framework for thinking about informal statistical inference. Statistics Education Research journal, 8(1), 82-105.
Mises, R. von (1952). Probability, statistics and truth (J. Neyman, O. Scholl, & E. Rabinovitch, Trans.). London: William Hodge and company. (Original work published 1928).
Piaget, J., & Inhelder, B. (1975). The Origin of the Idea of Chance in Children (L. J. Leake & P. D. Burell & H. D. Fischbein, Trans.). London: Routledge & Kegan Paul. (Original work published in 1951)
Pratt, D. (2011). Re-connecting probability and reasoning about data in secondary school
teaching. Paper presented at 58th ISI World Statistics Congress. Dublin, Ireland.
Prodromou, T. (2008). Connecting thinking about distribution (Unpublished doctoral dissertation). University of Warwick, Warwick, UK.
Prodromou, T., & Pratt, D. (2006). The role of causality in the Co-ordination of the two perspectives on distribution within a virtual simulation. Statistics Education Research
Journal, 5(2), 69-88.
TinkerPlots: Dynamic data exploration (Version 2.0) [Computer software]. Emeryville: CA: Key Curriculum Press.
Tukey, J. W. (1977). Exploratory Data Analysis. Reading, MA: Addison−Wesley Publishing Company.
Wild, C., & Pfannkuch, M. (1999). Statistical thinking in empirical enquiry. International