Performance Model Driven QoS Guarantees and Optimization in Clouds
Jim (Zhanwen) Li, John Chinneck,
Murray Woodside
Dept. of Systems and Computer Engineering
Carleton University, Ottawa Canada
{zwli | chinneck | cmw}@sce.carleton.ca
Marin Litoiu
School of Information
Technology,
York University, Toronto
[email protected]
Gabriel Iszlai
IBM CAS Toronto
[email protected]
Abstract
This paper presents a method for achieving optimization in clouds by using performance models in the development, deployment and operations of the applications running in the cloud. We show the architecture of the cloud, the services offered by the cloud to support optimization and the methodology used by developers to enable runtime optimization of the clouds. An optimization algorithm is presented which accommodates different goals, different scopes and timescales of optimization actions, and different control algorithms. The optimization here maximizes profits in the cloud constrained by QoS and SLAs across a large variety of workloads.
1. Clouds and Optimization
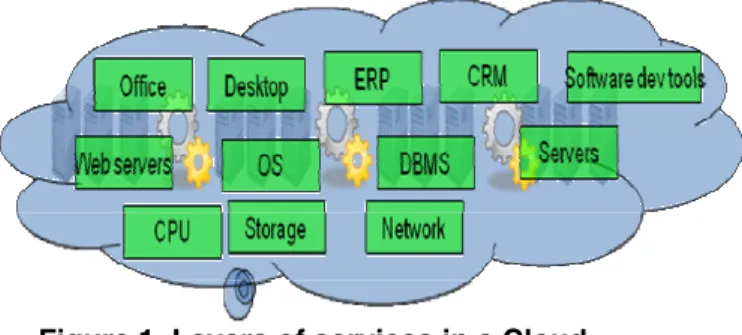
A public cloud is a collection of computers providing services at retail, where users pay for services they use (processing cycles, storage or higher level services), and do not worry about the mechanisms for providing these services. A private cloud, say within a company, may expose more mechanisms and provide more control to its users. Cloud management is responsible for all resources used by all the applications deployed in the cloud, and the opportunity for global resource optimization is a major driver for implementation of clouds. Clouds depend on virtualization of resources to provide management combined with separation of users [14].
Each application in a cloud sees a virtual environment dedicated to itself, such as virtual machines for its deployable processes and virtual disks for its storage. The cloud management allocates real resources to this environment by, for instance, increasing the share of a real processor or memory taken by a virtual machine, or by deploying additional virtual machines with replicas of application processes.
The application offers services, and also uses services offered by other applications. Each service has a price (Pc for service class c), and we will consider that the
application collects this price whenever its services are used, and pays this price when it uses other services. Each real resource also has a price paid by the application, for instance each second of CPU time has a price (Ch for host processor h). The profit of the
application provider AP and the cloud provider CP can thus be calculated. We assume that when the total AP profits are maximized, the CP can arrange that its profit is also maximized.
Quality of service is one goal of cloud management; we will treat it as a constraint on resource optimization, which seeks the maximum profit out of the minimum of resources. For simplicity we will consider only the response time of a service as a measure of its QoS, specified by AP and maintained by AP and CP.
The concern of AP is to design an efficient application, to price its services, and to manage the virtual resources allocated to it. All of these require understanding how the application consumes resources (and external services). The concern of CP is to maximize its profits from the operation of the cloud, while meeting its contractual QoS obligations to the APs.
This paper describes how the approach to resource management developed in [20][23][24][25] and [9] can be applied to large systems like clouds, and how the responsibilities for adequate QoS are divided between the application developer, application manager and cloud manager. The approach uses a performance model to integrate the system concerns and features, tracks the model to keep it up to date, and optimizes it to make resource management decisions. Other approaches are described in [1][12] [17].
2. Cloud Architecture
Figure 2 shows a view of our CERAS[12] laboratory cloud with a three-level hierarchy for optimization. Each level observes and tries to improve the situation. The application developer tunes the code over time, discovering and improving inefficient operations (for example, a set of separate database queries may be replaced by a single query of larger scope and lower cost). The AP admin tunes the run-time configuration to make the best use of the existing resources (for example, a buffer pool may be increased to improve its hit rate). The CP admin modifies the resource allocation to a given application to maintain its QoS and run it a lower cost (for example, deploying additional replicas of some elements, or increasing the size of its processor pool).
Figure 2. The CERAS cloud 2.1 Service Architecture
For management and deployment purposes a high-level architecture which captures service interfaces and requests, deployable units of software, and resources is appropriate. For simplicity we will assume that the deployable unit is the concurrent process, termed here
a task. A metamodel for such an architecture is shown in Figure 3. « Host» « UserClass» « Service» * * 1 * 1 1 « requests» « provides» « executes» « ServerTask» « Resource» Application * * 1 « requests»
Figure 3. A simplified metamodel for a service architecture
For brevity we will illustrate a service architecture not by a software model exactly, but by a performance model (LQM) with corresponding entities, which can be generated from the software (by methods like those in [20]). Figure 4 shows a LQM for a single small web application which offers services to its users and requires services from other applications. The resources in this case are the host processors. We can see services on the application boundary, offered to users and other applications, and there are internal services (without names) which are private to the application and are offered by layers internal to the application. Task Deployable Process (“Task”) Service “Entry” Entry Entry Internal Task Internal DBMS Task Internal Task Other applications Users Request to other applications
Request to external data server
Application
Figure 4. Architecture of an application, shown by an LQM
The entities in the LQM correspond one-to-one to software entities and relationships in the high-level service architecture; the deployment (which is not part of the software architecture) is also indicated by the attachments to ovals representing host processors.
The architecture of the collection of services in the whole cloud is just the union of application models,
plus a matrix of request frequencies from one service to another, through which the applications interact. This includes infrastructure services such as directories.
2.2 Performance model
The role of a performance model is to predict the effect of simultaneous changes to many decision variables, and to assist in making optimal decisions over many variables. Without a model the complex interactions among these decisions cannot be predicted. The use of performance models for optimizing decisions in autonomic control was shown in [20], and this work is an extension to handle larger systems.
Any performance model could be used; an LQM [6][15][19] is a good choice because of its correspondence to architecture, and its representation of layered resource behaviour [5]. Tasks and processors are the resources shown in Figure 4, but other resources such as IO devices and buffers can be included. The performance parameters of the LQM include CPU demands of entries and mean requests from one entry to another, including external services. The LQM is a kind of extended queueing network model and can be solved to predict throughputs, mean queueing delays and mean service delays at entries, and resource utilizations. For more detail see [5][6][15][19].
2.3 Workload and QoS Requirement
The workload describes the intensity of the streams of user requests for service, in terms either of a throughput fc for user class c, or the number Nc of users
that are interacting and their think time Zc. In this work
we assume that each service that is requested by users has its own request class c, with Nc users and think
time Zc sec. Zc represents the user’s mean delay
between receiving a response, and issuing its next request. If there workload is specified as throughput, it can be easily converted in number of users and think time.
Each class has either a required throughput fc,min or a
required user response time Rc,max. Rc,max can be
re-expressed as a minimum user throughput requirement using Little’s well-known result:
fc≥ fc,min = Nc /(Rc,max + Zc) (1)
In this way the original delay requirements are translated into equivalent throughput requirements, and the optimization deals only with throughputs.
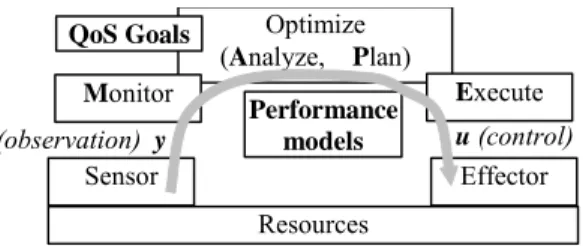
2.4 Optimization loops and models
In CERAS the three feedback loops shown in Figure 2 can all be regarded as having the structure shown in Figure 5, with differences in what is controlled and in the model used to make decisions. The developer modifies the code using intuitive mental models for performance tuning, perhaps guided by principles such as given in [17]. It is also possible for the developer to use a performance model created from design documents (e.g. see [20]) and to derive design decisions from it [20][22].
The models used by the application administrator may be simple feedback loops such as load balancing, or may take advantage of a performance model as described in [13] [20], with decisions limited in scope to the one application and the resources provided to it. By itself this level may not have sufficient capability to assure QoS. Optimization activities performed by application and cloud Administrators can implemented through Autonomic Managers based on models.
The cloud administrator uses a global LQM and makes decisions about what resources to allocate to each application. In this work the decisions suggest the deployment of each task, including task replication.
While optimization approaches for the developer and the application administrator have been considered in previous work, the large-scale techniques necessary for the cloud level have not been examined before. Section 4 will indicate a promising approach for the cloud level which has been prototyped for the CERAS cloud. Optimize (Analyze, Plan) Monitor Sensor Resources Effector Performance models Execute (observation) y u (control) QoS Goals
Figure 5. Feedback control for QoS and optimization
3. Engineering for QoS and Optimization
The design requirements can be summarized: • The application software should be efficient andadaptable to different run-time situations,
• The cloud must provide infrastructure for deploying and monitoring application elements and user QoS,
• The cloud feedback loop must be able to track the performance model and to optimize the management decisions.
3.1 Developer responsibilities
Mostly the cloud hides resource management from the developer, so that he can focus on implementing functions. For QoS, efficient execution is the developer’s responsibility. Application management may also require the software to include interfaces for modifying internal resources such as caches and control paths such as prefetching of data
A subtle goal for the developer is to provide flexibility in the concurrency architecture (the allocation of functions to tasks) to support adaptable deployment at runtime. More concurrency creates flexibility, but also introduces overhead costs for interprocess communication. Event based architectures may help address this issue [4], as they provide asynchrony and concurrency at the level of the service.
Another goal for the developer is to provide the structure of the performance model. This can consists of the component interactions diagrams, where components are the software artifacts (services) that are deployed form the “tasks” depicted in Figure 4. The structure of the model can be passed to the network administrator and cloud as a deployment descriptor.
3.2 QoS and Optimization in the life cycle of the application on the cloud
The performance model of the managed component, application, and cloud is completed with runtime data provided by the sensors. It supports Application tuning at all times and is relatively fast and inexpensive, so it is the preferred way to achieve QoS goals. However it may not be capable by itself of maintaining a SLA, and it cannot set its own QoS targets.
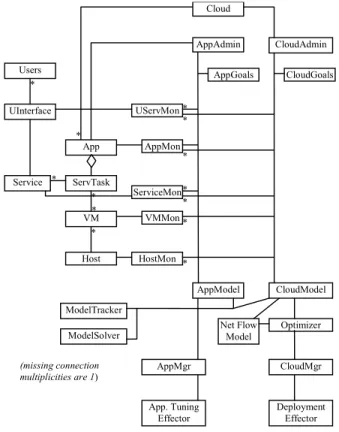
3.3 Architecture Implications
The cloud incorporates several elements in order to provide the feedback control shown in Figure 5; the
resulting architecture is sketched in Figure 6. Monitoring of resources provides utilization information at the level of physical processor, virtual machine, and other logical resources. Monitoring of user requests gives measures of throughput and response time. The performance model tool stores a model of each application and its deployment, and includes estimation tools for updating the model parameters periodically from the monitoring (the ModelTracker). When a new application is loaded an initial performance model is provided by AP, derived either from the application design (as described in [20]) or by tracing its behaviour (as described in [25]). Finally some deployment effector tools must be included to load and initialize VM images on host processors, as indicated by the optimization.
The management entities on the right can be implemented within autonomic managers.
Users UInterface Service UServMon App VMMon CloudAdmin VM AppMon ServTask Host HostMon ServiceMon AppGoals CloudGoals CloudModel Net Flow Model Deployment Effector AppModel Optimizer CloudMgr AppMgr App. Tuning Effector ModelTracker ModelSolver * * * * * * * * * * (missing connection multiplicities are 1) AppAdmin * * * Cloud
Figure 6. Sketch of model-based optimization architecture 3.4 Optimization technique
The optimization technique uses an auxiliary network flow model (NFM [7]) showing the flow of execution demands at the processors and how they combine to produce flows at the tasks, services and
user-responses. The NFM consists of nodes representing entities and arcs representing flows of execution demand, in CPU-sec of execution per sec. • nodes for processors have a flow equal to the processor utilization.
• nodes for tasks (each of which may represent multiple replicas) have flows from all processors on which the task is deployed.
• nodes for services (or entries in the LQN) have flows from the task which implements the service. • nodes for user classes are a special type called a processing node [7], with flows from all services used by the class, and output flows to the user representing the class throughput.
The processing node converts the request rate into a demand rate, using fixed parameters which capture the workload of each service and the use of services by the class requests. A fragment of a NFM graph is shown in Figure 7 . More details are given in [9], where the model is applied only to minimize cost subject to constraints, and profit is not included.
An iterative approach is used, which can only be sketched here. The NFM gives an optimal deployment, allocating host reservations to tasks. This is used in the LQN to predict the effect of contention, which will reduce throughputs. The NFM is adjusted by introducing pseudo-flows at the services, which account for the lost capacity due to contention, and the NFM is re-solved. Experience with convergence of the iteration has been excellent.
.
.
.
h
.
.
s
.
.
.
.
.
Hosts Services Classes of Usersc
t
.
.
.
Server Tasks.
.
.
.
.
.
.
[0, Ωh, Ch] αht dsc γsc βts 1 [fc ,SLA, ∞, Pc] fc (processing node parameters)Figure 7. A network flow model
Note that the NFM reserves a fraction of a host for a task, which is implemented in practice by creating a virtual machine VM that takes a fraction of its host cycles (for simplicity, each task is assumed to have its own virtual machine, a constraint which can eventually be removed). The LQN models each VM as a separate processor running at a slower rate reflecting the fraction of capacity allocated to it.
3.5 Objective function
An objective function for cloud optimization which respects the individual applications will be described. It is linear in throughput, which is well matched to the NFM optimization.
• Each service class c offered to users has a price per response of Pc,
• Each host h has a price of cpu execution of Ch per
CPU-sec, including unused CPU-sec allocated in order to reduce contention delays,
• In the NFM results, each task t has a reservation αht
in CPU-sec per sec, on some host h. Then an application App has a profit
PROFITApp = Σc in CAppPcfc −Σh,t in TAppChαht
where CApp and TApp are the sets of user classes and
tasks involved with App. The cloud optimization is to maximize the total profits
TOTAL = ΣApp PROFITApp (2)
subject to constraints. When the total profit to the APs is maximized, presumably the CP share of this is also maximized, although the mechanism for this is not considered here.
We envision two kinds of constraints:
• a maximum user response time Rc,max. for each class c, or a minimum class throughput fc,min corresponding
to it
• a minimum profit PROFITApp,min for each
(Other services are indicated by a dashed outline) eBrowse InventoryDB {7} eRead eUpdate ShoppingCart {10} StoreApp {90} eCustUp CustomerDB {1} eShipService ShippingServer eAuthorize PaymentServer eStoreAccess WebServer {90} [2] [25] [2,1] [2] [30] [5] [1, 10] FileServer {10} eFRead eFWrite [3] [1, 3] pHTTPServer {1} pStore {3} pDBServers pFileServer eUser1Behav UserClass1 {250} [1000] eUser2Behav UserClass2 {100} [10000 ] pUsers {inf} ( 1 ) ( 0.9 ) ( 7.3 ) ( 6.3 ) ( 1 ) ( 0.04 ) ( 1 ) ( 1 ) ( 1 ) ( 1 ) ( 2.5 ) ( 1 ) ( 1.8 ) eReadImage ImageDisk {1} [1] pImgDisk {1} ( 15 ) eLogin eOrder ( 0.01 ) ( 0.09 ) [100] [15] eBuy eCart ( 3 ) eCustRd [3] [1500] [230]
Figure 8. A web-based application to be deployed in the cloud
4. Case Study
We consider a cloud with 1000 VMs and from one to 50 applications. Each application has the same architecture and the LQN shown in Figure 8, but different (randomly generated) parameters and requirements. The “incremental” deployment places each application on a sufficient number of processors to meet its profit and QoS constraints, disjoint from already allocated processors. The “full” deployment optimizes the overall profit in Eq. (2) for a deployment on the hosts required by the “incremental” scenario, up to 350 for the 50 applications. Since some hosts are specifically assigned to some kinds of tasks (e.g. the data hosts are only available to the database), the maximum profit is achieved when certain profitable hosts are exhausted, though some other types of hosts have capacity remaining.
Table 1 shows the optimal TOTAL profit as the scale increases from 1 to 50, and the number of hosts and VMs used. It compares the incremental allocation approach to a full optimization for every N. The disadvantage of full optimization is the effort required to redeploy the existing applications at each step.
However its advantage is that it can maximize profit. In the present formulation, this is done by increasing the deployment of the most profitable application. Other policies can be implemented, involving for instance additional constraints per class. The last row shows the running time (in seconds) taken by the full optimization corresponding to the size of the cloud, on a state-of-the-art PC.
Table 1 PROFIT as scale increases
N Applic. Instances 1 10 20 30 40 50 Incremental: TOTAL profit 38.5 276 488 760 1042 1278 hosts used 8 83 161 244 324 408 VMs 10 100 200 300 400 500 full optimization TOTAL profit 38.5 336 637 861 1270 1649 hosts used 8 70 139 199 267 321 VMs 10 135 360 604 807 958 Running time (sec) 0.36 23.7 106.2 128.6 207.7 295.4
We can see that the full optimization provides substantially greater profit, using substantially less resources, at every N>1. An effective part of the optimization strategy is to create additional VMs and use the flexibility to allocate multiple VMs to a single processor, nearly 3 to 1 at N=50.
5. Conclusions
This paper has summarized a new optimization approach, and shown how it can feasibly be applied to profit maximization across a cloud. It has shown the requirements to support the approach, and an architecture for the necessary management tools.
The approach is effective and scalable to meet the new challenges of cloud computing. A prototype of the optimization tool, integrated in a loop based on Figure 5, has been implemented and demonstrated on running laboratory-scale services, although for different optimization goals.
Cloud computing gives a new business service model and requires advanced autonomic management solutions. Clouds can be very large, and at some scale the performance model calculations will need to be partitioned into subsets of processors. The results here indicate that the subsets can be quite large, large enough to accommodate many applications automatically.
Further development to take into account memory allocation, communications delays, VM overhead costs, and licensing costs of software replicas appears to be feasible and is the subject of this ongoing project.
Acknowledgements
This research was supported by OCE, the Ontario Centres of Excellence, and by the IBM Toronto Centre for Advanced Studies, as part of the program of the Centre for Research in Adaptive Systems (CERAS).
References
[1] N. Bobroff, A. Kochut, and K. Beatty. "Dynamic placement of virtual machines for managing SLA violations”. In Proc.Integrated Management 2007, pp 119-128, Munich, May 2007.
[2] CERAS (Centre of Excellence for Research in
Adaptive Systems) https://www.cs.uwaterloo.ca/twiki/view/CERAS
[3] M. Chang, J. He, E. Castro-Leon. "Service-Orientation in the Computing Infrastructure ", Proc. 2nd IEEE Int. Symp. on Service-Oriented System Engineering (SOSE'06)
[4] Distributed event-based systems, Proc 2nd int. conf. on distributed event-based systems, Rome, 2008.
[5] G. Franks, D. Petriu, M. Woodside, J. Xu, P. Tregunno, "Layered bottlenecks and their mitigation," Proc 3rd Int. Conf. on Quantitative Evaluation of Systems QEST'2006, Riverside, CA, Sept 2006, pp. 103-114.
[6] G. Franks, T. Al-Omari, M. Woodside, O. Das, S. Derisavi, “Enhanced Modeling and Solution of Layered Queueing Networks”, IEEE Trans. on Software Eng. Aug. 2008.
[7] J.W. Chinneck, "Processing Network Models of Energy/ Environment Systems", Computers and Industrial Engineering, vol. 28, no. 1, pp. 179-189. 1995
[8] IBM, "From Cloud Computing to the New Enterprise
Data Center", http://download.boulder.ibm.com/ibmdl/pub/software/
dw/wes/hipods/CloudComputingNEDC_wp_28May.pdf, 2008.
[9] Z. Li, J.W. Chinneck, M. Woodside, M. Litoiu “Fast Scalable Optimization to Configure Service Systems having Cost and Quality of Service Constraints”, submitted for publication, available to reviewers from the authors.
[10]M. Litoiu, J. Rolia, G. Serazzi, "Designing Process Replication and Activation: A Quantitative Approach ",
IEEE Trans. Software Eng., v.26 n.12, p.1168-1178, Dec 2000
[11]M. Litoiu, APERA (Application Performance Evaluator
and Resource Allocation Tool) http://www.alphaworks.ibm.com/tech/apera
[12]A. Karve, T. Kimbrel, G. Pacifici, M. Spreitzer, M. Steinder, M. Sviridenko, and A. Tantawi, "Dynamic placement for clustered web applications", Proc. 15th Int. Conf. on the World Wide Web May 2006. ACM, New York. [13]D. Menascé, H. Ruan, H. Gomaa: "A framework for QoS-aware software components ", Proc 3rd ACM Int.
Workshop on Software and Performance (WOSP 2004), pp
186-196, Jan 2004.
[14]M. Steinder, I. Whalley, D. Carrera, I. Gaweda D. Chess, "Server virtualization in autonomic management of heterogeneous workloads ". Proc. Integrated Management (IM 2007), Munich, May 2007.
[15]J. Rolia, K. Sevcik, "The Method of Layers ". IEEE Trans. Softw. Eng. 21, 8 (Aug. 1995), pp 689-700.
[16]J. Rolia, R. Friedrich, C. Patel, “Service Centric Computing - Next Generation Internet Computing”. In
Performance 2002, Tutorial Lectures eds M. Calzarossa, S. Tucci, LNCS, vol. 2459. Springer, pp 463-479.
[17]CU. Smith, LG. Williams, Performance Solutions, Addison-Wesley, 2002.
[18]Tang, C., Steinder, M., Spreitzer, M., and Pacifici, G. "A scalable application placement controller for enterprise data centers ". In Proc. 16th Int. Conf. on the World Wide
Web, Banff, May 2007, WWW '07. ACM, New York, pp
331-340.
[19]C.M. Woodside, J.E. Neilson, D.C. Petriu and S. Majumdar, "The Stochastic Rendezvous Network Model for Performance of Synchronous Client-Server-Like Distributed Software ", IEEE Trans Computers, Vol. 44, No. 1, January 1995, pp. 20-34
[20]M. Woodside, D. C. Petriu, D. B. Petriu, H. Shen, T. Israr, J. Merseguer, “Performance by Unified Model Analysis (PUMA)”, Proc. ACM Int. Workshop on Software and Performance (WOSP 2005) June 2005.
[21]M. Woodside, T. Zheng, M. Litoiu, “Service System Resource Management Based on a Tracked Layered Performance Model”, Proc. Autonomic Computing 2006 (ICAC 06), pp 175- 184, Dublin, June 2006.
[22]Xu, Jing, “Rule-based Automatic Software Performance Diagnosis and Improvement”, Proc 7th ACM Int. Workshop on Software and Performance, Princeton, NJ, June 2008, pp 1 – 12.
[23]T. Zheng, M. Woodside, M. Litoiu, "Performance Model Estimation and Tracking using Optimal Filters", IEEE Trans. Software Engineering, V 34 , no. 3 (May 2008) pp 391-406.
[24]T. Zheng, J. Yang, M. Woodside, M. Litoiu, G. Iszlai, "Tracking Time-Varying Parameters in Software Systems with Extended Kalman Filters", Proc CASCON 2005, Toronto, Oct. 2005
[25]T. Zheng, Model-based Dynamic Resource
Management for Multi Tier Information Systems, PhD.