An Empirical Study of a Highly Available File System
Brian D. Noble and M. Satyanarayanan
School of Computer Science
Carnegie Mellon University
fbnoble,satya
g@cs.cmu.edu
Abstract
In this paper we present results from a six-month empirical study of the high availability aspects of the Coda File System. We report on the service failures experienced by Coda clients, and show that such failures are masked suc-cessfully. We also explore the effectiveness and resource costs of key aspects of server replication and disconnected operation, the two high availability mechanisms of Coda. Wherever possible, we compare our measurements to simulation-based predictions from earlier papers and to anecdotal evidence from users. Finally, we explore how users take advantage of the support provided by Coda for mobile computing.
1
Introduction
Providing high availability is a dominant theme of current file sys-tem research. Examples of syssys-tems with this goal include Coda[18], Echo[6], Ficus[14], HA-NFS[2], Deceit[22], and FACE[3]. Now that serious use of such systems is feasible, it is appropriate to ask how well their high availability mechanisms function in practice. This paper is our attempt to answer this question for the Coda File System. To the best of our knowledge, this is the first empirical study of a highly available distributed file system.
Empirical studies of file systems have a long history, stretch-ing back to the 1970s. Early studies of timesharstretch-ing file systems such as those by Stritter[26], Smith[23], Satyanarayanan[15, 16], This work has been supported by the Advanced Research Projects Agency (Avion-ics Lab, Wright Research and Development Center, Aeronautical Systems Division (AFSC), U.S. Air Force, Wright-Patterson AFB, Ohio, 45433-6543 under Contract F33615-90-C-1465, ARPA Order No. 7597 and Hanscom AFB, Contract F19628-93-C-0193, ARPA Order No. A700), the National Science Foundation, the IBM Corporation, Digital Equipment Corporation, and Intel Corporation. The views and conclusion expressed in this paper are those of the authors, and should not be interpreted as those of the funding organizations or Carnegie Mellon University.
Ousterhout[13], and Floyd[4, 5] formed the basis for our initial un-derstanding of file system usage. This unun-derstanding was crucial to the design of distributed file systems such as AFS[7] and Sprite[12]. In 1991, Baker et al.[1] examined Sprite with a view to establishing how closely its real usage matched predicted usage. More recently, Spasojevic and Satyanarayanan[24] reported on the use of wide-area AFS.
In this paper, we report on data collected from Coda over a 6-month period. During this time, Coda was relied on daily by a community of almost 40 users. Our data shows that failures do occur in practice, and that Coda’s high availability mechanisms are effective in masking them. We establish that users do take advantage of Coda’s high availability mechanisms, and that the resource overhead of these mechanisms is modest under conditions of real use.
Our paper begins with a brief overview of Coda. We then discuss the factors that influenced our data collection strategy and present its design. The bulk of the paper is a presentation of our measurements. Wherever appropriate, we point out ways in which these measurements corroborate or contradict simulation predic-tions and anecdotal user observapredic-tions. We conclude with a brief summary of results.
2
The System Studied
Coda, a descendant of AFS, was designed to offer continued access to data in the face of server and network failures. In this section, we provide a short overview of Coda; further details can be found in earlier papers[9, 11, 17, 18, 19, 20, 25].
Clients view Coda as a single, location-transparent shared Unix file system. The Coda name space is mapped to individual file servers at the granularity of subtrees called volumes[21]. At each client, a user level process, Venus, caches data on demand on the client’s local disk. An in-kernel VFS driver[10], called the Mini-Cache, intercepts and forwards file references to Venus.
achieve high availability. Both mechanisms rely on an optimistic replica control strategy. This offers a high degree of availability, since data can be updated in any network partition. The system ensures detection and confinement of conflicting updates after their occurrence, and provides mechanisms to help users recover from such conflicts.
The first high-availability mechanism, server replication, al-lows volumes to have read-write replicas at more than one server. The performance cost of server replication is kept low by caching at clients, and through the use of parallel access protocols.
The second high-availability mechanism, disconnected oper-ation, allows continued read and write access to cached data even when no server is accessible. Disconnections may be involuntary or voluntary. Involuntary disconnection typically occurs when there is temporary communication failure. Voluntary disconnection occurs when a user deliberately isolates a client from the network. This mechanism is especially valuable for mobile computing: a user may be isolated because no networking capability is available at the re-mote location, or to avoid use of the network for economic or power consumption reasons.
3
Measurement Strategy
In this section we first describe the key factors that influenced our measurement strategy, and then describe the data collection archi-tecture that we developed to address these factors. We complete the section with a description of the hardware and user environment in which our data was collected.
3.1
Considerations
A dominant factor influencing the design of our data collection was the desire to study the system over a long period of time. Such a long-term study is valuable because our user community is expected to grow, thereby increasing the diversity of use of the system. Further, mobile computing is a new mode of interaction, and people’s use of the system may change as they grow more familiar with it, and as the portable computers on which Coda runs improve.
Long-term data collection makes it likely that what is collected may have to change over time. Because Coda is a system undergoing active development, appropriate refinements to the instrumentation will be necessary as new functionality is added and improvements are made. Other changes to the instrumentation may be warranted by our own improved understanding of the system based on early measurements.
These considerations have two implications. First, the data collection mechanism has to be flexible and easy to administer.
Second, the data analysis software has to cope with data collected over a very long time, spanning many different versions.
Another major factor influencing our design is the need to min-imize the impact on users. Data collection should not require active intervention by users, especially in a long-term study. Nor should it degrade performance or reduce availability noticeably; otherwise, users may alter their behavior to cope with these shortcomings.
A final factor in our design was the need to avoid losing data in spite of the wide range of failures experienced by clients and servers. A particularly challenging problem was to extend the data collection to voluntarily disconnected portable machines that might not be reconnected to the network for many days.
3.2
Measurement Framework
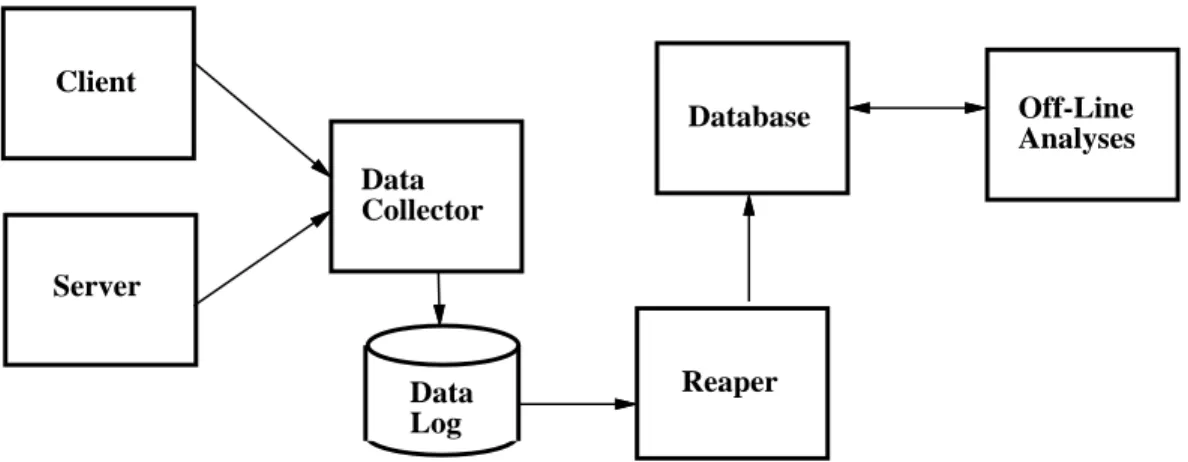
Figure 1 illustrates the data collection architecture that we developed in response to the concerns described in the previous section. Both Coda clients and servers are instrumented. The data they collect is shipped to a central data collector, which spools it to a log on disk. Once a day, a reaper process reads this data and inserts it into a relational database. This two-stage collection process removes the database from the critical path of data reporting by clients and servers.
Data collection is subject to a wide range of failures. For ex-ample, the data collector may be down for hardware or software reasons. A client or server may fail, causing buffered data to be lost. There may be a network outage that prevents a subset of the clients and servers from contacting the data collector. An espe-cially common form of network outage in Coda is the voluntary disconnection of a portable computer, sometimes for days.
We provide robustness in the face of such failures through two buffering strategies. On servers and connected clients, we buffer the data in volatile memory and periodically flush it to the data collector. The frequency of flushing, currently two hours, is a compromise between minimizing lost data and reducing collection overhead. If the collector is down, servers and clients retain data until a future flush succeeds. On disconnected clients, which may be turned on and off many times before reconnection, we buffer collected data in non-volatile storage until reconnection. We use the recoverable virtual memory (RVM) transactional mechanism for this purpose because of its clean failure semantics[20]. Since RVM resources are precious on a resource-poor portable computer, we stric tly and conservatively cap its usage; this favors availability of the system over completeness of the data collected. In combination, these robustness mechanisms have proved to be quite effective – in our experience, the number of occasions on which we have lost data has been negligible.
Our architecture minimizes the performance impact of data collection on clients and servers. We summarize data at the clients
Server
Data
Collector
Data
Log
Reaper
Database
Off-Line
Analyses
Client
Figure 1: Data Collection Architecture
and servers whenever doing so is inexpensive and results in minimal loss of information. Such summarization reduces the total amount of data that must be stored as well as the burden of shipping data. The collected data is only processed offline, after it resides in the database.
We emphasize flexibility throughout the data collection process. The bulk of the data collector’s implementation is independent of the specific data being collected. When changes are made to a data type, only a small portion of the collector needs to be recoded. When the data collected is changed, we ensure that only upgraded clients and servers are able to report data; all others are re jected with an advisory message. Thus, both system administrators and users soon learn of obsolete clients and servers. This is important because it would be administratively difficult to atomically update all nodes, especially where some of them may be disconnected.
Our use of a relational database as the permanent repository of collected data provides us with an open-ended mechanism for fram-ing questions long after the data has been collected. It also provides us with a scalable tool for storing and manipulating large quantities of data at a fine granularity. By including version information with the data and in post-processing queries, we are able to cope with multiple generations of data.
3.3
Coverage
Our data collection took place in a system with 40 clients, of which 15 were portable machines. There are 39 user accounts, roughly 25 of which are used regularly. The user community is comprised of Coda developers as well as other computer science researchers. There are 10 file servers, organized as one triply-replicated set of production servers, one triply-replicated set of beta test servers, and four independent alpha test servers. Each production server holds almost 1.4 GB of data, while each of the beta test servers holds about 1.1 GB. Data on both the production and beta servers are regularly
used by our entire user community. Alpha test servers are only used by Coda developers.
Data collection began in March 1992. There was an initial test period lasting 6 months, after which the data was analyzed and the collection software revised. Another revision was made 10 months later, based on the results of a second test period. The data presented in this paper corresponds to the third major revision of our collection software. This collection began in July 1993, and covers a period of six months1. Where appropriate, we highlight data that has changed significantly since this paper was submitted for publication. That data covered only the first three months of this study.
4
Results
We present our observations as answers to a set of questions that reflect on the high availability aspects of Coda. Our discussion begins in Section 4.1 with a characterization of observed failures. We ask, “How often are service failures experienced by the system?” We then address the question, “How successful is Coda in masking these failures?”
Next, in Sections 4.2 and 4.3, we examine the two Coda mech-anisms that mask failures: server replication and disconnected op-eration. For each we ask, “How well does this mechanism work?” and, “How expensive is this mechanism, in terms of resources con-sumed?”
Finally, in Section 4.4, we ask, “Is voluntary disconnected oper-ation used as anticipated?” Since voluntary disconnected operoper-ation is a new model of computing, we would like to better understand it from the user’s perspective.
1An exception to this is the data presented in Section 4.2 on resolution. The
instrumentation for this data is more recent, and the data was only collected for four months.
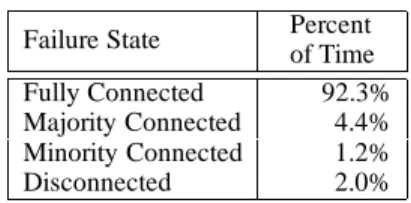
Failure State Percent of Time Fully Connected 92.3% Majority Connected 4.4% Minority Connected 1.2% Disconnected 2.0%
Table 1: Distribution of Failure States
4.1
Profile of Failures
We characterize observed service failures in Coda in three steps. First, we classify the set of failure states based on their severity. Next, we examine the longevity of those states. Finally, we show how data access degrades in each of the states.
4.1.1 Volume Connectivity
As we noted in Section 2, the Coda name space is broken into subtrees called volumes. Each volume is stored on a set of servers, known as that volume’s volume storage group (VSG). At any point in time, a client can contact some subset of the VSG known as the accessible volume storage group (AVSG).
We classify the connectivity of volumes based on the ratio of AVSG size to VSG size, as seen by each client. Note that different clients may be in different states of connectivity with respect to the same volume. A volume whose AVSG is equal to its VSG is fully connected. A volume whose AVSG is empty is disconnected. All other volumes are partially connected.
We draw a distinction between two types of partial connectiv-ity. If a volume’s AVSG is larger than half its VSG, it is majority connected. Otherwise it is minority connected. An optimistic repli-cation scheme is necessary to provide read/write access to volumes that are minority connected or disconnected. Either an optimistic or a pessimistic scheme can provide read/write access to majority or fully connected volumes.
Table 1 shows the amount of time, weighted by volume usage, clients have spent operating in varying levels of connectivity. Op-timistic replication was essential over 3% of the time. The high availability mechanisms as a whole were necessary nearly 8% of the time. Our environment has also become more stable over the past three months; these percentages were much higher over the first half of this study.
4.1.2 Longevity of Failure States
Associated with each volume on a client is the notion of the current session. A session is defined as the maximal period of time over which the AVSG for the volume does not change. Each change in
connectivity between a client and a server ends the client’s current session for each volume stored on that server, and begins a new one. We divide sessions into two categories, transient and non-transient. We consider sessions that are less than 15 minutes long to be transient. These sessions are typically due to network glitches. They may also be due to the gradual detection of a partition between a client and several servers. We chose 15 minutes because it was the smallest number that clearly exceeded the typical durations of transient events recorded in our data. It is also under the mini-mum server restart time. Of the sessions we have observed, 54% of them have been 15 minutes or less. However, these short transient sessions account for only 1% of the total observed time.
Figure 2 shows the distribution of the lengths of non-transient sessions. Fully connected sessions, shown in Figure 2(a), are the most common and tend to be longest-lived. These sessions never last more than 22 hours because of our server restart policy. Each server is restarted every night so that consistency checks performed at startup can catch corruptions at most one day after they happen. The shutdown times are staggered to reduce the likelihood of complete disconnection.
Since all of our servers are located in the same room, partial connectivity is due to server, not network, failure. Figure 2(b) shows that partially connected sessions are mostly short. These short sessions often occur when a server fails and is quickly brought back on line. However, there are some sessions that lasted much longer; these stem from more serious problems befalling a server. The histogram for the complete six month study is more heavily skewed toward short server outages than that observed during the first three months.
Disconnected sessions, shown in Figures 2(c) and 2(d), also tend toward shorter durations. Many of these short periods cor-respond to network partitions. Some of the periods corcor-respond to occasions when all servers crash due to operator error, powe r fail-ure, or software bugs. These short disconnections are instances of involuntary disconnection.
Most of the longer session lengths in Figure 2(c) are due to voluntary disconnections. Users sometimes work at home on their laptops, and often take them along on extended trips. As Figure 2(d) shows, some of these voluntary disconnections can last many days. The longest recorded disconnected session was over four days in duration. Many of our users have actually operated on their laptops away from the network for even longer periods. However, those longer periods have involved powering down their laptops, thus resulting in multiple sessions rather than one long session.
4.1.3 Masking Failures
How do these failures affect a client’s ability to satisfy file requests? We estimate this by measuring the change in failure rates
Session Length - Hours 2 4 6 8 10 12 14 16 18 20 22 >24
Percentage of Sessions > 15 mins
10 100 1 0 Total Sessions = 163,104 Mean = 9.53 hours
Session Length - Hours 2 4 6 8 10 12 14 16 18 20 22 >24
Percentage of Sessions > 15 mins
10 100 1 0 Total Sessions = 54,622 Mean = 1.74 hours
(a) Fully Connected (b) Partially Connected
Session Length - Hours 2 4 6 8 10 12 14 16 18 20 22 >24
Percentage of Sessions > 15 mins
10 100 1 0 Total Sessions = 5,398 Mean = 6.40 hours
Session Length - Hours
24 30 36 42 48 54 60 66 72 78 84 90 96 102
Percentage of Disconnected Sessions >= 24 hrs
10 100 1 18 Total Sessions = 195 Mean = 39.4 hours
(c) Disconnected (d) Disconnected — 24 hours or longer
This graph shows the distribution of the lengths of sessions, a per-volume concept as discussed in Section 4.1.2. Each histogram bucket contains the number of sessions
longer than the bucket below, but less than or equal to the number of hours of thexcoordinate. The last bucket in Figure 2(c) contains all disconnected sessions greater
than 23 hours in duration; the graph in Figure 2(d) shows the distribution of only those sessions. Note that only sessions longer than fifteen minutes were included in
these histograms, accounting for 99% of observed client operation. Also note that theyaxes are log
10scaled.
Figure 2: Longevity of Non-Transient Sessions
Fully Majority Minority
Operation Connected Connected Connected Disconnected
lookup 58% 75% 94% 86%
getattr >99% >99% 99% >99%
access 99% 99% >99% 99%
open >99% >99% >99% 99%
close >99% >99% >99% >99%
This table shows the success rates of the five most common operations seen by Venus. Connectivity decreases from left to right in the table. The consistently lower
success rates forlookupare explained in Section 4.1.3.
of the most frequently occurring file system operations on clients during various states of connectivity. Note that operations can fail even when fully connected because of application or user errors, or by programs like the shell probing search paths for system binaries. Table 2 compares the success rates for the most frequent opera-tions at clients for various states of connectivity. For thegetattr,
access, open, and close operations, degraded connectivity hardly affects success rate.
At first glance, the data forlookupseems anomalous. In all states of connectivity, its success rate is the lowest of all operations. This is partly because alookuptypically precedes other operations on an object; failure of thelookupsuppresses the later operations. Compounding this is the fact that the data for Table 2 is collected after the MiniCache has filtered out many successfullookups[25]. Combined, these two factors account for the high observed failure rate oflookup.
The message of Table 2 is that as connectivity degrades, the success rates of operations barely decline. In other words, the user does not experience a corresponding increase in failures. This confirms that Coda does indeed provide high availability of data in the face of service failures.
Note that this analysis does not take into account the secondary effects of failures upon the file references generated by a user. For example, not being able to open an editor will result in only one error reflected in our data, but this failure will prevent the user from generating those references that would have resulted from use of the editor. Unfortunately, we know of no way to quantify such sec-ondary effects of service failures. Anecdotal evidence suggests that once users become proficient at hoarding, the process of advising Venus which files should be cached, such task-disabling failures are rare.
4.2
File and Directory Resolution
Replicas in Coda may lose coherence because of update activity dur-ing server or network failures. Resolution is the process of restordur-ing coherence to all replicas of an object. In the vast majority of cases, resolution merely involves overwriting a stale replica with the most current one. However, because Coda uses optimistic replication, more than one replica of an object may have been updated during a partition. In the case of directories, many such instances of di-vergence can be resolved automatically by the system. All other instances of divergence, whether file or directory, result in resolution failure, with the replicas being marked in conflict.
In this section, we ask how often resolution is invoked and how often it succeeds. When directory resolution results in conflict we examine the causes of failure. Since directory resolution is based on an operation logging strategy, we also ask how much log
Files Directories Attempts 3,761 3,009 Successes 3,721 2,934 Weakly Equal 717 2,288 Runt Force 2,410 NA Other 594 646 Conflicts 40 54 Deadlock Avoidance NA 21
This table shows the results of file and directory resolutions observed by our collection software. For successful resolutions we further classify our data into simple resolu-tions ("weakly equal" and "runt force"), and more complex ones ("other"). Note that runt forcing does not apply to directories. We also show, for directories, how many resolution attempts could not proceed due to our deadlock avoidance policy.
Table 3: Resolutions
space is consumed. We then compare our observations with earlier predictions of log growth based on trace-driven simulation.
4.2.1 Frequency and Outcomes of Resolution Attempts
Our measurements show an average of one resolution request per volume per client every five hours. Table 3 shows the results of resolutions we have measured. The table shows that resolution succeeded over 98% of the time, requiring virtually no work in many cases. These situations corresponds to weak equality, where the replicas are actually equal, but their version information does not reflect this fact. The circumstances under which this can happen have been explained elsewhere[18]. Another common event is runt forcing. This corresponds to situations where an empty file replica was created via a previous resolution of the parent directory.
As shown in the table, there were 21 directory resolution at-tempts that had to be aborted due to our deadlock avoidance policy. These attempts are neither successful nor result in a conflict.
Table 3 indicates a conflict rate of about 1.3%, only slightly larger than that predicted by an earlier study based on AFS[9]. This discrepancy is partially due to limitations in our implementation of directory resolution, as elaborated in the next section.
4.2.2 Causes of Directory Conflicts
An attempt to resolve a directory can fail for two classes of rea-sons: semantic conflicts, arising from true non-serializability, and spurious conflicts, arising from limitations of our current implemen-tation. Table 4 details reasons for directory conflict as observed at individual replica sites participating in a resolution attempt. Since these observations must be made at the replica sites themselves, as opposed to the resolution coordinator[11], they give an upper bound on the total number of conflicts. For example, suppose client A updates filefooon replica A, and client B updates the same file
Semantic
Conflicts Count
Spurious
Conflicts Count
Name-Name 24 Rename 26
Remove-Update 12 Log Wrap 26
Update-Update 6 Propagation 0
This table shows the breakdownof causes for directory resolution failures. The left hand column shows semantic conflicts, arising from non-serializability; the conflicts listed in the right hand column arise from limitations in our current implementation. These conflicts are not mutually exclusive, and are upper bounds on the number of actual conflicts due to our instrumentation methodology. Hence, the sum of the numbers in this table may exceed the number of failed directory resolutions reported in Table 3.
Table 4: Conflict Types Observed by Replicas
fooin on replica B, which is partitioned from replica A. When the partition is healed, both replica A and replica B will record a conflict, when only one semantic conflict is present.
Semantic conflicts can be further classified into name-name, remove-update, and update-update conflicts. A name-name conflict arises when objects with the same name are created in a directory in different partitions. The removal of an object in one partition, and its update in another, results in a remove-update conflict. An update-update conflict results when the same object is modified in different partitions. The observed number of each of these types of conflicts is presented in the left hand column of Table 4.
There are three implementation limitations leading to spurious conflicts in Coda. First, resolution of cross-directory renames is not currently supported. Second, resolution logs are of finite length and may wrap-around during long partitions with intense update activity. Third, propagation of a previously detected directory conflict to newly accessible replicas is counted as a separate conflict by our accounting mechanism. The right hand column of Table 4 shows the observed impact of each of these limitations.
4.2.3 Size of Directory Resolution Logs
Since Coda uses a log-based approach to directory resolution, it is important to ask how much space is consumed by these logs in practice. Figure 3 shows the distribution of maximum size, or high-water mark, attained by each volume’s log each day. The figure indicates that log growth is quite modest, with a mean high-water mark of 19KB. Although a few instances of high-water marks over 250KB were observed, the vast majority were under 200KB.
A previous study, based on trace-driven simulation of the reso-lution subsystem [11], predicted a maximum log-growth of 3.3MB per volume per day. Our observations indicate that this grossly overestimates true log growth – the largest value we have observed is 385KB per volume per day. That study also predicted that 99.5% of all resolution logs would grow less than 240KB per day. This is completely consistent with the results in Figure 3 which indicate
kilobytes 50 100 150 200 250 300 350 400
percent of volume samples
0.100 1.000 10.000 100.000 0.010 0 Samples in Graph = 61,113 Average High-Water Mark = 19.0 KB
This graph shows the distribution of the maximum resolution log size reached each day by each volume. The high-water mark is reset each morning to the current log size.
Note that theyaxis is log
10scaled.
Figure 3: Daily High-Water Marks of Resolution Log Sizes
that over 99% of all operation logs grow less than 240KB per day.
4.3
Disconnected Operation
Mutations made during disconnected operation at a Coda client are recorded in a per-volume replay log. Coda employs many cancella-tion optimizacancella-tions[8] to reduce the amount of log space used. Upon reconnection, the client transparently invokes reintegration of each modified volume. If a volume’s log is successfully replayed by the servers, they proceed to backfetch the contents of modified files. If replay fails, the log and associated files are saved in a closure, for the user to inspect and replay manually.
In this section, we ask how large replay logs become, and how effective the optimizations are in reducing log growth. We also examine the outcomes of reintegrations and their latency.
4.3.1 Size of Replay Logs
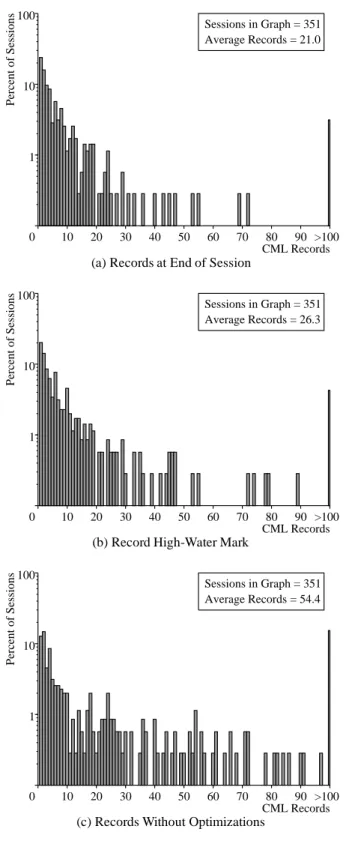
Figure 4(a) shows the observed replay log sizes at the end of the corresponding disconnected sessions. The distribution is skewed toward the low end, and has a mean of 21 records. This reflects a much greater use of the system than observed in the first half of this study where the mean was just over half that; in other words, more data is mutated while disconnected. The distribution has a long tail, with a maximum value of 1,466 records.
The high-water mark of a replay log’s length could be different from its final length because of explicit deletion of objects created during that session. Such a deletion eliminates all earlier log records
10 20 30 40 50 60 70 80 90 >100 CML Records Percent of Sessions 1 10 100 0 Sessions in Graph = 351 Average Records = 21.0
(a) Records at End of Session
10 20 30 40 50 60 70 80 90 >100 CML Records Percent of Sessions 1 10 100 0 Sessions in Graph = 351 Average Records = 26.3
(b) Record High-Water Mark
10 20 30 40 50 60 70 80 90 >100 CML Records Percent of Sessions 1 10 100 0 Sessions in Graph = 351 Average Records = 54.4
(c) Records Without Optimizations
These graphs show the distribution of replay log sizes under various situations. Fig-ure 4(a) shows log sizes at the ends of disconnected sessions. FigFig-ure 4(b) shows the distribution of log high-water marks. Figure 4(c) shows what log sizes would be without optimizations.
Figure 4: Replay Log Lengths
Attempts 461
Successes 400
Log Records Committed 6,666 New Files Created 1,290 MB Backfetched 176
Failures 61
Confirmed Server Disappearances 14 Log Records Saved in Closures 89
This table shows the breakdown of reintegration results, as well as details of successful and failed reintegration. For successful reintegrations we show the total number of log records committed, how many of those log records were creations, and how much data was backfetched by the servers. For failures, we give the number of log records that were saved in closures. We also give the number of failed reintegrations that are known to be due to server or network failure rather than for se mantic reasons. There is one anomalous case not included in these figures; it is explained in Section 4.3.2.
Table 5: Reintegrations
for the object. Figure 4(b) shows the distribution of observed high-water marks. As expected, this distribution is shifted to the right of Figure 4(a), with a mean of 26.3 records.
Log optimizations prove to be very effective. Figure 4(c) shows the distribution of lengths that the logs would have reached had opti-mizations not been applied. This distribution is substantially shifted to the right of Figure 4(a). On average, replay logs without optimiza-tions would have been over 2.5 times longer than the logs actually encountered in Coda. This corroborates earlier estimates, based on trace-driven simulation, that indicated that unoptimized logs would be between 2 and 3 times the length of optimized logs[19]. This result is also consistent with anecdotal evidence from our users, who claim to often work disconnected on a small set of files, but overwrite them frequently.
4.3.2 Reintegration
Table 5 shows a summary of the reintegration attempts in data volumes we have seen so far; we do not include numbers from test volumes. Over 85% of all reintegration attempts succeeded. On average, each successful reintegration involved replay of just over 16 records and backfetching of about 450KB of data. Since most of these reintegrations were to triply-replicated data, the effective amount of new data created during a disconnected session is at least 150KB.
The high number of failed reintegrations was initially surprising to us, because it contradicted anecdotal evidence that users rarely experience reintegration failure. From our raw data we are a ble to confirm that almost one quarter (14 out of 61) of the reintegration failures are due to a server disappearing during reintegration. Some of the remaining 47 failures may also be attributable to this cause, but we are unable to confirm this. However, even if all 47 failures were due to conflicting updates, we conjecture that many would be due to multi-machine activity by the same user. As a result, the high
20 40 60 80 100 120 140 160 Seconds
Percent of Successful Reintegrations
1 10 100
0
Reintagrations Measured = 321 Average Latency = 17.6 secs
This graph shows the distribution of latencies measured at the client for successful reintegrations. As discussed in 4.3, this latency includes the time for replay at all AVSG members as well as the backfetching of file contents by them. There is one outlier not pictured here, as detailed in Section 4.3.2.
Figure 5: Reintegration Latency Distribution
rate of reintegration conflicts would not prima facie contradict our earlier predictions of much lower likelihood of conflicts between different users[9].
One anomalous event is not included in the above analysis. A user who was unfamiliar with the write-sharing semantics of Coda ran simulations on five machines which logged information to a single Coda file. He was unaware that, unlike traditional Unix, Coda detects concurrent write-sharing and preserves the first and all later updates. This preservation is done by treating the later updates as failed reintegrations, and saving the data in closures. In this case, the simulations ignored failed reintegrations and pushed on blindly, causing 188 failed reintegrations over the course of one evening!
Figure 5 shows the distribution of observed reintegration laten-cies. The vast majority of reintegrations had latencies of ten seconds or less, though there are some outliers beyond 90 seconds. There was also one outlier at just over seven minutes; this data point was elided from the graph for readability, but is reflected in the mean. We conjecture that the outlier was due to repeated transient network failure. The low overall latencies corroborate our users’ experience that most reintegrations are barely noticeable, contributing to the transparency of disconnected operation.
4.4
User Behavior While Disconnected
In this section, we ask how users take advantage of voluntary discon-nected operation. We address this question in three ways. First, we examine the CPU consumption on disconnectedportable computers. Second, we look at mutation activity during voluntary
disconnec-Length of Session - Hours 10 20 30 40 50 60
CPU Minutes Consumed
50 100 150 200 250 300 350 0
Average CPU Utilization = 10.3% Baseline CPU Utilization = 5.0% Points in Graph = 1,990
This graph shows the laptop CPU consumptionfor disconnected sessions, a per-volume concept as discussed in Section 4.1.2. The dotted line represents the average number of minutes consumed per hour, deterimined by dividing total CPU usage by total elapsed time. The solid line represents the observed CPU consumption of an idle laptop which caches this paper, the data collection source code, and the X11, GNU Emacs, and TEXsoftware collections: a typical cache set in our environment.
Figure 6: CPU Usage During Laptop Disconnections
tions. Finally, we compare the VFS operation mix during connected sessions and voluntary disconnected sections.
Our data collection has no way of accurately recording whether a disconnection is voluntary or involuntary. Rather, this distinction has to be inferred. We have strong anecdotal evidence indicating that almost all voluntary disconnections occur on portable machines. Further, network partitions tend to last well under an hour, and simultaneous failure of all servers is rare. Therefore, we classify those disconnected sessions on portable computers lasting longer than one hour as voluntary.
4.4.1 Total CPU Usage
Figure 6 depicts total CPU consumption as a function of the duration of disconnection. Some of this CPU activity is generated by Venus in the process of cache management; on an otherwise idle machine, Venus’ CPU usage increases with the number of files cached. To estimate this inherent overhead, we measured the CPU consumption of an idle laptop with a typical complement of cached files. The observed utilization of 5.0% is shown by the solid line in Figure 6. The dotted line in Figure 6 corresponds to the average observed CPU consumption, and corresponds to a utilization of 10.3%. This is sufficiently higher than the baseline amount of 5.0% to confirm that users do indeed work during voluntary disconnections — they don’t just take their laptops home and leave them idle!
10 20 30 40 50 60 70 80 90 100 CML Records
Percent of Sessions Longer than One Hour
1 10 100 0 Sessions in Graph = 108 Average Records = 8.8
This graph shows the distribution of replay log sizes for all disconnected sessions on portable computers lasting one hour or longer.
Figure 7: Replay Log Lengths at End of Voluntary Disconnections
4.4.2 Mutation Activity
Figure 7 shows the distribution of replay log sizes for voluntary disconnected sessions. Earlier, we presented Figure 4(a), which showed the corresponding distribution for both voluntary and in-voluntary disconnected sessions. The average number of records in the two figures is quite different: 8.8 records while voluntarily disconnected versus 21 records in all disconnected sessions. The distributions are also quite different; the tail of Figure 7 is much shorter, indicating that user mutations span a narrower range of files during voluntary disconnections. An alternative way to in-terpret this data is that users restrict their mutation behavior when voluntarily disconnected.
4.4.3 Operation Mixes
Anecdotal evidence suggests that during voluntary disconnections, our users typically perform interactive tasks rather than compute-intensive tasks. We were curious to see if our data confirmed this.
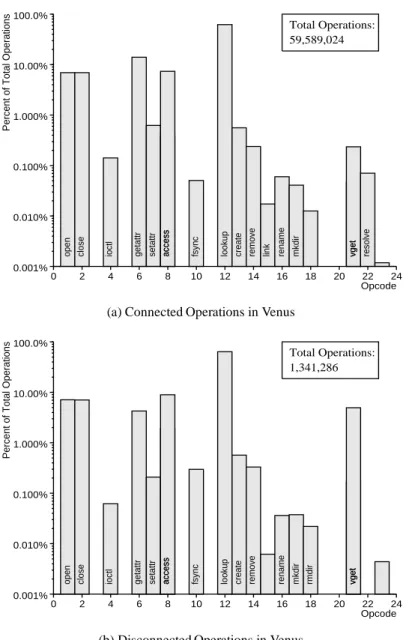
In our data collection, the best indicator we have of usage patterns is the mix of VFS operations observed during a session. Figure 8 compares the observed frequency of VFS operations dur-ing connected and disconnected sessions. The two operations with significant differences,vgetandresolve, are generated entirely within Venus and are independent of user activity. All other op-erations appear about as frequently in connected and disconnected sessions. Thus, the posited difference in user behavior is not re-flected at this level. We conjecture that instrumentation at a higher level of abstraction than VFS operations will reveal the difference.
5
Conclusion
This study set out to examine the value, effectiveness and impact of the high availability aspects of Coda in day-to-day use. Our study spanned a period of 6 months, and involved serious use by a com-puter science research community of modest size. During this pe-riod, we found that Coda clients do experience various kinds of ser-vice failures, but that Coda is able to mask these failures effectively. Our empirical observations confirm many earlier simulation-based predictions on resource usage. They also confirm much anecdotal evidence from our user community.
At the same time, our study has also produced some surprises and suggested avenues of further inquiry. For example, we did not anticipate the large number of transient sessions. We were also surprised by the substantial number of reintegration failures due to self-conflict. Another surprise is the tendency of users to limit muta-tion activity while voluntarily disconnected. A disappointing aspect of our results is their inability to corroborate the strong anecdotal evidence from users that they perform substantially different tasks when voluntarily disconnected. These suggest further evaluation of how mobility effects user behavior, and how Coda’s support of mobile computing helps or hinders this behavior.
Coda is being enhanced along many different dimensions. It will soon support the ability to use low-bandwidth communication links. It will also offer improvements to resolution, reintegration, and cache management. More powerful, lighter-weight portable Coda laptops will soon be available to our user community. Finally, our user community continues to grow in size and diversity.
It is difficult to predict what the cumulative effect of these changes will be. The data collection mechanism described here is an integral part of our system, and its impact on users is negligible. We therefore plan to continue our data collection, and to periodically revisit and evolve the analysis presented in this paper.
Acknowledgements
We wish to thank Jay Kistler, who provided the initial framework for data collection and much of our understanding of the client, and Masashi Kudo, who implemented portions of the data collection code. Past and present members of the Coda group, especially Maria Ebling, Puneet Kumar, Qi Lu, Lily Mummert, and David Steere, deserve thanks for their aid in un-derstanding what exactly was happening when our numbers did not match our intuition. We also wish to thank the referees as well as Sharon Beck, Tom Martin and Thomas Ragland for their helpful comments. Most impor-tantly, we would like to thank our many users for trusting our system and being patient with “the very last revision of the data collection software, we promise!”
Opcode
2 4 6 8 10 12 14 16 18 20 22 24
Percent of Total Operations
0.010% 0.100% 1.000% 10.00% 100.0% 0.001% 0 Total Operations: 59,589,024
open close ioctl getattr setattr accessaccess fsync lookup create remove link rename mkdir vgetvget resolve
(a) Connected Operations in Venus
Opcode
2 4 6 8 10 12 14 16 18 20 22 24
Percent of Total Operations
0.010% 0.100% 1.000% 10.00% 100.0% 0.001% 0 Total Operations: 1,341,286
open close ioctl getattr setattr accessaccess fsync lookup create remove rename mkdir rmdir vgetvget
(b) Disconnected Operations in Venus
This figure contrasts the operation mixes in connected and disconnected sessions. Figure 8(a) shows operations in connected sessions, and Figure 8(b) shows operations
in disconnected ones. Theyaxis is log10scaled in both figures, and any operation with a frequency below 0.001% does not appear on this graph.
The operations and corresponding opcodes in this table are: open (1), close (2), rdwr (3), ioctl (4), select (5), getattr (6), setattr (7), access (8), readlink (9), fsync (10), inactive (11), lookup (12), create (13), remove (14), link (15), rename (16), mkdir (17), rmdir (18), symlink (19), readdir (20), vget (21), resolve (22), and reintegrate (23).
References
[1] BAKER, M. G., HARTMAN, J. H., KUPFER, M. D., SHIRRIFF, K. W.,ANDOUSTER
-HOUT, J. K. Measurements of a Distributed File System. In Proceedings of the
Thirteenth ACM Symposium on Operating System Principles (Pacific Grove, CA, October 1991).
[2] BHIDE, A., ELNOZAHY, E. N.,ANDMORGAN, S. P. A Highly Available Network
File Server. In Winter Usenix Conference Proceedings (Dallas, TX, January 1991).
[3] COVA, L. Resource Management in Federated Computing Environments. PhD
thesis, Department of Computer Science, Princeton University, October 1990.
[4] FLOYD, R. Directory Reference Patterns in a Unix Environment. Tech. Rep.
TR-179, Department of Computer Science, University of Rochester, 1986.
[5] FLOYD, R. Short-Term File Reference Patterns in a Unix Environment. Tech.
Rep. TR-177, Department of Computer Science, University of Rochester, 1986.
[6] HISGEN, A., BIRRELL, A., MANN, T., SCHROEDER, M.,ANDSWART, G.
Availabil-ity and Consistency Tradeoffs in the Echo Distributed File System. In Proceedings of the Second Workshop on Workstation Operating Systems (Pacific Grove, CA, September 1989).
[7] HOWARD, J. H., KAZAR, M. L., MENEES, S. G., NICHOLS, D. A., SATYA
-NARAYANAN, M., SIDEBOTHAM, R. N.,ANDWEST, M. J. Scale and Performance in a Distributed File System. ACM Transactions on Computer Systems 6, 1 (February 1988).
[8] KISTLER, J. J. Disconnected Operation in a Distributed File System. PhD thesis,
Carnegie Mellon University, School of Computer Science, 1993.
[9] KISTLER, J. J.,ANDSATYANARAYANAN, M. Disconnected Operation in the Coda
File System. ACM Transactions on Computer Systems 10, 1 (February 1992).
[10] KLEIMAN, S. R. Vnodes: An Architecture for Multiple File System Types in Sun
UNIX. In Summer Usenix Conference Proceedings (Atlanta, GA, 1986).
[11] KUMAR, P.,ANDSATYANARAYANAN, M. Log-Based Directory Resolution in the
Coda File System. In Proceedings of the Second International Conference on Parallel and Distributed Information Systems (San Diego, CA, January 1993).
[12] NELSON, M. N., WELCH, B. B.,ANDOUSTERHOUT, J. K. Caching in the Sprite
Network File System. ACM Transactions on Computer Systems 6, 1 (February 1988).
[13] OUSTERHOUT, J. K., DACOSTA, H., HARRISON, D., KUNZE, J. A., KUPFER, M.,
ANDTHOMPSON, J. G. A Trace-Driven Analysis of the UNIX 4.2 BSD File System. In Proceedings of the 10th ACM Symposium on Operating System Principles (Orcas Island, WA, December 1985).
[14] POPEK, G. J., GUY, R. G., PAGE, T. W.,ANDHEIDEMANN, J. S. Replication in
Ficus Distributed File Systems. In Proceedings of the Workshop on Management of Replicated Data (Houston, TX, November 1990).
[15] SATYANARAYANAN, M. A Study of File Sizes and Functional Lifetimes. In
Proceedings of the 8th ACM Symposium on Operating System Principles (Pacific Grove, CA, December 1981).
[16] SATYANARAYANAN, M. A Synthetic Driver for File System Simulations. In
Proceedings of the International Conference on Modelling Techniques and Tools for Performance Analysis (Paris, May 1984).
[17] SATYANARAYANAN, M. Scalable, Secure, and Highly Available Distributed File
Access. IEEE Computer 23, 5 (May 1990).
[18] SATYANARAYANAN, M., KISTLER, J. J., KUMAR, P., OKASAKI, M. E., SIEGEL,
E. H.,ANDSTEERE, D. C. Coda: A Highly Available File System for a Distributed
Workstation Environment. IEEE Transactions on Computers 39, 4 (April 1990).
[19] SATYANARAYANAN, M., KISTLER, J. J., MUMMERT, L. B., EBLING, M. R., KUMAR,
P.,ANDLU, Q. Experience with Disconnected Operation in a Mobile Computing
Environment. In Proceedings of the 1993 USENIX Symposium on Mobile and Location-IndependentComputing (Cambridge, MA, August 1993).
[20] SATYANARAYANAN, M., MASHBURN, H. H., KUMAR, P., STEERE, D. C.,AND
KISTLER, J. J. Lightweight Recoverable Virtual Memory. In Proceedings of the Fourteenth ACM Symposium on Operating Systems Principles (Asheville, NC, December 1993).
[21] SIDEBOTHAM, R. Volumes: The Andrew File System Data Structuring Primitive.
In European Unix User Group Conference Proceedings (August 1986). Also available as Tech. Rep. CMU-ITC-053, Carnegie Mellon University, Information Technology Center.
[22] SIEGEL, A., BIRMAN, K.,ANDMARZULLO, K. Deceit: A Flexible Distributed
File System. Tech. Rep. TR 89-1042, Department of Computer Science, Cornell University, 1989.
[23] SMITH, A. J. Analysis of Long Term File Reference Patterns for Application
to File Migration Algorithms. IEEE Transactions on Software Engineering 7, 4 (July 1981).
[24] SPASOJEVIC, M.,ANDSATYANARAYANAN, M. A Usage Profile and Evaluation of
a Wide-Area Distributed File System. In Winter Usenix Conference Proceedings (San Francisco, CA, January 1994).
[25] STEERE, D. C., KISTLER, J. J.,ANDSATYANARAYANAN, M. Efficient
User-Level File Cache Management on the Sun Vnode Interface. In Summer Usenix Conference Proceedings (Anaheim, CA, June 1990).