Strat. Mgmt. J.,31: 306–333 (2010) Published online EarlyView in Wiley InterScience (www.interscience.wiley.com) DOI: 10.1002/smj.821 Received 6 May 2008;Final revision received 12 October 2009
VALUE CREATION IN INNOVATION ECOSYSTEMS:
HOW THE STRUCTURE OF TECHNOLOGICAL
INTERDEPENDENCE AFFECTS FIRM PERFORMANCE
IN NEW TECHNOLOGY GENERATIONS
RON ADNER1* and RAHUL KAPOOR2
1Tuck School of Business, Dartmouth College, Hanover, New Hampshire, U.S.A. 2The Wharton School, University of Pennsylvania, Philadelphia, Pennsylvania, U.S.A.
The success of an innovating firm often depends on the efforts of other innovators in its environ-ment. How do the challenges faced by external innovators affect the focal firm’s outcomes? To address this question we first characterize the external environment according to the structure of interdependence. We follow the flow of inputs and outputs in the ecosystem to distinguish between upstream components that are bundled by the focal firm, and downstream complements that are bundled by the firm’s customers. We hypothesize that the effects of external innovation challenges depend not only on their magnitude, but also on their location in the ecosystem relative to the focal firm. We identify a key asymmetry that results from the location of challenges relative to a focal firm—greater upstream innovation challenges in components enhance the benefits that accrue to technology leaders, while greater downstream innovation challenges in complements erode these benefits. We further propose that the effectiveness of vertical integration as a strat-egy to manage ecosystem interdependence increases over the course of the technology life cycle. We explore these arguments in the context of the global semiconductor lithography equipment industry from its emergence in 1962 to 2005 across nine distinct technology generations. We find strong empirical support for our framework.Copyright2009 John Wiley & Sons, Ltd.
INTRODUCTION
A firm’s competitive advantage depends on its ability to create more value than its rivals (Porter, 1985; Brandenburger and Stuart, 1996). Greater value creation, in turn, depends on the firms’ ability to innovate successfully. To capture the returns from innovation, many firms strive to be technology leaders in their industry by being first to introduce new innovations to the market. A given innovation, however, often does not stand alone; rather, it depends on accompanying changes
Keywords: technological change; first mover advantage; business ecosystem; vertical integration; complements; semiconductor lithography
*Correspondence to: Ron Adner, Tuck School of Business, Dart-mouth College, Strategy and Management, 100 Tuck Hall, Hanover, NH 03755, U.S.A. E-mail: [email protected]
in the firm’s environment for its own success. These external changes, which require innovation on the part of other actors, embed the focal firm within an ecosystem of interdependent innovations (Adner, 2006).
Consider, for example, Airbus’s monumental investment in pioneering the super-jumbo passen-ger aircraft with its A380 offer. Airbus, as the focal firm, faces substantial challenges in designing and manufacturing the core airframe of the airplane. Beyond this internal challenge, it also relies on a host of suppliers for subassemblies and com-ponents. Some of these suppliers are themselves confronted with significant innovation challenges to deliver components that meet Airbus’s require-ments (e.g., engine, navigation system), while oth-ers will not need to innovate at all (e.g., carpet-ing). Receiving these various components, Airbus
faces the additional challenge of integrating these components with the airframe in order to deliver a functioning aircraft to its airline customers. In order for the aircraft to be used productively by airlines, however, a number of other actors in the environment, outside of Airbus’s direct supply chain, confront additional innovation challenges as well. Complementors such as airports need to invest and develop new infrastructure to accommo-date the oversized aircraft, regulators need to spec-ify new safety procedures, and training simulator manufacturers need to develop new simulators on which aircraft crews can be trained. The A380 innovation ecosystem thus comprises not only Air-bus as the core innovator, but also its upstream suppliers, and its downstream buyers and comple-mentors. The key point is that it is not enough to consider whether and how Airbus will success-fully resolve its internal innovation challenges; in order for the A380 offer to create value, all of the other ecosystem partners need to resolve their own innovation challenges as well.
Understanding firm performance in such ‘inno-vation ecosystems’ requires a change in the way in which the strategy and the innovation litera-tures have traditionally linked industry dynamics to firm performance. Most obviously, it requires an approach that is explicit not only about the inno-vation challenges that are faced by the focal firm (Cooper and Schendel, 1976; Tushman and Ander-son, 1986; Henderson and Clark, 1990; Chris-tensen, 1997), but one that is also explicit about the nature of innovation challenges confronted by the external partners. In addition, it requires an approach that extends beyond the focus on how different actors will bargain over value capture (Porter, 1980; Teece, 1986; Brandenburger and Stuart, 1996; Brandenburger and Nalebuff, 1997) to include an explicit consideration of the innova-tion challenges that different actors will need to overcome in order for value to be created in the first place.
The current paper presents an approach to ana-lyzing the dynamics of value creation that focuses on the role of innovation challenges in a firm’s ecosystem as potential bottlenecks to value cre-ation. We show that no less important than the
magnitude of innovation challenges in the
ecosys-tem is thelocationof these challenges. We present
a simple structure for locating challenges relative to the focal firm according to the flow of activi-ties within the ecosystem and draw key distinctions
between challenges that need to be confronted by the focal firm, its upstream suppliers, and its down-stream complementors.
Specifically, the current paper identifies asym-metries that arise from the positions of different counterparties relative to the focal firm. We show that a firm’s ability to create value is impacted in very different ways depending on whether it is its upstream or downstream partners that face innovation challenges The impact of high external innovation challenges on the focal firm depends on whether the challenges are confronted by suppliers, which affects the components that the firm needs to integrate in order to offer a complete product to its customers, or by complementors, in which case the firm can offer its complete product to the customer, but the customer cannot utilize it to its full poten-tial. We link these asymmetries in value creation to their impact on value capture and competitive advantage. To our knowledge this is the first paper in the management literature to explicitly postulate or test the asymmetric effects of components and complements.
We use this ecosystem lens to consider two inter-related questions. First, how the structure of tech-nological interdependence—the location of chal-lenges relative to the focal firm —affects the ben-efit that accrues to technology leaders (i.e., firms that pioneer the introduction of new technology generations). Second, how the effectiveness of ver-tical integration as a strategy for managing tech-nological interdependence changes over the course of a technology’s life cycle.
The first mover advantage literature has iden-tified important considerations under which tech-nology leaders gain or lose from early entry into new markets. Both the applied and scholarly lit-eratures are replete with studies, prescriptions, and caveats regarding the merits of pioneering opportunities (Lieberman and Montgomery, 1988; Mitchell, 1991; Golder and Tellis, 1993; Chris-tensen, Su´arez, and Utterback, 1998). Consistent with strong arguments for and against the benefits of leading in the introduction of new innovations, the empirical findings have been decidedly mixed, with some studies reporting significant pioneer-ing advantages while others report disadvantages and non-effects (Kerin, Varadarajan, and Peter-son,1992; VanderWerf and Mahon, 1997).
The debates over the advantage accorded to technology leaders have tended to overlook the
nature of the technology challenges that lead-ers and their ecosystems must overcome. In so doing, they have neglected a key contingency. The current paper moves beyond the literature’s traditional analysis of firms’ positions relative to their rivals. We explicitly consider the innovation challenges that reside in the firm’s environment and need to be confronted by external partners if the focal innovation is to succeed in the market. We develop a simple framework for characteriz-ing the technological uncertainty associated with external innovation challenges. We argue that the location of challenges impacts the steepness of firms’ learning curves, their rate of progress along these curves, and the extent of spillovers to rivals. We predict that challenges in components increase the performance advantage attributable to tech-nology leaders, while challenges in complements
decrease this advantage.1 In so doing, we reveal
how the structure and sequence of value creation affects the outcomes of competition for value cap-ture.
We then consider firms’ vertical integration of key components as a strategy to manage this interdependence. We integrate arguments from the research literatures on technology life cycles (Rosenberg, 1976; Sahal, 1981; Dosi, 1982) and transaction cost economics (Williamson, 1985), and suggest that while technological challenges tend to decrease as technologies mature, con-tractual challenges need not dissipate over time. Because vertical integration mitigates contractual hazards but not necessarily technological chal-lenges, we posit that the shifting balance of tech-nological and contractual uncertainty will act to increase the benefit from vertical integration over the course of the technology life cycle. Hence, ver-tical integration is likely to be more effective after a technology has reached a stage of maturity, rather than during its emergence.
We test these arguments in the context of the global semiconductor lithography equipment industry from its emergence in 1962 to 2005, a period during which the industry transitioned through nine distinct technology generations. While focal innovators faced significant challenges in each of these generational transitions, the extent
1Note that our focus isnot in specifying whether technology leaders will have a competitive advantage. Rather, our focus is on specifying whether competitive advantage from technology leadership is enhanced or eroded by the magnitude and location of external innovation challenges.
to which suppliers and complementors faced inno-vation challenges varied across these generations, providing us with an ideal setting in which to test the impact of ecosystem challenges on technology leaders. We construct a unique dataset to test our arguments. The data include a novel measure of ecosystem challenges for each of the nine tech-nology generations, as well as information about every firm that ever sold lithography equipment for mainstream applications in the semiconductor industry.
Our study makes a number of contributions. First, it introduces a structured approach for ana-lyzing technology interdependence. This approach offers a new perspective for understanding inno-vators’ outcomes during periods of technological change by focusing not only on the internal chal-lenges faced by the focal firms (Tushman and Anderson, 1986; Henderson and Clark, 1990) but also on the external challenges faced by partners in the ecosystem. By using an ecosystem lens to examine the benefits of technology leadership, we expand the scope of inquiry beyond its tradi-tional focus on direct competitors to identify the underpinning mechanisms by which uncertainty in components and complements exercise opposing effects on the performance of technology leaders and laggards (Lieberman and Montgomery, 1998). By disaggregating the external environment into upstream and downstream constituents, we show that the location of challenges matters no less than their magnitude, and offer a finer-grained view of the interaction between organizations and their environments (Dess and Beard, 1984) and its implication for the dynamics of value creation (Brandenburger and Stuart, 1996; Adner and Zem-sky, 2006). By linking the flow of activities among exchange partners to the distribution of innova-tion challenges across the ecosystem, we shed light on a key mechanism of joint value creation and contribute to the emerging research literature on ecosystem strategy (Moore, 1996; Iansiti and Levien, 2004; Adner, 2006). To the best of our knowledge, the current study is the first to opera-tionalize the environment in this way. Finally, by explicitly considering the changing benefits of ver-tical integration over the course of the technology life cycle we contribute toward an understand-ing of how firms’ boundary choices affect their performance outcomes over time (Stigler, 1951; Argyres and Bigelow, 2007; Novak and Stern, 2008).
AN ECOSYSTEM PERSPECTIVE
The ecosystem construct, as a way of making interdependencies more explicit, has gained promi-nence in both business strategy (Moore, 1996; Ian-siti and Levien, 2004; Adner, 2006) and practice (e.g., Intel Corporation, 2004; SAP Corporation, 2006). These approaches have focused on under-standing coordination among partners in exchange networks that are characterized by simultaneous cooperation and competition (Brandenburger and Nalebuff, 1997; Afuah, 2000). Studies in this vein explore the challenges that arise when incentives across the ecosystem are not aligned (Casadesus-Masanell and Yoffie, 2007), the role of estab-lished relationships with ecosystem partners in shaping firms’ motivations to compete for different market segments (Christensen and Rosenbloom, 1995), and the activities that focal firms undertake to induce exchange partners to favor their spe-cific technology platforms (Gawer and Cusumano, 2002).
Notice, however, that these studies are primarily concerned with strategic interactions among firms, extending the focus on value capture from the context of bilateral partnerships (Teece, 1986) and industries (Porter, 1980) to the context of ecosys-tems (Jacobides, Knudsen, and Augier, 2006; Pisano and Teece, 2007). Thus, while the strategy literature has explored the role of co-specialization, bargaining power, and relationships between exchange partners in shaping firms’ value capture, it has tended to assume away the question of how value is created in the first place.
Notice too, that while these research studies are clearly sensitive to the presence of different roles and actors along the value chain (i.e., drawing clear distinctions between suppliers, complemen-tors, and buyers), the specific value chain position of a counterparty relative to the focal firm has had no impact on the resulting analysis;—that is, the impact of an exchange partner with high bargain-ing power on the focal firm’s ability to capture value is exactly the same regardless of whether the counter party is positioned as a complementor, a buyer, or a supplier.
Indeed, although the very imagery of a value chain (at the level of both firms and indus-tries) suggests interdependencies characterized as an ordered arrangement of activities, the literature has largely neglected the impact of the relative locations of activities along the chain. This has left
the field in the odd position of highlighting the importance of complements, complementors, and complementary assets, (e.g., Teece, 1986; Milgrom and Roberts, 1990), claiming qualitatively distinct status for the role of complementors and suppli-ers, but unable to use its definition of these
con-structs2 to distinguish between complements (e.g.,
software for hardware) and components (e.g., pro-cessors for computers) because improvements in either increase the attractiveness of the focal offer. We depart from this literature by explicitly link-ing the dynamics of value creation and their impli-cations for value capture to the structure of inter-dependence in a firm’s ecosystem. The perspective that we propose and test in this study exploits the relative location of activities within the ecosys-tem to distinguish among the different roles played by various actors in the firm’s environment. We identify roles according to the location in which activities are bundled in the ecosystem by follow-ing the flow of inputs and outputs of firms, and use this as the basic framework for our analysis.
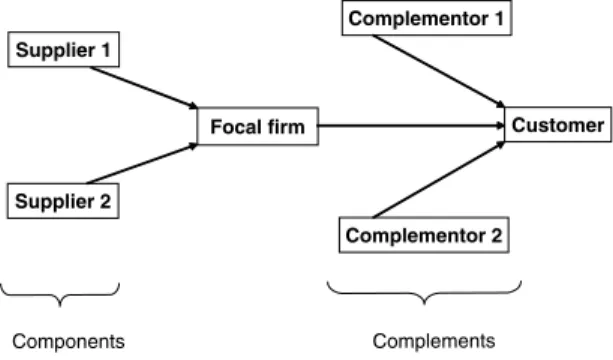
Figure 1 shows the schema of our approach. The outputs of upstream suppliers serve as inputs to the focal actor. We refer to such inputs, which are bundled by the focal actor into its product, as components. The focal actor’s product serves as an input to its customer. A customer may also need to bundle other offers alongside the focal actor’s product in order to utilize it. We refer to such offers, which are bundled downstream by the customer, as complements. Thus, components and complements are defined according to where ele-ments are bundled in the flow of activities relative
Supplier 2
Complementor 1 Supplier 1
Complementor 2
Focal firm Customer
Components Complements
Figure 1. Generic schema of an ecosystem 2For example, ‘The defining characteristic of these groups of complements is that if the levels of any subset of the activities are increased, then the marginal return to increases in any or all of the remaining activities rises’ (Milgrom and Roberts, 1990: 514).
to the position of the focal product, not accord-ing to whether they are produced by a given firm or outsourced to another. For example, although Hewlett Packard produces both personal comput-ers and printcomput-ers, they remain separate offcomput-ers that are brought together by the customer: the printer is a complement to the computer independently of whether it is offered by Hewlett Packard or Cannon. In the figure, as in our study, we exam-ine only first-tier components and complements; clearly, this structure can be extended forward and backward along the activity chain to include higher-tiered actors (e.g., suppliers’ suppliers; cus-tomers’ customers). In the following section, we apply this approach in the context of innova-tions.
Innovation and the structure of interdependence
The majority of studies in the innovation liter-ature have sought to characterize the magnitude and nature of the internal innovation challenges
confronted by focal innovators.3 The magnitude of
innovation challenges can be characterized by the extent to which they require changes to the cur-rent approach to problem solving. The nature of a challenge can be rooted in discovery, design, and development (Tushman and Anderson, 1986; Hen-derson and Clark, 1990); in integrating external components into firms’ internal designs (Takeishi, 2002; Brusoni, Prencipe, and Pavitt, 2001); or in scaling up the production and delivery of the iden-tified solution (Argote, 1999; Hatch and Mowery, 1998).
The success of an individual innovation, how-ever, is often dependent on the success of other innovations in the firm’s external environment. Hughes’s (1983) rich description of the emergence of the electrical power network highlights the obstacles raised when some technological elements of an ecosystem lag behind others in resolving their challenges. He attributes the decline of direct cur-rent (DC) generation technologies to bottlenecks
3Exceptions are Afuah’s studies (Afuah and Bahram, 1995; Afuah, 2000), which have explored how firm performance is impacted when partners face technology challenges. These stud-ies focus on the overall level of innovation challenges that part-ners must confront. In contrast, our study explicitly considers the impact of variations in both the level and the location of chal-lenges within the ecosystem. In so doing, we are able to uncover new insights regarding the asymmetric impact of upstream and downstream uncertainty on innovators’ outcomes.
in the development of distribution technology for the DC network. Conversely, Henderson’s (1995) study of the semiconductor lithography industry (the same industry we examine in this paper) high-lights the role that suppliers, customers, and com-plementors played in offsetting bottlenecks in opti-cal lithography technology, thereby extending the dominance of optical lithography over nonoptical approaches. However, while the existence of exter-nal innovation dependencies in such systems of innovation has been well documented in the liter-ature, it has been undertheorized.
The existence of bottlenecks in an ecosystem is evidence that challenges are distributed unevenly across ecosystem roles. While challenges in any location within the ecosystem will constrain the focal firm’s ability to create value with its prod-uct, challenges located in different positions con-strain its value creation and value capture in qualitatively different ways. Specifically, whereas upstream component challenges limit value cre-ation by constraining the focal firm’s ability to produce its product, downstream complement chal-lenges limit value creation by constraining the customer’s ability to derive full benefit from con-suming the focal firm’s product.
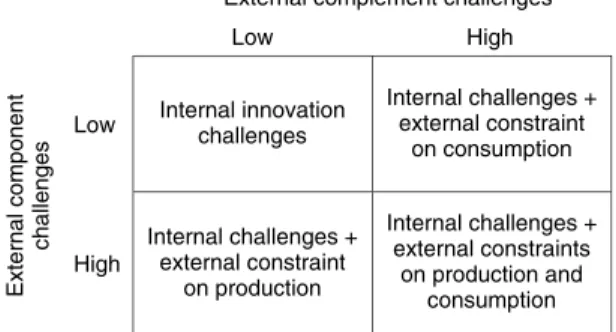
Figure 2 illustrates these distinctions. In the upper left hand quadrant, external component chal-lenges and complement chalchal-lenges are low, and the primary constraint on the focal firm is managing its own internal innovation challenges. An exam-ple might be DuPont developing a new plastic. The innovation literature has largely focused on the management of challenges in this quadrant. These internal challenges are an issue in all quadrants in Figure 2. In the other three quadrants, however, in addition to these internal challenges, external chal-lenges also need to be overcome. In the upper right
External complement challenges Low
Low Internal innovationchallenges
Internal challenges + external constraint on consumption External component challenges High Internal challenges + external constraint on production Internal challenges + external constraints on production and consumption High
Figure 2. A framework for understanding the effect of ecosystem challenges on innovators
hand quadrant, upstream component challenges are high, and the focal firm faces an additional barrier to production rooted in the ability of its suppliers to overcome their own innovation challenges. For example, each new generation of hard disk drives has presented drive manufacturers with significant internal design challenges, but has also required significant innovation on the part of suppliers of components such as read-write heads, motors, and disk substrate materials. In the lower left hand quadrant, downstream complement challenges are high, and the focal firm’s buyers are constrained in their ability to benefit from the firm’s inno-vation, despite the firm’s ability to overcome its own challenges. For example, although hardware platforms for electronic book readers have been available since the 1990s, the decade-long absence of compelling electronic book content hindered the ability of hardware providers to create value with their innovation.
Note that the upper right hand quadrant and the lower left hand quadrant both have high challenge on one external dimension and low challenge on the other. An analysis that examined only the mag-nitude of external innovation challenges, ignoring their location relative to the focal firm, would be blind to the asymmetric effects of upstream and downstream interdependence. Therefore, such an analysis would incorrectly characterize these quad-rants as equivalent.
In the lower right hand quadrant, component and complement challenges are both high. An example is zero emission vehicles, which require signifi-cant innovation not only in car design, but also in the engine component and in the complement of the fuel delivery infrastructure. Nominally, this quadrant represents the highest state of environ-mental uncertainty. However, the effect of the simultaneous presence of high component and high complement challenges will likely depend on the specific order of uncertainty resolution—whether the characterization of ecosystem challenges will shift from the lower right hand quadrant to the upper right hand quadrant, or from the lower right hand quadrant to the lower left hand quadrant. The sequence will depend on the specific nature of challenges in the ecosystem.
We now consider how differences in the con-straints on value creation due to the location of challenges in the ecosystem impact firms’ compet-itive advantage.
TECHNOLOGICAL
INTERDEPENDENCE AND INNOVATORS’ PERFORMANCE
How do the magnitude and location of technolog-ical challenges in the ecosystem affect the benefits of technology leadership? Being first to introduce an improved technology to the market is a common managerial aspiration. Successful technology lead-ers, by virtue of having beaten their rivals to mar-ket, enjoy reduced competition when presenting their offer to customers. Whether this temporary exclusivity translates into a sustained competitive advantage over later entrants, however, depends on the leader’s ability to exploit its window of oppor-tunity. This capability will depend on the relative distribution of challenges across components and complements.
Component challenges
Innovations are often enabled by changes in com-ponents. In such cases, both firms and their sup-pliers may face considerable challenges in devel-oping and integrating these new components into the focal offer (Fine, 1998; Iansiti, 1998; Brusoni
et al., 2001). How do component challenges affect the performance of technology leaders who pioneer technology generations?
A key driver of early mover advantage is the opportunity to exploit production and market experience to progress down the learning curve, increasing the firm’s added value by improving the offer’s performance or costs (Spence, 1981; Lieberman, 1984, 1989; Argote, 1999). Empiri-cal studies of learning curves from the 1930s to the present day have found significant variance in learning potential. For example, in their review of 22 learning curve studies, Dutton and Thomas (1984) report progress ratios that vary from 55 percent (high learning opportunity) to over 100 percent (no learning opportunity).4
The extent to which progress down the learning curve can be a source of advantage is intimately linked to the potential for learning—greater advan-tage is rooted in greater learning potential. Hence, to understand learning as a source of advantage
4The progress ratio measures the cost reduction associated with a doubling of production. A progress ratio of X percent implies that a doubling of production reduces cost of production to X percent of the initial cost.
we must consider what drives differences in the magnitude of the learning opportunity.
The magnitude of the learning opportunity depends both on the extent to which the innovating firm needs to change its current approach to prob-lem solving and the scope it has for doing so. It is the emerging mastery of new routines that under-pins a firm’s progress down the learning curve. If very little change from the status quo is required, it follows that there is not much new for the firm to learn; hence, both the opportunity for and the relative advantage from learning will be relatively low. In contrast, when the innovating firm needs to overcome high uncertainty and complexity in order to bring its offer to market, the opportunity for learning will be higher, as will be the potential for learning to be a source of competitive advan-tage.5
When the focal innovation requires accompa-nying innovations in components, the focal firm’s development challenges increase, as it now must overcome additional hurdles in specifying, sourc-ing, and integrating new components into its new designs. These challenges can impact both the technological as well as the organizational routines that must be mastered by the firm in order for it to bring the innovative offer to the market. In this way, component challenges increase the magnitude of the firm’s learning opportunity, and hence the advantage it can gain from progressing down the learning curve in advance of its rivals.
Further, the increased requirements for closer coordination with suppliers (Dyer and Singh, 1998) and more frequent iterations through design and development cycles (Clark and Fujimoto, 1991)
that accompany challenging components,
contribute not only to increasing the benefits to the technology leader from greater experience with the new technology, but also to reducing the ease with which later rivals can imitate this progress (Lippman and Rumelt, 1982; Rivkin, 2000). For example, rivals have found it difficult to imitate
5Balasubramanian and Lieberman (2006) report findings that are highly consistent with these arguments. This study considers 117 industries to examine how the relationship between experience and productivity depends on research and development (R&D) intensity (a proxy for industry development challenges). This study finds that greater R&D intensity is correlated with lower progress ratios (i.e., greater learning potential), which is con-sistent with our argument that greater learning potential should increase the relative benefits that accrue to firms with a head start in moving down the learning curve.
innovations that emerged from the extensive col-laboration between Toyota and its key suppliers (Dyer, 1996; Dyer and Hatch, 2006).
Hypothesis 1: Greater technological challenges in components will increase the performance advantage of technology leaders.
The degree to which component challenges increase the performance advantage of technology leaders may be tempered by the extent of modular-ity between the component and the focal product. Two mechanisms stand out when interfaces are well specified. First, with regard to the focal firm, there may be less potential for learning because key developments are undertaken by the supplier. Second, with regard to the focal firm’s rivals, there is the possibility that once the component has been developed for the technology leader, rivals can free ride on these investments and ‘plug-and-play’ the component directly into their own offers, thereby reducing the leader’s period of exclusivity in the market.
We note, however, that while these factors can reduce the extent to which component challenges increase a leader’s advantage, they are unlikely to reverse the direction of the effect. While mod-ularity does reduce interdependence, it does not eliminate it. For example, Brusoni and Prencipe (2001) note that while modularity allows for the rise of specialist component suppliers, it also poses greater organizational and knowledge requirements on the focal firms in their role as system inte-grators. Similarly, Hoetker’s (2006) study of out-sourcing choices in the notebook computer market supports the argument that organizational coordi-nation challenges exist even when technologies are highly modular.
Complement challenges
We have argued that component challenges can increase both potential for learning as well as bar-riers to imitation, and hence increase the advan-tages that accrue to technology leaders. How are the factors that support these advantages affected by challenges in complements? The resolution of component challenges is required in order for a firm to be able to produce its offer and present it to the market. However, the extent to which the offer can create value for users depends on
the availability of critical complements. For exam-ple, the Airbus A380’s ability to create value for its airline customers is hampered until airports, as key complementors, undertake the modifications to their terminals that are required to handle the oversized aircraft.
Many innovations rely on the availability of complements to unlock their full value. Rosen-berg (1972: 21) submits that a single innovation rarely constitutes a ‘complete innovation,’ and that the opportunities and challenges faced by users in adopting the innovation can be influenced by the state of development of complements. Hughes (1983) describes imbalances in the pace of devel-opment of complementary innovations as creating ‘reverse salients’ on the frontier of technological development. Ethiraj (2007) illustrates how com-plements constrained the value of products devel-oped by suppliers to the personal computer indus-try. Goldfarb (2005) offers a qualitative examina-tion of how challenges in complements delayed the adoption of electricity in the railroad and printing industries in the early 1900s.
Greater complement innovation challenges result in delays in the availability of the complement as complementors struggle to overcome their own technology hurdles. By reducing the value creation of the focal offer, delays in the availability of suit-able complements act to slow the adoption rate of the new offer. These adoption delays impact the advantage from technology leadership in two distinct ways. First, they allow rivals more time to catch up and possibly imitate the leader before the market takes off. Second, because lower rates of adoption will reduce the firm’s ability to gain experience (i.e., lower demand will lead to lower production quantities), the leader will make slower progress down the learning curve during its period of exclusivity. Hence, even without imitation, later entrants will confront a leader with a smaller com-petitive advantage. By acting to slow both adoption and the accumulation of experience, greater com-plement challenges erode the sustainability of the technology leader’s competitive advantage.
Hypothesis 2: Greater technological challenges in complements will decrease the performance advantage of technology leaders.
The impact of complement challenges on tech-nology leaders is likely to be affected by the extent to which complements are open vs. proprietary.
When complements are open, such that they can be used with the offer of any firm, laggards will benefit from any progress that had been made in the market to advance the leader’s offer; that is, spillovers will be higher and technology leaders will see their advantage eroded.
When complements are proprietary, such that they can only work with the offer of a partic-ular firm, spillovers will be reduced. However, the leader need not necessarily be better off: to the extent that there is a new race to be won in the development of suitable complements, whether the first firm in the market with the focal offer will also win the race to be first to market with the key complement will depend on a number of case-specific factors. What is clear, however, is that even when complements are proprietary, high complement challenges forces firms to compete in a second race for leadership. Hence, regardless of whether complements are open or proprietary, complement challenges erode the benefit of tech-nology leadership in the focal offer.
The balance of uncertainty: technology vs. opportunism
Our discussion is focused on innovation challenges that arise in ecosystems, in which focal offers need to be combined with components and complements if they are to present a value-creating solution to customers. We have argued that in such contexts the distribution of technological challenges across the ecosystem is an important driver of firms’ out-comes. We now consider vertical integration as a governance strategy to manage such interdepen-dence.6
A key benefit of vertical integration is the abil-ity to mitigate contractual hazards. These con-tractual hazards arise when firms and their sup-pliers make asset-specific investments under con-ditions of uncertainty (Williamson, 1985). When contracting with suppliers for innovative compo-nents with high development challenges, the focal firm faces two specific kinds of uncertainty. The first is the technological uncertainty surrounding
6In our empirical setting, a subset of firms integrate into compo-nent production, but no firms integrate into complements. Hence, because we are only able to test arguments regarding vertical integration into components, we do not hypothesize about the benefits of integration choices with respect to complements. This question, although fascinating, is beyond the scope of this paper.
whether and when suppliers will discover appro-priate solutions to their development challenges (Clark, 1985). The second is what Williamson (1985: 58) terms behavioral uncertainty regarding whether and when suppliers will behave oppor-tunistically (Jap and Anderson, 2003; Sutcliffe and Zaheer, 1998).
The resolution of technological uncertainty determines value creation—if the supplier cannot produce appropriate components, the firm cannot bring the desired product to market. The reso-lution of behavioral uncertainty determines value capture—if the supplier renegotiates the contract terms opportunistically, the firm cannot appropri-ate the expected rents.
Early in a technology’s life cycle, technological uncertainty is at its peak. As development takes place, knowledge is accumulated and progress becomes more predictable. Although development continues throughout the life cycle, and innovation challenges are always present, within a given tra-jectory the level of technological uncertainty tends
to decrease over time (Dosi, 1982; Sahal, 1981).7
In contrast to technological uncertainty, which decreases with time, the trend for behavioral uncer-tainty as technology matures is ambiguous. On the one hand, increased experience and repeated interactions can allow firms to specify better for-mal contracts and extend relational contracts with their suppliers, such that behavioral uncertainty may decrease over time (Mayer and Argyres, 2004; Argyres, Bercovitz, and Mayer, 2007). On the other hand, it is also possible for behavioral uncertainty to increase over the technology life cycle: as firms continue to work with suppliers to
7The literature has distinguished among industry life cycles (i.e., the time span between an industry’s emergence and its decline), technology life cycles (i.e., within a given industry, the time span between a new technology’s emergence and its decline), and product life cycle (i.e., within a given technology, the time span between the emergence of a new product and its decline). The current study focuses on the introduction of new technology generations, and so conducts its analysis at the level of technology life cycles. We note that the distinction between the technology and product life cycles can be fuzzy depending on the context and whether product performance or product sales are being plotted on the Y-axis. However, in our context this distinction is quite clear. Within the semiconductor lithography industry, which emerged in 1962 and continues to the present day, we are examining technology life cycles, such as the period from emergence of the I-line technology generation in 1985 to its decline in the face of the rising dominance of the subsequent technology generation, We do not focus on the product life cycle that governed the rise and decline of specific product models within the I-line generation.
improve their offers, the level of co-specialization, transaction- specific assets, and supplier switching cost can increase. Similarly, as the market for the offer grows, so may the opportunity cost to the firm of switching suppliers, increasing the incentive for suppliers to behave opportunistically. For exam-ple, the classic episode of General Motors (GM) and Fisher Body as discussed by Klein (1988, 2000) suggests that the rapid increase in demand for closed metal bodies created significant contrac-tual hazards for GM and led GM to acquire Fisher Body.
Vertical integration mitigates the effects of behavioral uncertainty but not of technological
uncertainty.8 If the level of technological
uncer-tainty decreases more rapidly than behavioral uncertainty over the technology’s life cycle, then the relative importance of behavioral uncertainty rises. Under these conditions the benefit from ver-tical integration will be greater at later stages of the technology life cycle.
Hypothesis 3: The performance advantage from vertical integration will increase over the course of the technology life cycle.
EMPIRICAL CONTEXT
We test our hypotheses in the context of the semi-conductor lithography equipment industry. Semi-conductor lithography is a key process used by semiconductor manufacturers to create integrated circuits. Improvements in lithography tools have been the main driver of progress in semiconductor manufacturing, enabling the production of higher performance chips at lower marginal cost (Moore, 1995). From its emergence in 1962 to 2005, the semiconductor lithography industry has witnessed the commercialization of nine different technolog-ical generations. From the beginning, lithography tool manufacturers have regarded technology lead-ership to be a key source of competitive advantage. Being among the first to introduce a new technol-ogy generation offers technoltechnol-ogy leaders signifi-cant learning advantages as well as the opportunity to lock in customers due to high switching costs.
8Vertical integration may also allow firms to develop a better understanding of the interactions between the focal components and the product architectures (Kapoor and Adner, 2009), and to apply such firm-specific knowledge to facilitate improvements over the technology life cycle (Novak and Stern, 2008).
Lens
Mask with IC pattern on top
Semiconductor wafer with resist layer Energy source
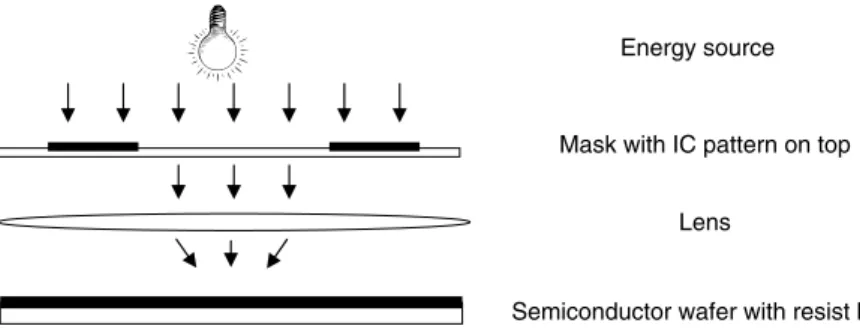
Figure 3. Basic schema of the semiconductor lithography process
In each of the nine technology generations, the manufacturers of lithography tools had to over-come significant innovation challenges. Although suppliers and complementors were always criti-cal to enabling each new technology generation, the magnitude of their challenges varied across generations —whereas in some generations it was possible to simply reuse existing elements, other generations required suppliers and complementors to completely reinvent their offers.
Semiconductor lithography
Semiconductor lithography is the process by which a circuit design is imprinted on a semiconductor wafer. The basic principle of lithography is illus-trated in Figure 3. After the design of an integrated circuit (IC) is finalized (i.e., the wiring, the gates, and the junctions), the circuit blueprint is
trans-ferred to a mask. The lithography process takes
place when beams of energy originating from an
energy sourceare directed onto the mask. The pat-tern on the mask allows a portion of the energy
to pass through, with or without an optical lens
system, onto the wafer. The wafer is coated with
an energy sensitive resist. The resist undergoes a
chemical reaction wherever the mask has allowed the energy to pass through. This chemical reaction changes the structure of the resist and allows its selective removal from the wafer. Another chemi-cal process is then initiated in which the exposed parts of the wafer are etched. Finally, the remain-ing resist is removed, creatremain-ing a final circuit that replicates the initial design. A single wafer can go through this process a number of times as multiple layers of circuits are etched onto it. For exam-ple, in 2006, a one gigabit dynamic random access memory chip could be etched with as many as 60 circuit layers.
The key performance attribute of a lithography tool is its resolution, the smallest geometry on which the tool can focus on the wafer surface. Resolution determines the extent of miniaturization that can be achieved by the semiconductor man-ufacturer. A semiconductor manufacturer will use scores of lithography tools in a single production line, often one for each circuit layer. With mod-ern tools costing over $20 million each, invest-ments in lithography equipment represent a sub-stantial portion of the cost of a fabrication facility. Lithography ‘production recipes,’ which are cus-tomized to specific tool models, masks, and resists, are regarded as a key source of advantage for semiconductor manufacturers who invest signifi-cant resources in optimizing their production lines (Iansiti, 1998). To maintain competitiveness semi-conductor manufacturers continuously reinvest in their facilities and look to new lithography tech-nology generations to allow them to offer products with higher performance at lower cost.
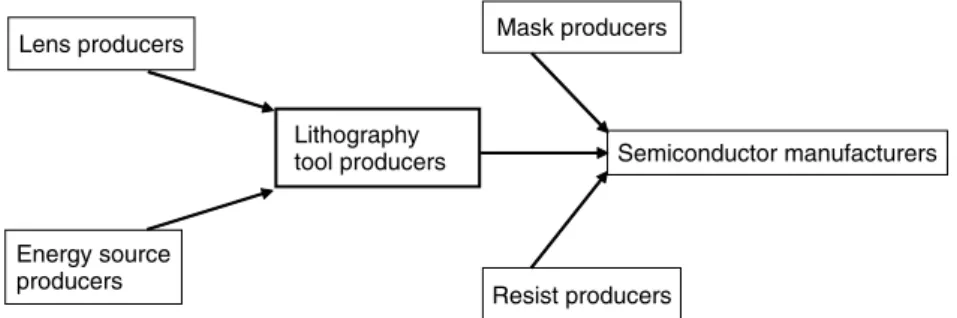
The current study’s focal firms design and assemble the lithography tool. The key compo-nents that these toolmakers need to integrate into their offers are the energy source and the lens. Their customers are semiconductor manufacturers who use the lithography tool in their fabrication plants. The mask and the resist are the key com-plements that these customers must integrate with the lithography tool. A schema of the lithography tool ecosystem is presented in Figure 4.
The development of a new generation of lithog-raphy tool technology poses significant challenges for tool manufacturers to achieve finer and finer resolutions. A new technology generation can also impose substantial challenges on other ecosystem elements: the energy source may need to operate at a new wavelength; the lens may need to be man-ufactured from a new material; the mask, which needs to be etched with thinner lines, may need to
Lens producers
Energy source producers
Resist producers Lithography
tool producers Semiconductor manufacturers
Mask producers
Figure 4. The semiconductor lithography equipment ecosystem
be manufactured in a new way, possibly from new materials; the chemical resist may need to be refor-mulated to enable greater control of the chemical reactions as energy wavelengths become smaller and geometric resolutions become finer.
Despite undergoing nine generational transi-tions, the structure of interdependence in the ecosystem —the components that need to be inte-grated by the focal tool manufacturers and the complements that their customers, the semicon-ductor manufacturers, need to combine with the tool offer—has remained unchanged throughout the 44-year period that we study. All tool manu-facturers integrate the source and lens components and leave it to their customers to integrate the mask and the resist complements with the tool. This choice of what to bundle and what to exclude in the tool offer is rooted in a lack of syner-gies on both the supply and demand sides. On the supply side, there is little overlap between the knowledge bases and resources required to succeed in developing and assembling lithography tools (highly complex batch assembly), creating new resists (producing vats of very specialized chemi-cal solution), and mask production (essentially a custom printing service business). More impor-tantly, on the demand side, the big semiconduc-tor manufacturers (the toolmakers’ most important customers) have had little interest in fully bundled solutions —they regard their proprietary produc-tion recipes for putting together tool, mask, and resist as a key source of their own competitive advantage (Kapoor and Adner, 2009), and view a move to bundled lithography solutions as inviting a
loss of differentiation.9 Where tool manufacturing
9Such stability in activity flows is a common characteristic across many industries. For example, disk drive producers have always bundled motors and heads; their customers, the computer assemblers, bundle the drive with processors and software.
firms have differed is in their strategy for managing their interdependence with lens components: some firms are vertically integrated into lens production whereas others rely on external suppliers.
Thus, the industry allows us to examine a well-defined technological ecosystem that comprises focal firms, their suppliers, and their complemen-tors, in which the location and magnitude of ecosystem innovation challenges vary across tech-nology generations. The industry is also appealing because it provides a natural set of controls for two key factors that have already been examined in the innovation literature. First, all the transi-tions across technology generatransi-tions can be char-acterized as sustaining innovations (nondisruptive in the Christensen [1997] sense) in that all tech-nology generations were targeted at existing cus-tomers, enhanced performance on the same set of key performance attributes (resolution, accuracy, and throughput, in particular), and commanded sig-nificant price premiums over earlier generations. Second, the value of complementary assets —sales force, manufacturing, brand, service, and support competence—was preserved throughout (Mitchell, 1989; Tripsas, 1997).
Technology transitions in the semiconductor lithography equipment industry
The key measure of progress in semiconductor lithography is improvement in tool resolution. Finer resolutions enable the semiconductor man-ufacturers to use the lithography tool to pack more circuits onto a chip and more chips onto a wafer. These improvements allow semiconductor manu-facturers to offer chips with higher performance at lower marginal cost.
For the lithography tool manufacturers, improv-ing resolution is a top priority. Tool manufacturers increase resolution using a combination of three
levers. The first is to reduce the wavelength of light that is transmitted by the energy source. The second is to increase the size of the lens. The third is to improve the design of the tool itself. The industry distinguishes among technology gen-erations according to the design of the tool and the wavelength of energy that it transmits. Incre-mental improvements to the tool design and the lens are core drivers of product advances within a technology generation. When further improve-ments become untenable due to a combination of physical and economic constraints the industry shifts to a new design or to a smaller wavelength, which heralds the emergence of a new lithography technology generation.
In transitioning across technology generations, tool manufacturers always face significant design challenges. Consider, for example, the industry’s transition from I-line generation steppers to deep ultraviolet (DUV) 248 nm generation steppers. The core approach to increasing resolution in this transition was to decrease the energy wavelength from 365 nm to 248 nm, which would allow tool
resolution to improve from 0.8µm to 0.45µm.
The relationship between reduced wavelength and finer resolution is straightforward in theory.10
Real-izing this improvement in a commercial setting, however, requires a corresponding improvement in tool design (e.g., in terms of factors such as alignment, repeatability, reliability, and through-put). Overcoming these design challenges requires tool manufacturers to experiment and iterate, often for years, in order to come up with a suitable offer
(Henderson and Clark, 1990).11
10The resolution capability of lithography technologies that employ a lens system is given by the Rayleigh criterion:
resolution=k1x (wavelength/numerical aperture),
where wavelength is the wavelength of the light being transmit-ted by the source, numerical aperture is the measure of the size of the lens, andk1is a process-specific constant.
11Henderson’s studies of the industry have highlighted that in confronting new technology generations, firms may face both engineering challenges in creating new designs as well as cog-nitive challenges in recognizing the subtleties of change (Hen-derson and Clark, 1990; Hen(Hen-derson, 1993). In particular, these studies highlighted the unique cognitive challenges that confront incumbents when generational changes affect the architectural links among only core design concepts. The focus of our paper is on external challenges; however, we account for incumbency effects in our empirical specification.
When a new technology generation requires innovation in components, the tool manufactur-ers face greater challenges in specifying, sourc-ing, and integrating the new components into their designs. The transition to DUV 248 nm, for exam-ple, required fundamental changes in the energy source and the lens. Mercury lamps, which had been used in all earlier generations, were not able to provide sufficient energy at a wavelength of 248 nm to cause adequate chemical reactions in the resist. This challenge was overcome by the development of excimer lasers using krypton fluoride (KrF) gas. In addition, the conventional glass material that had been used to make lenses faced absorption problems with the 248 nm wave-length. The only material that could be used was fused silica, and this required major changes to the lens manufacturing process. These required changes created significant challenges in compo-nents, which, in turn, served to increase the design and integration challenges that confronted the tool manufacturers.
In order for the new generation of lithography technology to be used effectively by customers, significant challenges needed to be overcome in the development of complements as well. Mask makers needed a new material that would pro-vide improved transmission of the new wavelength which, in turn, required changes to the mask man-ufacturing process. Finally, the existing novolac resists could not absorb enough energy from the 248 nm wavelength to cause an adequate chemical reaction. To solve this challenge, a new chemically amplified resist had to be developed.
Table 1 summarizes the major technological innovations required to overcome the challenges in the tool, lens, source, mask, and resist in each tech-nology generation. Readers interested in a more detailed overview of each of the technology tran-sitions are referred to Kapoor and Adner’s (2007) study, which explains how ecosystem challenges impacted the sales evolution of different technol-ogy generations.
METHODOLOGY Data
We used both primary and secondary data sources for this study. We began by developing a detailed
T able 1 . M ajor technological innovations by the lithography equipment eco system to overcome the challenges accompanying new technology generatio ns T echnology generation (year of first sale) Resolution ( µ m) T ool Source Lens Mask Resist Initial solution (pre-1962) Mercury lamp. None. M anually cut mask. Negative resist. Contact printer (1962) 7 .00 Circuit d esign is transferred to w afer by putting m ask in d irect contact with the resist o n the wafer and then shining the light ener gy from the m ercury lamp ener gy source. — — Introduction o f Step & R epeat Camera for mask making. — Substitution o f emulsion plates by chrome on glass. Proxim ity printer (1972) 3.00 The m ask is separated from the wafer by a sm all gap. Elim inating d irect contact reduces defect rates. —— — — Projection scanner (1973) 2.00 A reflective lens system is incorporated into the tool to allow for g reater concentration o f light ener gy to be transferred through the m ask onto the wafer. — D evelopment o f reflective lens system. Use o f electron beam systems for h igh-quality 1X masks. — E-beam writer (1976) 0 .5 M ove an electron b eam through a preprogrammed p ath to create the circuit p attern directly on the resist without use o f lens o r m ask. Development o f thermionic and field em ission methods and fi nal conver g ence to Schottky em itter. — — New d evelopments
Ta b le 1 ( Continued ) T echnology gener ation (year of first sale) Resolution ( µ m) T ool Sour ce L ens M ask Resist X-ra y p ri nter (1978) 0.3 C hange wavelength fr o m 435 nm to 10 nm and p roject ener gy from an X-ra y sour ce without use o f a lens. Developm ent o f synchr otr o n for pr oviding a h igh ener gy source. — D evelopment o f n ew mas k materials such as SiC/T a. — Developm ent o f n ew mas k mak in g techniques to pr ovide sm aller geom etr ies. G-line stepper (1978) 1.25 Step- and-re peat technology allows a single w af er to be etched thr ough m u ltiple exposures as the m ask is shifted across the wafer in steps. A refractive lens system allows for the cir cuit d im ensions on the m ask to b e 5 – 1 0 times lar g er than the d imensions etched onto the wafer. — D evelopment o f refractiv e len s system . — C hange in re sist fro m stan d ard negative resist to novolac re sist. I-line stepper (1985) 0.80 W avelength d er ived fr o m the m er cur y lamp ener gy source is reduced from 435 nm to 365 nm . — D evelopment o f n ew lens material for re duced wavelength. —— DUV 248 nm stepper (1986) 0.45 W avelength is reduced fr o m 365 nm to 248 nm . Developm ent o f k rypton fluor ide (Kr F) excimer laser. Change in lens material to fused silica. Change in m ask material to quartz. Change in resist to chemically amplified resist. DUV 193 nm stepper (1996) 0.15 W avelength is reduced fr o m 365 nm to 248 nm . Developm ent o f ar gon fluor ide (Ar F) excimer laser. Change in lens material to calcium fluor ide. In tr oduction o f R E T m asks for 193 nm . New v er sions of chemically amplified resist.
historical understanding of the semiconductor lithography equipment industry during a 20-month field study. We conducted multiple interviews with over 30 industry experts, most of whom have been associated with the industry for more than 20 years. The interviewees came from a variety of positions within the ecosystem: toolmakers, semi-conductor manufacturers, suppliers, complemen-tors, industry associations, and consultants. The interviews were semi-structured and lasted two hours on average. We identified ecosystem struc-ture by first asking what elements needed to be integrated by tool manufacturers in order for them to produce their offers; and second, asking what elements needed to be integrated by the tool cus-tomers in order for the tool to be used productively. There was unanimous agreement that the energy source and the lens were the key components to be integrated into the tool by the manufacturer, and that the mask and the resist were the key complements to be integrated with the tool by the customer. We used the information from the inter-views to develop an understanding of the ecosys-tem challenges that governed the emergence of the different technology generations. We consolidated this information in a document that mirrors Table 1 and sent it back to our interviewees for written and verbal comments. We incorporated these com-ments and then sent the table out for a second review. All the experts agreed with our final char-acterization.
We searched every issue of Solid State
Tech-nology from 1961 to 2001 for articles relating to
ecosystem innovation challenges.Solid State
Tech-nologyis a leading industry journal whose mission is to cover the key trends and issues that confront the industry. It has been publishing technical arti-cles on challenges facing the semiconductor indus-try since its founding in 1957. Using this source, we created measures (discussed below) that char-acterize the extent of challenges in the key compo-nents and complements for each of the technology generations.
Finally, we obtained detailed market data from the leading industry consulting firm, VLSI Research, which has been following the industry since the1970s. The VLSI data included sales by technology generation for every firm that competed in the lithography equipment industry from 1974 to 2005. Rebecca Henderson generously shared her data on the contact printing generation. Our final dataset consists of an unbalanced panel of 64
firm-technology generations. The average number of observations per group is 10.4. Our data are comprehensive and include information on each of the 33 firms that ever sold a semiconductor lithography tool for mainstream semiconductor applications.12
Variables
The definitions of the variables used to test our hypotheses are summarized in Table 2 and detailed below.
Dependent variable
Our dependent variable, generation share, is a
firm’s market share in a given technology gener-ation in a given year. This measure is consistent with prior research studies that examine firm per-formance in new technology generations (Mitchell, 1991; Henderson, 1993; Tripsas, 1997). Further, industry participants and observers (e.g., VLSI Research, Gartner Dataquest) regularly use market share in a generation as a measure of firm success. Our main analysis considers a firm’s market share in a given technology generation in a given year. As a test of robustness for Hypotheses 1 and 2, reported in the Appendix, we also consider a firm’s cumulative market share over the entire life of the technology generation.
Independent variables
Our measures of component and complement
chal-lenges were created using a count of Solid State
Technology articles that discuss ecosystem chal-lenges. Our industry sources confirmed that a count of published articles that address technical prob-lems regarding an ecosystem element is a good proxy for the level of technology challenges that surrounded the development of different lithogra-phy generations. Through our field work we devel-oped a list of keywords that we used to guide the article search.13
12The current analysis excludes two firms from our sample because, although they produced lithography tools, they were competing in different markets. These firms entered the given lithography generation during its declining phase and were targeting niche markets such as thin film heads, pressure sensors, and biotech applications rather than the mainstream applications of semiconductor manufacturers.
13The keywords were: lithography, microphotographs, mask, photomask, resist, laser, UV, DUV, Deep UV, optical, lens,
Table 2. Variable descriptions
Variables Description
Dependent variable
Generation share Firm’s market share in a given generation in a given year. Key variables in study
Technology leadership Entry timing for the firm in the new generation. Leadership position is defined as one for the first entrant and subsequent entry is measured with respect to the lag in years from the first entry.
Component challenge Number of technical articles that refer to lens and source innovation in the given generation that appear in the industry journal no later than five years after the emergence of the new generation.
Complement challenge Number of technical articles that refer to mask and resist innovation in the given generation that appear in the industry journal no later than five years after the emergence of the new generation.
Vertical integration Dummy=one for a firm with a separate business unit performing manufacturing of lens component for the generation.
Technology maturity Count of number of years between a technology generation’s year of first sale and the given year.
Control variables
Incumbent Dummy=one for a firm that sold lithography tools in an earlier technology generation.
Conglomerate Dummy=one for a firm that was active in multiple industries. Generation sales growth Annual sales growth rate of the generation.
Number of firms Number of firms active in the generation in a given year.
We identified a total of 181 lithography-related articles that appeared from 1961 to 2001. We then identified articles that discussed ecosystem chal-lenges in a given generation. We used the article titles to identify the match between the generation and the ecosystem element. If there was insuffi-cient information available in the title, we read the abstract and the conclusion to ascertain if the article addressed the innovation challenges in the ecosystem for a given generation. A small sub-set of articles discussed the ecosystem innovation challenges for multiple generations, and for these articles we read the relevant sections for each gen-eration in order to create a match. This procedure reduced our set to 102 articles.
Finally, since our primary concern is with respect to innovation challenges that confront tech-nology leaders as they pioneer techtech-nology gen-erations, we further reduced our set to include only those articles that were published no later than five years after the commercialization of the first tool in a generation. Another reason to choose the five-year post-commercialization win-dow was to present a balanced view of upstream
stepper, aligner, mercury, illuminator, exposure, printer, and the names of the different generations.
and downstream ecosystem challenges. The arti-cles published after the close of this five-year window were almost entirely dedicated to dis-cussing complement challenges. This is not sur-prising, since by the fifth post-commercialization year, much progress would have necessarily been made on the component side. Our final dataset consisted of information from 56 articles that dis-cussed 78 ecosystem innovation challenges. We tested robustness with three- and seven-year win-dows and the results are consistent with those reported here.
We constructed the component challenge
mea-sure as the sum of the number of articles that dis-cussed innovation challenges in the lens (innovlg) and the source (innovsg) for technology generation
g.14
component challengeg =innovlg+innovsg
14As validation of the article count measure, we tested its consistency with the qualitative descriptions revealed in our interviews and reported in Table 1. We coded the entries and non-entries in Table 1 with values of one and zero respectively, and then compared them to the article count data. The correlation is 0.91 for source, 0.83 for lens, 0.92 for mask, and 0.89 for resist innovation challenges. This high correlation increases our confidence in the measure.
Similarly, complement challenge was constructed as the sum of the number of articles that discussed innovation challenges in the resist (innovrg) and the mask (innovmg).
complement challengeg=innovrg+innovmg
We measure a firm’s technology leadership as
the time of its entry into a new technology gener-ation relative to its rivals. We define entry as the first occurrence of revenue for a firm in a given generation. The first firm to enter the generation was assigned a technology leadership value of one. Subsequent firms were assigned values with refer-ence to the years elapsed since the first entrant (e.g., a firm entering a generation three years after the leader was assigned a technology leadership value of four).
To assess the effects of vertical integration on
firm performance, we construct the variable
verti-cal integration. The variable takes a value of one if the firm produced its own lens component in a given technology generation and zero otherwise. During the history of the industry no tool manu-facturer produced its own energy source.
We define the variable technology maturity as
the number of years that have lapsed since the first commercial sale of a tool in the given technology generation, where the first year of commercial sales is coded as one.
Control variables
We control for a number of firm- and industry-level effects. Henderson and Clark (1990) and Henderson (1993) identified important differences between incumbents and entrants during technol-ogy transitions in the semiconductor lithography equipment industry. We control for this effect
using the variable incumbent, which takes a value
of one if a firm had sold lithography tools in an earlier technology generation.
We control for firm size through the variable
conglomerate, which takes a value of one if the firm was active in industries other than semi-conductor manufacturing equipment and zero oth-erwise. We include two industry level controls.
The first is generation sales growth, a measure of
change in tool sales (in dollars) in a given gener-ation in a given year, which represent the growth opportunities that may influence choices regard-ing investment in new technology generations. The
second isnumber of firms, which controls for the
competitive density in the generation in a given year.
Statistical analysis
We use panel data for our empirical analysis. Each
panel corresponds to a firm in a given technology
generation. The use of panel data helps to control for potential sources of unobserved heterogeneity and enables us to test how the benefits of vertical integration change over time during the course of a given generation. While both the random- and the fixed-effects models allow for explicit considera-tion of the unobserved effects, the random-effects model makes an additional assumption that the unobserved effect is uncorrelated with the indepen-dent variables. Although a fixed-effects approach would require fewer assumptions than the random-effects approach, it cannot be used if the explana-tory variables do not vary within the experimental group (Baltagi, 2005: 13). In our analysis, com-ponent challenges and complement challenges are the key explanatory variables, but they do not exhibit intertemporal variation for a firm within a given generation. For this reason, we use a random-effects model. We control for unobserved differences across firms by including firm dum-mies in a firm-generation panel (Wooldridge, 2002: 288). We also include year dummies to control for unobserved year-specific effects. We estimate the following equation:
yigt =β0+Xigtb+Dil+Ttd+aig+uigt where yigt is firmi’s market share in a generation
g in year t; Xigt is the vector of independent and
control variables; Di is the vector of dummies for
each firm; Tt is the vector of dummies for each
year; aig is the unobserved heterogeneity for a firm in a generation that is assumed to be uncorrelated with the explanatory variables; and uigt is the error term.
RESULTS
Descriptive relationships
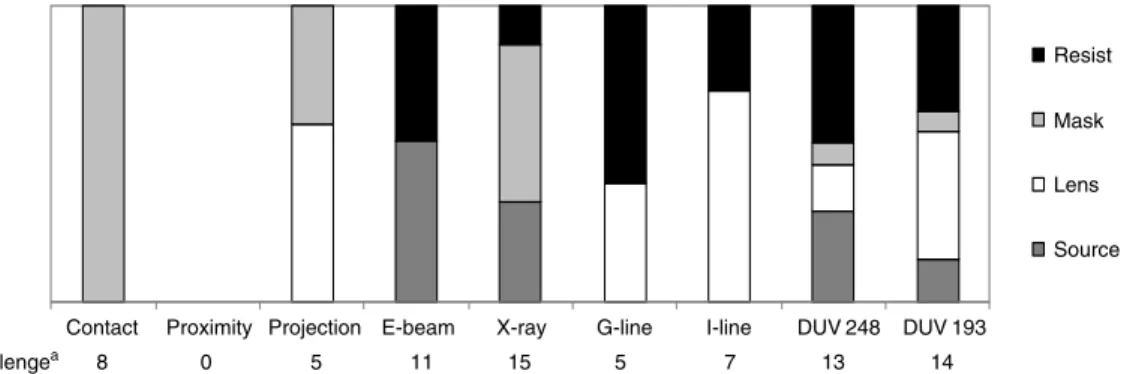
Figure 5 illustrates the varying degrees of com-ponent and complement challenges in each of the nine technology generations. As can be seen from
Resist Mask Lens
Source
Contact Proximity Projection E-beam X-ray G-line I-line DUV 248 DUV 193
Ecosystem challengea 8 0 5 11 15 5 7 13 14
aThe magnitude of ecosystem challenge is obtained by aggregating the number of article discussions for each of the ecosystem elements in a given generation.
Figure 5. Distribution of challenges among ecosystem elements in nine semiconductor lithography equipment generations
the figure, each of the technology generations pre-sented a distinct combination of ecosystem chal-lenges. This is a key source of variance that we exploit in this study.
The descriptive statistics and pairwise correla-tions for the variables used in the study are pre-sented in Table 3. The statistically significant neg-ative correlation between technology leadership (where lower values indicate earlier entry timing) and generation share suggests that early entry is rewarded with higher market share in the semi-conductor lithography equipment market. Since component challenges and complement challenges are moderately correlated, we estimate their coeffi-cients in separate models, as well as in a combined model, to alleviate concerns regarding multicolin-earity.
Tests of the hypotheses
Our hypotheses predict the impact of external ecosystem challenges on the entry timing advan-tage that accrues to technology leaders, and the impact of vertical integration decisions on firm per-formance over the course of the technology life cycle. We test Hypotheses 1 and 2 by interact-ing firms’ technology leadership with measures of ecosystem challenges. We mean centered the vari-ables in the interaction terms. The mean centering of continuous variables helps to reduce potential multicolinearity and facilitates the interpretation of the estimated coefficients (Aiken and West, 1991). We test Hypothesis 3 by interacting firms’ vertical integration status with the generation’s technol-ogy maturity. Consistent with prior empirical stud-ies examining market share performance in new
technology generations (Henderson, 1993; Tripsas, 1997), we use a semi-log specification to test our hypotheses.
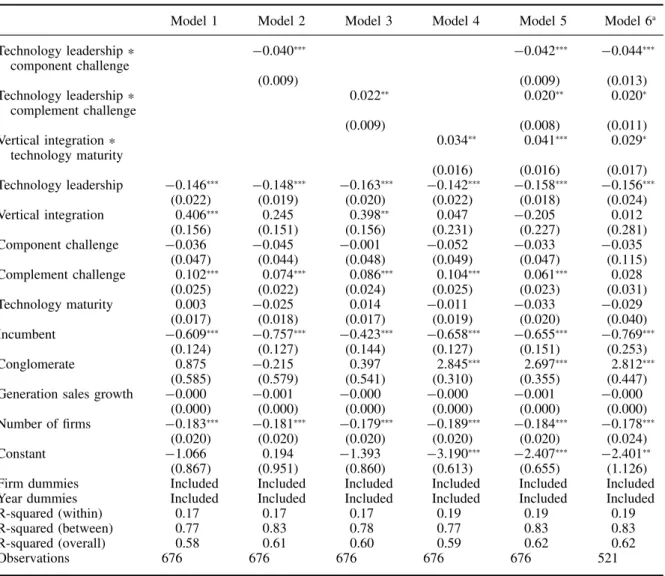
Table 4 reports our regression results. Model 1 is our baseline model. Consistent with conventional wisdom in the industry, the coefficient for tech-nology leadership is statistically significant and negative, indicating benefits to technology lead-ership. We find that incumbency has a negative effect, which is consistent with Henderson’s (1993) empirical findings. The coefficient for vertical inte-gration is statistically significant and positive, sug-gesting that in-house component manufacturing is a source of advantage in this industry. The coeffi-cient for complement challenge is also statistically significant and positive. While not hypothesized, this finding indicates that on average, the market share of a firm is greater when complement chal-lenges are high than when complement chalchal-lenges are low. Given that an increase in a firm’s mar-ket share translates to a decline in rivals’ marmar-ket shares, the result suggests that greater complement challenges may result in lower variance among the firms’ market shares so as to increase the mean market share level of the population. We computed the coefficient of variation for a firm’s market share at different values of complement challenges and consistent with the above finding, the cor-relation between complement challenges and the
coefficient of variation was negative.15Among the
industry-level controls, the coefficient for number of firms is negative and statistically significant,
15We note that when we exclude the X-ray and e-beam gen-erations in Model 6 (below) the direct effect of complement challenge remains positive but is statistically insignificant.