HAL Id: hal-02270633
https://hal.archives-ouvertes.fr/hal-02270633
Submitted on 26 Aug 2019
HAL
is a multi-disciplinary open access
archive for the deposit and dissemination of
sci-entific research documents, whether they are
pub-lished or not. The documents may come from
teaching and research institutions in France or
abroad, or from public or private research centers.
L’archive ouverte pluridisciplinaire
HAL
, est
destinée au dépôt et à la diffusion de documents
scientifiques de niveau recherche, publiés ou non,
émanant des établissements d’enseignement et de
recherche français ou étrangers, des laboratoires
publics ou privés.
Benchmarking benchmarks: introducing new automatic
indicators for benchmarking Spoken Language
Understanding corpora
Frédéric Béchet, Christian Raymond
To cite this version:
Frédéric Béchet, Christian Raymond. Benchmarking benchmarks: introducing new automatic
in-dicators for benchmarking Spoken Language Understanding corpora. InterSpeech, Sep 2019, Graz,
Austria. �hal-02270633�
Benchmarking benchmarks: introducing new automatic indicators for
benchmarking Spoken Language Understanding corpora
Fr´ed´eric B´echet
1, Christian Raymond
21
Aix Marseille Univ, Universit´e de Toulon, CNRS, LIS, Marseille, France
2INSA Rennes, IRISA, Rennes,France
[email protected], [email protected]
Abstract
Empirical evaluation is nowadays the main evaluation paradigm in Natural Language Processing for assessing the rel-evance of a new machine-learning based model. If large cor-pora are available for tasks such as Automatic Speech Recog-nition, this is not the case for other tasks such as Spoken Lan-guage Understanding (SLU), consisting in translating spoken transcriptions into a formal representation often based on se-mantic frames. Corpora such as ATIS or SNIPS are widely used to compare systems, however differences in performance among systems are often very small, not statistically signifi-cant, and can be produced by biases in the data collection or the annotation scheme, as we presented on the ATIS corpus (“Is ATIS too shallow?, IS2018”). We propose in this study a new methodology for assessing the relevance of an SLU corpus. We claim that only taking into account systems performance does not provide enough insight about what is covered by current state-of-the-art models and what is left to be done. We apply our methodology on a set of 4 SLU systems and 5 benchmark corpora (ATIS, SNIPS, M2M, MEDIA) and automatically pro-duce several indicators assessing the relevance (or not) of each corpus for benchmarking SLU models.
Index Terms: Spoken Language Understanding (SLU) , bench-mark , ATIS , SNIPS , M2M , MEDIA
1. Introduction
Spoken Language Understanding (SLU) consists in translating spoken transcriptions into a formal representation, often based on semantic frames. SLU received lately a particular atten-tion as one of the crucial component of spoken chatbots and many models have been proposed to tackle this task although very few benchmark corpora are available to train and evaluate them. Corpora such as ATIS are widely used to compare sys-tems, however differences in performance among systems are often very small, not statistically significant, and can be due to biases in the data collection or the annotation scheme, as we presented for the ATIS corpus [1].
We propose in this study a new methodology for assess-ing the relevance of an SLU corpus for benchmarkassess-ing auto-matic tagging systems. We claim that only taking into account systems performance does not provide enough insight about what is covered by current state-of-the-art models and what is left to be done. We apply our methodology on a slot-tagging tasks for 4 benchmark corpora (ATIS, SNIPS, M2M, MEDIA). We build 4 tagging systems implementing 4 different machine learning models (Boosting, Conditional Random Fields (CRF), Multi-Layer Perceptron (MLP) and Recurrent Neural Networks (RNN) and automatically produce several indicators assessing the relevance (or not) of each corpus of the 4 corpus for bench-marking SLU models.
2. Methodology
The way SLU systems are benchmarked today consists mostly in aquantitativeevaluation where the performance of each sys-tem is given on a corpus annotated with a semantic model (slot/value, frame, . . . ). Theserawevaluations don’t take into account the intrinsic characteristics of these test corpora. In other terms, can we assume that two corpora for which state-of-the-art models achieve the same level of accuracy are compara-ble in terms ofcomplexityand relevance for benchmarking SLU systems?
We believe that this is not the case as some corpora can have biases in the data collection process or the annotations provided, the intrinsic ambiguity of the semantic model chosen can be very different in each corpus (size of the semantic lexi-con, average number of possible semantic label for each word) and finally the size of the training partition and its similarity toward the test partition in terms of lexical and semantic label distributions can also be very different. All these factors impact performance of a given SLU system, regardless of the model implemented to learn the task.
Describing corpora thanks to descriptive indicators about the semantic complexity of the annotation schemes or words and labels distributions is useful but this won’t indicate which aspects are already well covered by current state-of-the-art models and which ones can still be considered as open issues. Moreover the discovery of corpus biases can only be done with respect to processing models, as a corpus characteristic be-comes a bias only when it has an impact on the inference capa-bilities of the models. This is why we propose a new automatic methodology for assessing the relevance of a given corpus for benchmarking SLU systems based on the use of several SLU models, implementing different state-of-the-art paradigms. The first step in this methodology is to partition the test corpus into four clusters according to agreement/disagreement measures as well as correct/incorrect predictions obtained by all the SLU models trained on the task; then to train a classifier to automati-cally predict, for each sample in the test corpus, its cluster label. Therelevance indicatorsfor a given corpus are obtained from its cluster distribution as well as the capacity of the classifier to automatically predict cluster labels.
The application of this methodology on an SLU entity tag-ging task is described in the next sub-sections.
2.1. Automatic clustering of test utterances
We consider here an entity tagging task where the annotations are projected at the word label following aBegin, Inside, Out-sidescheme (B,I,O). The first step in our methodology is to de-velop a set of SLU systemsM=m1, m2, . . . mn,
implement-ing several inference models, trained on the same set of cor-poraC1, C2, . . ., each corpora being split into a train (C-train)
and test (C-test) partitions. For each wordwiof an utterance
u ∈C-test, letlabel(m, u, i)be the label predicted by model monwiand letlabel(ref, u, i)be the reference label ofwi.
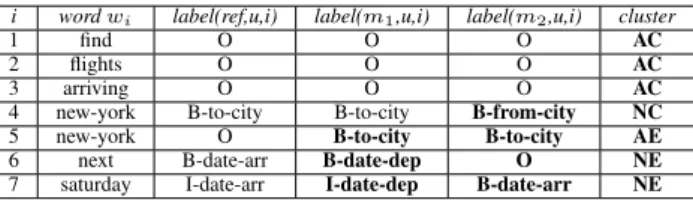
An example of this annotation scheme on the utteranceu=find flights arriving new-york new-york next saturdayis given in ta-ble 1. Let’s point out that choosing words as the basic units for semantic annotation has the advantage to be independent from a specific semantic model but has drawbacks since entity size impact the amount of errors.
i wordwi label(ref,u,i) label(m1,u,i) label(m2,u,i) cluster
1 find O O O AC
2 flights O O O AC
3 arriving O O O AC
4 new-york B-to-city B-to-city B-from-city NC
5 new-york O B-to-city B-to-city AE
6 next B-date-arr B-date-dep O NE
7 saturday I-date-arr I-date-dep B-date-arr NE
Table 1: Example of annotation of utteranceuwith two SLU models (m1,m2) and the resulting cluster for each word
We then partition all words inC-testaccording to two di-mensions: agreement and correctness. If all systems agree, they belong to partition A(agreement), otherwise partition N (no-agreement). If at least one system predict the correct label, they belong to partitionC(correct), otherwise partitionEfor errors. This partitioning process produces 4 clusters formally defined as follows:
1. AC - Agreement/Correct: all labelslabel(ref,u,i)such as∀m∈M, label(m, u, i) =label(ref, u, i)
2. AE - Agreement/Error: all labels label(ref,u,i) such as∀m, m0 ∈
M, label(m, u, i) = label(m0, u, i)and label(m, u, i)6=label(ref, u, i)
3. NC - No agreement/Correct: all labels label(ref,u,i)
such as∃m, m0 ∈M, label(m, u, i)6=label(m0, u, i)
andlabel(m, u, i) =label(ref, u, i)
4. NE - No agreement/Error: all labelslabel(ref,u,i)such as∃m, m0 ∈ M, label(m, u, i) 6=label(m0, u, i)and
@k∈M, label(k, u, i) =label(ref, u, i)
We then make the following assumptions on these clusters:
AC is thesolved problemcluster, containing examples well covered by all models, regardless of their intrinsic per-formance.
NC is thesystem comparisoncluster containing challenging examples covered by some state-of-the-art models (for example in line 4 of table 1).
NE is theopen problemcluster containing examples not han-dled by any of the current models. This can correspond to two different situations: errors coming from a lack in the training data (such as Out-Of-Vocabulary words) or errors coming fromrealambiguities not yet covered by current models.
AE is theannotation problemcluster containing mostly an-notation errors or biases in the training corpus. We con-sider that if all systems make thesameerrors, it might come from a mistake in the annotation process, like line 6 of table 1, where the repetition of the wordnew-york
is erroneously labelled asOin the reference annotation. Or it might come from a missed entity by all models, due like clusterNEto a lack in the training data.
We believe that the word distribution among the 4 clusters for a given corpusCprovides good insights about the relevance
ofCfor benchmarking systems. We propose to define our first indicator of corpus complexity asI1 = 100−
|AC|×100
|C-test| . A low value ofI1indicates that the corpus is nearly asolved
prob-lemas most examples are correctly labelled byallmodels, even the low performing ones, therefore this corpus not necessarily relevant to compare different SLU models performance.
2.2. Automatic prediction of cluster labels
Once the clustering into the four clusters has been done, we want to check how efficient would be a classifier to automati-cally classify each word of the test corpus as belonging to AC, AE, NC and NE thanks only to corpus characteristics. Our as-sumption is that cluster prediction accuracy for error clusters AE and NE are good indicators of the kind of errors contained in them:
NE : we consider that the examples in NE which are not properly classified correspond to thereal challenging ex-amples (not predictable). In contrast to the predictable examples that can correspond to error regularities that can be easily fixed, for example by incorporating knowl-edge about the task (list of cities, movies, restaurant,etc.) coming from the task database.
AE : the examples that can be accurately classified as be-longing to AE must correspond to a corpus bias rather than an intrinsic ambiguity.
To train this classifier (calledCC) we build a training cor-pus where each wordwiof an utteranceu∈C-testis a training
example, with features related to its left and right context as well as its label. The class to predictCC(u, i) =cis the clus-teridthe wordwiinubelongs to. For example, for the word 5
of table 1, we generate the following training example:
left(arriving,O new-york,to-city) word(new-york),label(O)
right(next,date-arr saturday,date-arr) => AE
We train the classifier following a10-foldsetting and com-pute precision (P), recall (R), F-measure (F) as well as the global classification error rate. F-measure for clusters NE and AE can be used to find how important is the impact of biases in the classification process. We define our second corpus com-plexity indicatorI2as being the classification error rate on the
four clusters.
It is defined as:I2= 100−
|∀u∀iCC(u,i)=error| |C-test| ×100 A low value forI2indicates that the corpus is very predictable in
terms of error prediction, therefore with little interest for eval-uating systems. At the contrary a high value forI2is a good
indicator of corpus complexity.
3. Application
We apply our methodology on a set of five SLU corpora on an entity tagging task, using four different tagging models for estimating agreement and correct/incorrect predictions. They are presented in the next subsections.
3.1. SLU corpora
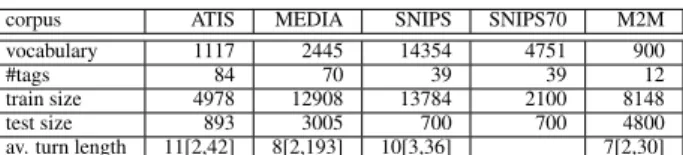
We did experiments on 5 standard benchmarks used to evaluate slot tagging systems whose characteristics are presented in table 2:
1. M2M: this corpus is a fusion of two datasets contain-ing dialogues for restaurant and movie ticket bookcontain-ing. It has been released by [2] and collected using their M2M
corpus ATIS MEDIA SNIPS SNIPS70 M2M
vocabulary 1117 2445 14354 4751 900
#tags 84 70 39 39 12
train size 4978 12908 13784 2100 8148
test size 893 3005 700 700 4800
av. turn length 11[2,42] 8[2,193] 10[3,36] 7[2,30]
Table 2:Corpus characteristics
framework (Machines Talking To Machines) that com-bines dialogue self-play and crowd sourcing to generate dialogues.
2. ATIS: The Air Travel Information System (ATIS) task [3] is dedicated to provide flight information. The train-ing set consists of 4978 utterances selected from the Class A (context independent) training data in the ATIS-2 and ATIS-3 corpora while the ATIS test set contains both the ATIS-3 NOV93 and DEC94 datasets. The ver-sion is the widely used corrected verver-sion released with [4].
3. MEDIA: this corpus is made of 1250 French dialogue, dedicated to provide tourist information. It has been col-lected by ELDA, following a Wizard of Oz protocol: 250 speakers have followed 5 hotel reservation scenar-ios. This corpus has been transcribed manually and an-notated with concepts from a rich semantic ontology [5]. 4. SNIPS: this corpus has been collected by the SNIPS company. It is dedicated to 7 in-house tasks, SearchCre-ativeWork, GetWeather, BookRestaurant,PlayMusic, AddToPlaylist,RateBook, SearchScreeningEvent [6]. 5. SNIPS70: The SNIPS benchmark is proposed in two
configurations. SNIPS70 is the same as the previous one but the training set is limited to 70 queries per intent, randomly chosen, reflecting the fact that in a real life scenario, even an enthusiastic NLU developer will gen-erally stop after supervising around 70 query examples. This makes the training set more close to real NLU de-velopment condition.
3.2. SLU models
We developed four different entity tagging systems, each of them implementing a different machine-learning model with different characteristics:
1. Boost: a boosting algorithm of small decision trees calledbonsai trees[7]. This is a very efficient text classi-fier but is not dedicated to model sequence-to-sequence problems. It does not model either any output label de-pendencies. We used 1000 bonsai trees of size 2 (4 leaves) on word 1-grams with their relative position. Since the classifier is performing feature selection, the feature window cover the full utterance.
2. CRF: a standard CRF algorithm with symbolic input features, very relevant to model output label dependen-cies. It uses a feature set of 1-grams word/relative po-sitions in an observation windows of size 7 around the current decision step.
3. MLP:a standard single-hidden-layer feed-forward neu-ral network with an hidden layer of 100 ReLu neurons and a joint embedding layer of size 100; it uses word embedding representations but does not model any tar-get label dependencies.
4. BiGru+CRF:a bidirectional recurrent GRU [8] network used to encode the sequence of words into a vector, followed by a CRF output layer. It implements a 200 (2*100) encoded utterance representation. This is the most elaborate model, with word embedding, it has ac-cess to the whole utterance thanks to the GRU and model target label dependencies thanks to the CRF objective. However this model is the one with the highest number of parameter.
In all our experiments we did not use any pretrained embed-dings or any knowledge base such as named entity dictionnaries since the goal here is not to obtain the best tagging accuracy but to observe decisions agreement among systems trained exactly in the same conditions. All neural based models are build using Keras [9], bonzaiboost implementation has been used for boost-ing [7] and Wapiti [10] for symbolic CRF. The model selection strategy for neural systems is to keep the best set of parameters among 50 epochs according to the validation set (or training set if no official validation set is provided); regularisation is done using a dropout [11] of 0.5 at the output of the last−1layer of
the network.
Table 4 reports performance for each model on each cor-pus using the global F-measure F1 computed by theconnlleval
scoring script. Note that no system is particularly tuned for a given corpus therefore small differences between systems are not necessarily significant. Unsurprisingly F1 obtained on most corpora are lower than those reported in the literature since no pretrained embeddings or semantic lexicon were used.
We can note, that the best F1 obtained on ATIS, M2M and SNIPS are pretty similar, around 94%. On the other hand per-formance on MEDIA and SNIPS70 are much lower, around 86%. If all methods perform equally well on M2M and ATIS, this is not the case for MEDIA and SNIPS: for MEDIA, using a classifier with a bag of features, not modelling any sequence as in Boost, is a big handicap, leading to poor results (−15%
compared to the best one); for SNIPS and SNIPS70, not mod-elling output label dependencies like Boost or MLP has a great negative impact on performance (nearly−10%). For SNIPS70, not having enough data to train a model with a lot of parameter such as BiGru+CRF has also a negative impact.
3.3. Estimating indicatorI1andI2
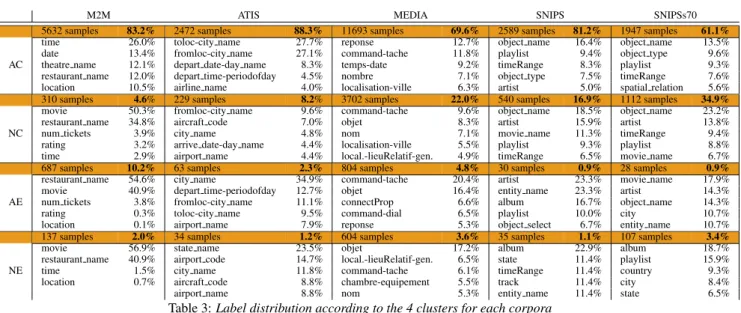
Table 3 show the size of the 4 clusters AC, AE, NC, NE we obtained following our methodology along with their 5 most frequent misrecognized labels. By computing our indicatorI1
from the size of cluster AC, as presented in section 2.1, we can compare each corpus in a more accurate way than just looking at theF1 maxobtained by the best system, as presented in table 6. As we can see, although ATIS, M2M and SNIPS obtain roughly the sameF1 max, they differ in terms ofI1, ATIS being the
mostsolvedcorpora compared to the other two. SimilarlyI1
emphasises the difference between SNIPS70 and MEDIA. We then generate a corpus in order to train a model for clas-sifying word/label tokens as AC, AE, NC, NE thanks only to word and label features from the utterance transcription, as pre-sented in section 2.2. As input features we provided, the refer-ence label, the word itself, the left and right word context, the fact that the word is an Out-Of-Vocabulary words with respect to the training corpus , the number of potential labels for this word in the train and the utterance length. The classifier we use is theBonzai Boostclassifier presented in the previous section, trained with a 10-fold process on each test corpus of our 5 cor-pora. Table 5 shows the prediction accuracy of this classifier for
M2M ATIS MEDIA SNIPS SNIPSs70
5632 samples 83.2% 2472 samples 88.3% 11693 samples 69.6% 2589 samples 81.2% 1947 samples 61.1%
time 26.0% toloc-city name 27.7% reponse 12.7% object name 16.4% object name 13.5%
date 13.4% fromloc-city name 27.1% command-tache 11.8% playlist 9.4% object type 9.6%
AC theatre name 12.1% depart date-day name 8.3% temps-date 9.2% timeRange 8.3% playlist 9.3%
restaurant name 12.0% depart time-periodofday 4.5% nombre 7.1% object type 7.5% timeRange 7.6%
location 10.5% airline name 4.0% localisation-ville 6.3% artist 5.0% spatial relation 5.6%
310 samples 4.6% 229 samples 8.2% 3702 samples 22.0% 540 samples 16.9% 1112 samples 34.9%
movie 50.3% fromloc-city name 9.6% command-tache 9.6% object name 18.5% object name 23.2%
restaurant name 34.8% aircraft code 7.0% objet 8.3% artist 15.9% artist 13.8%
NC num tickets 3.9% city name 4.8% nom 7.1% movie name 11.3% timeRange 9.4%
rating 3.2% arrive date-day name 4.4% localisation-ville 5.5% playlist 9.3% playlist 8.8%
time 2.9% airport name 4.4% local.-lieuRelatif-gen. 4.9% timeRange 6.5% movie name 6.7%
687 samples 10.2% 63 samples 2.3% 804 samples 4.8% 30 samples 0.9% 28 samples 0.9%
restaurant name 54.6% city name 34.9% command-tache 20.4% artist 23.3% movie name 17.9%
movie 40.9% depart time-periodofday 12.7% objet 16.4% entity name 23.3% artist 14.3%
AE num tickets 3.8% fromloc-city name 11.1% connectProp 6.6% album 16.7% object name 14.3%
rating 0.3% toloc-city name 9.5% command-dial 6.5% playlist 10.0% city 10.7%
location 0.1% airport name 7.9% reponse 5.3% object select 6.7% entity name 10.7%
137 samples 2.0% 34 samples 1.2% 604 samples 3.6% 35 samples 1.1% 107 samples 3.4%
movie 56.9% state name 23.5% objet 17.2% album 22.9% album 18.7%
restaurant name 40.9% airport code 14.7% local.-lieuRelatif-gen. 6.5% state 11.4% playlist 15.9%
NE time 1.5% city name 11.8% command-tache 6.1% timeRange 11.4% country 9.3%
location 0.7% aircraft code 8.8% chambre-equipement 5.5% track 11.4% city 8.4%
airport name 8.8% nom 5.3% entity name 11.4% state 6.5%
Table 3:Label distribution according to the 4 clusters for each corpora
F-measure M2M ATIS MEDIA SNIPS SNIPS70
Boost 92.6 94.2 70.6 87.2 78.1
MLP 93.1 93.2 82.3 85.7 75.9
CRF 91.7 92.4 85.7 94.0 87.9
BiGru+CRF 92.5 93.9 85.6 91.8 74.1
Table 4:Tagging performance for all systems on all corpora in terms of Micro F1 using conlleval scoring script (in %)
each corpora and cluster.
As we can see classification accuracy varies a lots accord-ing to the cluster and the corpus considered. These results are especially interesting for the error clusters (AE and NE), be-cause a high or low prediction score for these clusters allows us to further characterize them as mentioned before.
For NE, a high predictability score suggests that errors in this corpus are recurrent and identifiable. Indeed, NE from cor-pus M2M is highly predictable, and as we can see in table 3 is composed of errors in movie and restaurant name labels. An examination of these utterances showed us that they had no con-text to help disambiguate the expression when the restaurant or movie name have not been seen in the training conditions. By adding the list of restaurant and movie names to the tagging models these errors will move from NE to AC cluster. It is partly true for ATIS where the predictability is medium and where the main errors are state name, airport name and code that can be easily incorporated into the models.
Once again we have a high predictability score for AE in M2M and medium in ATIS while the main errors in this cluster in M2M are the same as NE, so same conclusion can be drawn. In ATIS the main error in this cluster is on ”city name” and as shown in [1] there are two issues on this label, the first one is frequent annotation errors when a user mention twice the same city-name, only the first occurrence is labelled; the second one is errors on ground transportation queries that were not included in the semantic annotation scheme.
By looking at the indicatorI2 (cluster classification error
rate), as shown in table 6, we can have an additional view on corpora complexity: although M2M seems to be more chal-lenging than ATIS according toI1it is almost completely
pre-dictable in terms of cluster classification according toI2. This
means that the errors in M2M are due to missing data from the training corpus, and not internal complexity. SimilarlyI1
indi-cates than SNIPS70 is more difficult than MEDIA, but by look-ing atI2we draw the conclusion than MEDIA is intrinsically
more ambiguous than SNIPS70. In all casesI1andI2are much
more informative thanF1max.
M2M ATIS MEDIA SNIPS SNIPS70
AC 99.8 98.6 89.1 95.4 92.5 NC 71.0 60.8 45.5 49.9 64.6 AE 89.7 55.1 27.5 22.2 0.0 NE 71.2 45.9 18.0 12.8 32.7 All 99.1 97.0 79.5 91.1 86.5 error rate 0.9 3.0 20.5 8.9 13.6
Table 5: Cluster predictability in F1 and classification error rate for all corpus
Indicators M2M ATIS MEDIA SNIPS SNIPS70
max F1 93.1 94.2 85.7 94.0 87.9
I1 16.8 11.7 30.4 18.8 38.9
I2 0.9 3.0 20.5 8.9 13.6
Table 6:Indicators max F1,I1andI2on the 5 corpora
We claim that the predictability of a cluster measure the overall simplicity of a corpus: the more a cluster is predictable, the more examples are similar or contains similar patterns than can be learned easily. Therefore indicatorI2is a good indicator
of the quality of a corpus to be used as a benchmark. Accord-ing to our experiments and the indicators in table 6, we may rank these 5 benchmarks from the most challenging one to the almost-solved one for evaluating slot tagging systems as: MEDIA→SNIPS70→SNIPS→ATIS→M2M.
4. Conclusion
We proposed in this study a new methodology for assessing the relevance of an SLU corpus based on two indicators,I1 and
I2, obtained through the study of firstly the agreement among
several SLU systems developed for the task and secondly the
predictabilityof the error classes made by the different systems. We apply our methodology on a set of 4 SLU systems and 5 benchmark corpora obtaining a ranking of these corpora from the most ambiguous to the almost-solved one that we claim is more accurate than just using the F1 max score.
5. References
[1] F. B´echet and C. Raymond, “Is ATIS too shallow to go deeper for benchmarking Spoken Language Understanding models?” in InterSpeech 2018, Hyderabad, India, Sep. 2018, pp. 1–5. [Online]. Available: https://hal.inria.fr/hal-01835425
[2] P. Shah, D. Hakkani-T¨ur, G. T¨ur, A. Rastogi, A. Bapna, N. Nayak, and L. Heck, “Building a conversational agent overnight with di-alogue self-play,”arXiv preprint arXiv:1801.04871, 2018. [3] D. A. Dahl, M. Bates, M. Brown, W. Fisher, K. Hunicke-Smith,
D. Pallett, C. Pao, A. Rudnicky, and E. Shriberg, “Expanding the scope of the ATIS task: the ATIS-3 corpus,” inHLT, 1994, pp. 43–48.
[4] C. Raymond and G. Riccardi, “Generative and Discriminative Al-gorithms for Spoken Language Understanding,” inInterSpeech, Antwerp, Belgium, August 2007, pp. 1605–1608.
[5] H. Bonneau-Maynard, S. Rosset, C. Ayache, A. Kuhn, and D. Mostefa, “Semantic Annotation of the French Media Dialog Corpus,” in InterSpeech, Lisbon, September 2005. [Online]. Available: ftp://tlp.limsi.fr/public/IS052010.PDF
[6] A. Coucke, A. Saade, A. Ball, T. Bluche, A. Caulier, D. Leroy, C. Doumouro, T. Gisselbrecht, F. Caltagirone, T. Lavril, M. Primet, and J. Dureau, “Snips voice platform: an embedded spoken language understanding system for private-by-design voice interfaces,” CoRR, vol. abs/1805.10190, 2018. [Online]. Available: http://arxiv.org/abs/1805.10190
[7] A. Laurent, N. Camelin, and C. Raymond, “Boosting bonsai trees for efficient features combination : application to speaker role identification,” inInterSpeech, Singapour, September 2014. [Online]. Available: http://bonzaiboost.gforge.inria.fr
[8] K. Cho, B. van Merrienboer, C¸ . G¨ulc¸ehre, F. Bougares, H. Schwenk, and Y. Bengio, “Learning phrase representations using RNN encoder-decoder for statistical machine transla-tion,” CoRR, vol. abs/1406.1078, 2014. [Online]. Available: http://arxiv.org/abs/1406.1078
[9] F. Chollet et al., “Keras,” https://github.com/keras-team/keras, 2015.
[10] T. Lavergne, O. Capp´e, and F. Yvon, “Practical Very Large Scale CRFs,” inProceedings the 48th Annual Meeting of the Association for Computational Linguistics (ACL). Association for Computational Linguistics, July 2010, pp. 504–513. [Online]. Available: http://www.aclweb.org/anthology/P10-1052
[11] G. E. Hinton, N. Srivastava, A. Krizhevsky, I. Sutskever, and R. Salakhutdinov, “Improving neural networks by preventing co-adaptation of feature detectors,” CoRR, vol. abs/1207.0580, 2012. [Online]. Available: http://arxiv.org/abs/1207.0580