An Integer Linear Programming Approach for
Genome Scaffolding
Nicolas Briot1,2, Annie Chateau1,2,3, R´emi Coletta1,2, Simon de Givry4, Philippe Leleux4, and Thomas Schiex4
1 LIRMM, UMR 5506, 161 rue Ada 34095 Montpellier Cedex 5 - France 2
Universit´e Montpellier 2, Place Bataillon, Montpellier - France
3 Institut de Biologie Computationnelle, 95 rue de la Gal´era, Montpellier - France 4
MIAT, UR-875, INRA, 31320 Castanet-Tolosan - France {briot,chateau,coletta}@lirmm.fr
Abstract. This paper presents a simple and fast approach for genome scaffolding, combining constraint modeling and simple graph manipula-tion. We model the scaffolding problem as an optimization problem on a graph built from a paired-end reads alignment on contigs, then describe an heuristic to solve this problem with the iterative combination of local constraints solving and cycle breaking phases. We tested our approach on a benchmark of various genomes, and compared it with several usual scaffolders. The proposed method is quick, flexible, and provides results comparable to other scaffolders in terms of quality. In addition, contrar-ily to state of the art approaches that require dedicated servers, it can be run on a basic notebook computer even for large genomes.
1
Introduction
This paper presents an application of the constraint programming paradigm to a crucial problem in bioinformatics, namely the genome scaffolding problem. The genome scaffolding problem consists in determining a suitable order of the incompletely assembled genome parts, called contigs, provided by common as-sembly techniques to infer a genomic sequence from Next Generation Sequencing (NGS) data.
The initial formulation as a path-merging problem was proved NP-complete [1]. A similar result was recently proven when the problem is simplified and modeled as an optimization problem in a particular graph called the scaffold graph [2]. Although this problem has already been studied through a variety of computa-tional techniques (see 3), the constraint programming approach together with this model is fully original. The main advantage of this approach is its flexi-bility, enabling the modeling of various aspects of the problem, by progressive extension towards several directions. Indeed, we may have to adapt to various forms of genomic sequences or data sources, and deal with complex issues like repeated contigs. In this paper, we set the first steps of an efficient tool that aims at performing scaffolding even on large genomes in a reasonable time on
a usual computer. This approach is presented here as a proof of concept of the application of constraint programming to the scaffolding problem.
First, we describe the biological context and mathematical formalization of the problem in Section 2. We present the state of the art in Section 3. In Sec-tion 4, we detail the model and algorithms. In SecSec-tion 5, we describe the chosen experimental settings, as well as the datasets. Finally, we examine the results in Section 6.
2
Genome scaffolding
When the genome of a new species is sequenced, the provided data consist in a huge amount (up to several billion for the longest genomes) of short sequences in which there is a variable fraction of so-called paired-end reads. Sequencing technologies [3] may vary and produce several kind of paired-end reads, but the principle remains the same. A pair of reads is defined by the sequenced extremities of a given genomic fragment (see Figure 1). Pairs can be oriented outwards or inwards, depending on the technology, but the orientation and the rough fragment length are consistent within a given dataset. In the remaining of this paper, without loss of generality, we assume that all paired-end reads are
innies(inward orientation).
Fig. 1.A fragment and its corresponding sequenced paired-end reads. Orientation can be outwards (left) or inwards (right).
Notice that, since the genome is oriented by the physical structure of the DNA molecule, reads are also oriented.
Given the reads dataset, the assembly step builds the big puzzle using over-laps between the reads (for a review of usual methods, see [4]). However, due to local lack of coverage (some areas of the genome being harder to sequence than others) and repetitions, the puzzle cannot be completely solved and the assembly produces a set of sequences of various lengths, the contigs (see Figure 2).
Fig. 2.Contigs (below) are built using the overlaps between reads (above).
Once the contigs are produced, the next step is to order them and determine their orientation, to produce larger parts of the genome called scaffolds (see
Figure 3). We also need to estimate the relative positions of the contigs inside the scaffolds (estimation of gap sizes between successive contigs). Usually, this is determined by the estimated fragment size between both reads in a pair, and the position of the reads on the contigs : the pairing information.
Fig. 3. Contigs (segments) are oriented and ordered into scaffolds (boxes) along the genome (above).
The scaffolding problem is defined as follows: given a set of contigs C = {C0, . . . , Cn−1}, and a set of paired-end reads, we want to infer an order on
the contigs, and the orientation of the contigs, that is the most consistent with the pairs. We assume that the reads have already been properly mapped to the contigs and we focus on pairs whose elements are mapped on distinct contigs. Given a fixed orientation of the contigs, there are four ways, called stories, in which a pair can map on two distinct contigs, depending on the reads orientations relatively to the contigs orientations (see Figure 4).
C1 C2 C1 C2 C1 C2 C1 C2 A B C D
Fig. 4.The four possible ways of linking two contigs for inward paired-end reads. In story A (resp. B), contigsC1(resp.C2) precedes contigC2(resp.C1) with their original orientations. In story C (resp. D), contigC1(resp.C2), with its alternative orientation, precedes contigC2(resp.C1) with its original orientation.
Several pairs could tell the same stories (see Figure 5). In this case, we assume that we can bundle them and attribute a weight to the obtained story equal to the number of stories that have been bundled. The bundling process is similar to the one presented in [1]. The data of the contigs and the weighted stories is called the scaffold graph. We denote by m the number of distinct stories, meaning the number of weighted edges in the scaffold graph. Since contigs are oriented sequences, they are represented by a pair of extremities linked by an intra-contig edge. The contig numberedkis represented by two vertices, namely 2kand 2k+ 1. The example in Figure 5 has six vertices (k= 3) and three edges (0,5),(1,2),(3,4) with weights 1,3,3 respectively (m= 3) and three intra-contig edges (0,1),(2,3),(4,5).
The genomes can be composed of several chromosomes, linear or circular. We want to adopt a general model that allows to handle those different cases. In what follows, we model the problem such that a solution produces a subgraph of the scaffold graph, which has only linear or circular (paths or cycles) connected components, and maximizes the weight of the chosen stories (i.e.weighted edges of the scaffold graph).
In Figure 6 we can see a scaffold graph of size 30 (subgraph of the scaffold graph for the bacterial sequence of a Wolbachia endosymbiont), and the solu-tion which is produced by the optimizasolu-tion process. Notice that, although the original sequence consists in one circular chromosome, there are several linear components, and a very small circular one. The linear components are good can-didates to be parts of the circular chromosome, but the small cycle should not appear. In fact, it could be an artifact due to repeats in the sequence. Indeed, the corresponding contig appears several times in the complete genome.
3
Previous work on scaffolding
Contig scaffolding is an NP-complete problem, whose solutions can be approx-imated by a greedy approach. The first greedy approach in [1] is dedicated to genomic fragments (BAC5) combined with mate-pairs, which differ from the paired-end reads essentially by their larger insert-size6, and their lower cover-ing depth, so the size of the data and the organization of the graph may differ from actual NGS data coupled with paired-end reads data. In SOPRA [5], the authors introduce a removal procedure for problematic contigs, together with a simulated annealing technique, to perform the scaffolding. Time performances are not really detailed. In OPERA [6], a graph contraction procedure approach is used to limit the size of the input, allowing the use of an exact dynamic programming approach. It is shown that the exact method gives better scaffold quality than existing heuristics. In SSPACE [7], they use a nearly greedy ap-proach, by combining iteratively the longest contigs. In GRASS [8], a genetic algorithm is provided, using mixed integer programming (MIP) as in [9] and an
5 Bacterial Artificial Chromosome 6
The insert size is the size, in base pairs, between the two fragments constituting a pair of reads
Fig. 6.Left: a (partial) scaffold graph. Contigs edges are not weighted, stories edges are weighted. Right: the solution of the corresponding scaffolding problem.
expectation-maximization process. They obtain results which are intermediary between SSPACE and Opera. In SCARPA [10], the two problems of orienting and ordering the contigs are separated, as in SOPRA. The orientation of the con-tigs is an FPT (Fixed Parameter Tractable) problem. Then, pre-oriented concon-tigs are ordered using a heuristic, and the removal of articulation vertices is used to limit the size of the connected components. Misassembled contigs are detected and removed. The authors qualify their method as moderately slow, but using not so much memory.
In all these approaches, repeats are not handled, or in the best case, they are detected and removed.
4
Model and algorithms
4.1 Integer Linear Programming Model
We present here a simple integer linear programming (ILP) model of the prob-lem. Since the weights on the inter-contig edges are integers, this model seems quite natural. The set of variables is just the set of stories, denoted by V = {x1, . . . , xm}. The domain of these variables isD={0,1}, where 0 means that the story is not chosen, and 1 that it is chosen.
The set of constraintsC expresses the constraint on the maximal degree of the chosen subgraph, i.e. a set of paths and cycles. For each contig extremity, we impose that at most one outgoing story is chosen. We do not constrain the
solution to be connected, because we want to avoid choosing an artificial path including stories of too low weight.
Finally, we maximize the objective function corresponding to the weight of the chosen subgraph:
m X
j=1
wjxj,
wherewj is the weight of the storyxj.
In Figure 7, we present a scaffold graph forn= 7 contigs (14 vertices). The ILP model leads to the following set of constraints:
x1 ≤1 x8 ≤1 x2 ≤1 x8+x9 ≤1 x3 ≤1 x4+x7 ≤1 x3+x4+x5≤1 x9+x10≤1 x1+x6 ≤1 x10 ≤1 x6+x7 ≤1 x2+x5 ≤1 (1)
and the following objective function to maximize:
32x1+ 2x2+ 2x3+ 28x4+ 52x5+ 20x6+ 80x7 +6x8+ 34x9+ 4x10.
(2) An optimal solution for this problem has an objective value of 198, selecting edges
x1, x5, x7, x9 (assigned to 1). The resulting scaffolding contains three scaffolds with contig orderings (C1), (C6, C2, C0), and (C5, C4, C3).
0 1 3 2 4 5 6 7 8 9 10 11 12 13 C0 C1 C2 C3 C4 C5 C6 x1 w1= 32 x6 w6= 20 x3 w3= 2 x2 w2= 2 x5 w5= 52 x4 w4= 28 x7 w7= 80 x8 w8= 6 x10 w10= 4 x9 w9= 34
Fig. 7.A scaffold graph fork= 7 contigs.
– Pseudo-boolean SAT solvers,e.g., SAT4J [11] ;
– SAT solvers with cardinality constraint encoding [12], possibly improved by [13] ;
– Max-SAT solvers using unary soft clauses encoding the objective function and hard clauses encoding cardinality (connectivity) constraints as in SAT ;
– Integer Linear Programming (ILP) solvers such as the state-of-the-art branch-and-bound solver IBM ILOG cplex.
4.2 Cycles removing
In our model, since we only use local constraints on the degree of each vertex, we allow solution with cycles. Except for a Hamiltonian cycle, which may correspond to a circular genome, we don’t want those cycles. We also make the assumption that these cycles are generated by repeats in the genome. If two contigsa and
bform a tandem repeat in the genome, meaning that they appear several times in the genome consecutively in that order, for instance ababab, then the stories ”ais followed by b” and ”b is followed by a” have biased weights compared to stories which are not duplicated. Thus, the cycle abamay be chosen instead of the sequenceab included in a longer sequence. Our cycle removing step is then also a potential repeats removing step. More work is needed to fully investigate the relation between the cycles that appear in our optimization process and repeats. In this paper, we focus on solving time, in order to be able to tackle large instances.
Several encoding have been proposed to enforce the no-subcycle constraint in CSP, but such a constraint is less easy to express in an ILP context. Thus we decided to address it by a SAT Modulo Theory inspired scheme: we solve the ILP problem with a solver and integrate this resolution in an incremental process, where cycles that may have been produced by the solver are forbidden in the next iteration.
5
Experiments
We present in this section the chosen dataset to explore the efficiency and ac-curacy of our method. We describe the experimental results in a more complete way than just comparing NG50 scores and computation times. We recall that the NG50 measures the scaffold length such that using longer or equal length scaffolds produces 50% of the bases of the reference genome. The results show that the NG50 is not enough to assess the quality of a scaffolder, and we give other metrics such as corrected NG50 (NGA50) and misassemblies statistics. In what follows, we refer to our method asscaftools.
5.1 Dataset
We performed the experiments on the following dataset, composed of four bac-terial genomes and two eukaryotic genomes:
– Staphylococcus Aureus(alias staphylo), NC 010079 (Staphylococcus aureus subsp. aureus USA300 TCH1516, complete genome)
– Escherichia Coli(aliasecoli), U00096.2 (Escherichia coli K-12 MG1655, com-plete genome)
– Yersinia Pestis CO92 strain (alias ypco92), NC 003143.1 (Yersinia pestis CO92 chromosome)
– Wolbachiaendosymbiont (aliaswolbachia), NC 010981.1 (Wolbachia endosym-biont of Culex quinquefasciatus Pel chromosome, complete genome)
– Homo Sapienschromosome Y (aliaschrY), human g1k v37 GRCh37.
– Arabidopsis Thaliana(aliasarabido), accession TAIR10. The read datasets have several origins:
– Real sequencing dataset for:
• Staphylococcus Aureus, short jump library7(from the GAGE dataset [4]) • Escherichia Coli, Illumina reads library SRR001665
• Arabidopsis Thaliana, Illumina reads library SRR616966
– Simulated datasets for:
• Wolbachia, simulated with toyseq, a specific tool developed for the Variathon experiment8 [14]. This dataset presents a minor variant fre-quency of 20%.
• Yersinia Pestisand the human chromosome Y, simulated withwgsim, a classical read simulator9[15].
For the read assembly step required to produce the contigs, it has been performed using two different tools (both being de Bruijn graph based):
– Staphylococcus Aureus,Escherichia Coli, andArabidopsis Thalianawere as-sembled withvelvet[16]
– Wolbachia, Yersinia Pestis and the human chromosome Y were assembled withminia[17]
The mapping of the reads on the contigs was performed usingbowtie[18] for
Escherichia ColiandArabidopsis Thaliana, andbwa[19] for the other datasets. Notice that, according to [20], these mapping tools are among the best ones from the point of view of building scaffolds.
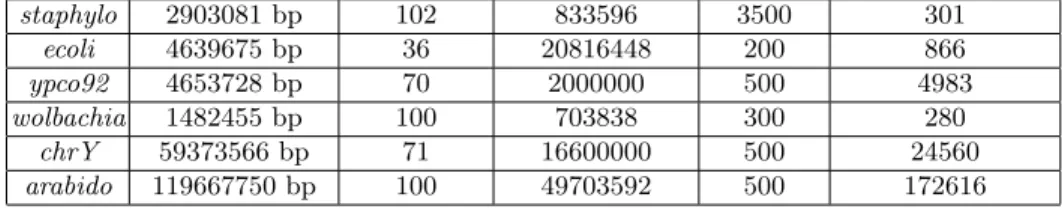
Table 1 provides additional information on the genomes, reads and con-tigs. Table 2 presents information about the scaffold graphs used as input for
scaftools. In series of four figures for the number of stories and total stories weight, the first one represents the figure without any filtering, and the other ones when the stories of weight less than 3, 6 and 10 are respectively filtered. Despite the fact that this filtering may seem drastic concerning the number of stories, it does not change the total weight so much, indicating that the data contain a lot of low supported stories.
7 http://gage.cbcb.umd.edu/ 8
http://bioinf.dimi.uniud.it/variathon
9
Genome Ref. genome size Read length Number of pairs Insert size Number of contigs staphylo 2903081 bp 102 833596 3500 301 ecoli 4639675 bp 36 20816448 200 866 ypco92 4653728 bp 70 2000000 500 4983 wolbachia 1482455 bp 100 703838 300 280 chrY 59373566 bp 71 16600000 500 24560 arabido 119667750 bp 100 49703592 500 172616 Table 1.Statistics on the datasets.
Genome Number of vertices Number of stories Total stories weight staphylo 602 4464/1442/716/489 72729/68875/66213/64602 ecoli 1732 7276/3177/2239/1829 303161/298351/294808/291911 ypco92 2656 2137/1521/1323/1197 69340/68592/67823/66918 wolbachia 560 756/243/179/119 12234/5013/4412/3851 chrY 49120 52169/31831/26940/23357 1268481/1242982/1224513/1198088 arabido 345232 146368/80146/57717/42478 1901142/1819557/1733228/1622083
Table 2.The scaffold graphs.
5.2 Evaluation
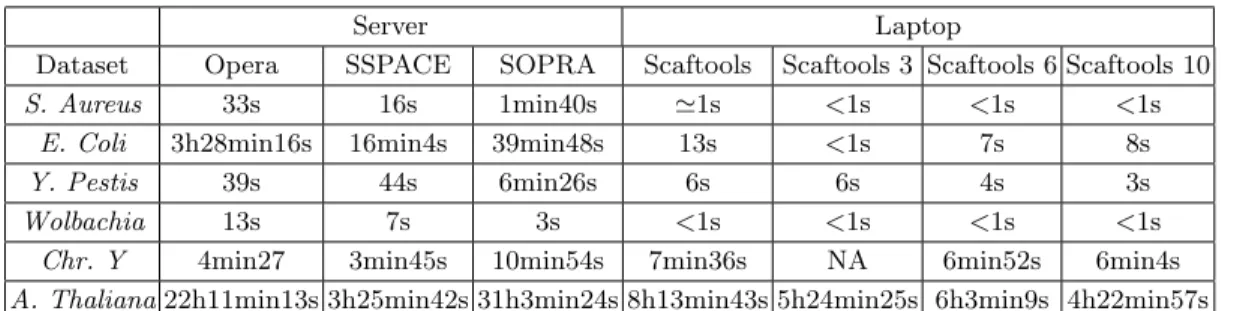
We choose to evaluate our method on several criteria. Since one of our goals is to offer a very efficient and quick tool, a major criterion is the computation time. scaftoolswas run on a usual laptop (Intel i3-2348M with 2 cores at 2.3 GHz and 5.6 GB of RAM), and memory consumption was never a problem. The other scaffolding tools were run on servers of the Genotoul cluster (48 cores AMD Operon 6176 at 2.3 GHz with 128 GB of RAM).
The other criteria concern the quality of the produced scaffolds and are of-fered by the QUAST tool10 [21]. QUAST is originally targeted at assessing as-sembly quality, but can also be applied for scaffold evaluation. It performs local alignment and rearrangement analysis on the produced scaffolds.
The filling of the gaps for thescaftoolsmethod was arbitrary set to 50bp, since it does not yet estimate the size of gaps. Preliminary experiments have shown that this length has not a strong influence on the quality of the results.
The scaffolding of the genomes were performed with respectively:
– SSPACE [7]
– SOPRA [5]
– OPERA [6]
– scaftools
– scaftools+ filtering out the stories of weight<3
– scaftools+ filtering out the stories of weight<6
– scaftools+ filtering out the stories of weight<10 10
6
Results
In this section, we present the results obtained on the different datasets.
6.1 Computation time
The computation times presented on Table 4 show thatscaftoolsis faster than the other methods. The rare exceptions are due to the output writing time, for large genomes, as shown on Table 4, which presents the detailed computation time for each step of thescaftoolsprocess.
Server Laptop
Dataset Opera SSPACE SOPRA Scaftools Scaftools 3 Scaftools 6 Scaftools 10 S. Aureus 33s 16s 1min40s '1s <1s <1s <1s
E. Coli 3h28min16s 16min4s 39min48s 13s <1s 7s 8s Y. Pestis 39s 44s 6min26s 6s 6s 4s 3s Wolbachia 13s 7s 3s <1s <1s <1s <1s
Chr. Y 4min27 3min45s 10min54s 7min36s NA 6min52s 6min4s A. Thaliana22h11min13s 3h25min42s 31h3min24s 8h13min43s 5h24min25s 6h3min9s 4h22min57s
Table 3.Computation time comparison.
Dataset Detailed computation time Total
Phase cplex1 CR 1 cplex2 CR 2 output Total
S. Aureus 0.12s 0.0037s 0.14s 0.0029s 0.1016s 0.3682s E. Coli 0.48s 0.0610s 0.08s 0.0037s 0.1375s 0.7622s Y. Pestis 0.10s 0.17s 0.11s 0.17s 52s 52.55s Wolbachia 0.06s 0.0042s 0.08s 0.0037s 0.1374s 0.2853s Chr. Y 2.69s 42.06s 4.94s 42.80s cplex3 CR 3 cplex4 CR 4 193s 285.49s A. Thaliana 3.85s 619.44s 5.00s 596.299s 5.03 608.655s 5.28 602.322 2878.51s 5324.386s Table 4.Detailed computation times forscaftools. CR means ”Cycle Removal”. The output time does not include the generation of the fasta file.
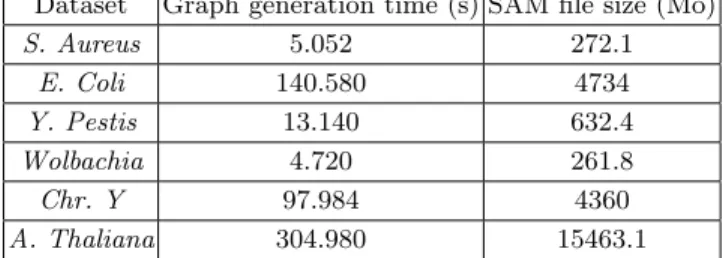
Table 6 shows that the cycle breaking process presents few iterations, even for large genomes. Thus, the iterative strategy is not expensive and we do not have to fear long collapsing time. Concerning the RAM requirements, memory usage was never a problem during the experiments on a usual laptop. We recall the memory requirements of the other scaffolders on Table 7.
Dataset Graph generation time (s) SAM file size (Mo) S. Aureus 5.052 272.1 E. Coli 140.580 4734 Y. Pestis 13.140 632.4 Wolbachia 4.720 261.8 Chr. Y 97.984 4360 A. Thaliana 304.980 15463.1
Table 5.Time to generate the scaffold graph from the SAM file.
Dataset Number of iterations Number of cycles S. Aureus 2 3 E. Coli 2 3 Y. Pestis 2 1 Wolbachia 2 6 Chr. Y 2 3 A. Thaliana 4 60 – 7 – 2
Table 6.Number of iterations and cycles
Dataset Opera SSPACE Sopra S. Aureus 336M 496M 1.150G E. Coli 10.745G 1.453G 16.878G Y. Pestis 345M 462M 685M Wolbachia 251M 448M 230M Chr. Y 262M 512M 1.718G A. Thaliana15.167G 9.355G 25.169G
6.2 Quality of the scaffolding
QUAST provides a variety of measures to estimate the quality of a set of se-quences (usually contigs, here scaffolds) relatively to a reference genome. Table 8 presents some of these measures and Figure 8 shows a visualization of the Opera and Scaftools scaffolds for thestaphylodataset. The NGA50 is the NG50 where the lengths of aligned blocks are counted instead of scaffold lengths. i.e., if a scaffold has a misassembly with respect to the reference, the scaffold is broken into smaller pieces. Opera and scaftoolsshow larger NG50 statistics because they are more aggregative, but it does not mean that this aggregation is always better.
Results on other genomes are similar, detailed results can be found athttp: //www.lirmm.fr/~chateau/scaftools/v_0_1/results/.
As could be expected, the blunt scaftools method without filtering leads to more errors than the classical methods, but this is improved by filtering the low supported stories. Notice that the results are then comparable to those provided by other scaffolders.
Fig. 8. Visualization of the S. Aureus assem bly with Op era (left) and Scafto ols 10 (righ t) resp ectiv ely on y-axis v ersus the reference genome on x-axis. Eac h horizon tal dott ed line separa tes tw o differen t scaffolds.
Statistics Con tigs Op era SSP A CE SOPRA Scafto ols Scafto ols 3 Scafto ols 6 Scafto ols 10 # sca ff ol ds 301 194 174 300 150 164 134 97 Assem bly length (bp) 2860307 2899757 2853630 2860279 2867857 2865655 2862009 2856206 NG50 48440 364718 48440 48440 895496 895353 895118 895118 NGA50 48149 197571 48149 48149 171910 171910 171910 171910 # misa ssem blies: 9 16 9 9 56 42 39 39 # lo cal misassem blies 8 81 8 8 74 73 72 69 # predicte d genes (unique ) 2720 2693 2721 2720 2721 2719 2710 2706 T able 8. QUAST scaffolding analysis for the staphylo dataset. W e displa y here 7 differen t statistics for the assem blies. #scaffolds: the n um b er of scaffolds in the assem bly . Assem bly length: total length o f the assem ble d scaffolds in base pairs. NG50: scaffold length suc h that u sing longer or equal length scaffolds pro duces half (50%) of the bases of the reference genome. NGA50: NG50 where the lengths of aligned blo cks are coun ted instead o f scaffold lengths, i.e. if a scaffold has some misas sem blies with resp ect to the referenc e, the scaffold is brok en in to smaller pieces. # misassem blies: n um b er of p ositions in the assem bled scaffolds where (1) tw o con tigs should b e adjacen t but are separated b y o v er 1kbp or o v erlap on more than 1 kbp: relo cation or (2) tw o con tigs app ear on differen t strands: in v ersion or (3) they app ear on differen t chromosomes: translo cation. Notice that, for all scaffolders and genomes include d, most misassem blies w ere relo cat ions. # lo cal misassem blies: n um b er of relo cations where tw o con tigs should b e adjacen t but are separated b y o v er 1kbp or o v erlap on more than 1 kbp. # predicted genes (unique): n um b er of unique genes in the assem bly iden tified b y GeneMark.hm m.
7
Conclusion and future works
We developed and analyzed an efficient method for scaffolding, which defines a proof of concept with encouraging results when compared to other methods. There are still a a variety of possible improvements that need to be explored in future work. For instance, we aim at integrating the distances between contigs in the scaffolding process. This information can be extracted from the mapping results, based on the mean insert size. This may lead to an improvement of the quality of the stories, since we will be able to put aside pairs of reads showing inconsistent distance information. We also could improve the model by account-ing for possible multiplicities of the contigs (repeats), either by inferraccount-ing those multiplicities using the mapping profile, or by deeply investigating the connexion between artefactual small cycles and repeated contigs. There are multiple ways to integrate this information in our model and it is still unclear which approach is the most favorable. Finally, the computation time can still be further improved, by exploiting, for example, incremental resolution of the ILP problems instead of iterated solving11.
Acknowledgements
This work was partially funded by the Institut de Biologie Computationnelle. Thanks to Laurent Lemarchand, for his“last minute‘ interesting discussion on CPLEX. We also thank in Toulouse Christophe Klopp for introducing the scaf-folding problem to us and Matthias Zytnicki for his help on collecting the datasets.
References
1. D.H. Huson, K. Reinert, and E.W. Myers. The greedy path-merging algorithm for contig scaffolding. J. ACM, 49(5):603–615, 2002.
2. Annie Chateau and Rodolphe Giroudeau. Complexity and Polynomial-Time Ap-proximation Algorithms around the Scaffolding Problem. In Adrian Horia Dediu, Carlos Mart´ın-Vide, and Bianca Truthe, editors, AlCoB, volume 8542 ofLecture Notes in Computer Science, pages 47–58. Springer, 2014.
3. J. Adams. DNA sequencing technologies. Nature Education, 1, 2008.
4. S.L. Salzberg, A.M. Phillippy, A. Zimin, D. Puiu, T. Magoc, S. Koren, T.J. Tre-angen, M.C. Schatz, A.L. Delcher, M. Roberts, G. Mar¸cais, M. Pop, and J.A. Yorke. GAGE: A critical evaluation of genome assemblies and assembly algorithms. Genome Research, 22(3):557–567, 2012.
5. A. Dayarian, T.P. Michael, and A.M. Sengupta. SOPRA: Scaffolding algorithm for paired reads via statistical optimization. BMC Bioinformatics, 11:345, 2010. 6. S. Gao, W.-K. Sung, and N. Nagarajan. Opera: Reconstructing Optimal Genomic
Scaffolds with High-Throughput Paired-End Sequences. Journal of Computational Biology, 18(11):1681–1691, 2011.
11
7. Marten Boetzer, Christiaan V Henkel, Hans J Jansen, Derek Butler, and Wal-ter Pirovano. Scaffolding pre-assembled contigs using SSPACE. Bioinformatics, 27(4):578–579, 2011.
8. A.A. Gritsenko, J.F. Nijkamp, M.J.T. Reinders, and D. de Ridder. GRASS: a generic algorithm for scaffolding next-generation sequencing assemblies. Bioinfor-matics, 28(11):1429–1437, 2012.
9. Leena Salmela, Veli M¨akinen, Niko V¨alim¨aki, Johannes Ylinen, and Esko Ukkonen. Fast scaffolding with small independent mixed integer programs. Bioinformatics, 27(23):3259–3265, 2011.
10. N. Donmez and M.L. Brudno. SCARPA: scaffolding reads with practical algo-rithms. Bioinformatics, 29(4):428–434, 2013.
11. D. Le Berre and A. Parrain. The Sat4j library, release 2.2.Journal on Satisfiability, Boolean Modeling and Computation, 7(2-3):59–64, 2010.
12. I. Ab´ıo, R. Nieuwenhuis, A. Oliveras, E. Rodr´ıguez-Carbonell, and V. Mayer-Eichberger. A New Look at BDDs for Pseudo-Boolean Constraints. Journal of Artificial Intelligence Research, 45:443–480, 2012.
13. I. Ab´ıo, R. Nieuwenhuis, A. Oliveras, and E. Rodr´ıguez-Carbonell. A Parametric Approach for Smaller and Better Encodings of Cardinality Constraints. In Chris-tian Schulte, editor,CP, volume 8124 ofLecture Notes in Computer Science, pages 80–96. Springer, 2013.
14. Variathon 2013. http://bioinf.dimi.uniud.it/variathon.
15. Heng Li, Bob Handsaker, Alec Wysoker, Tim Fennell, Jue Ruan, Nils Homer, Ga-bor Marth, Goncalo Abecasis, Richard Durbin, et al. The sequence alignment/map format and SAMtools. Bioinformatics, 25(16):2078–2079, 2009.
16. Daniel R Zerbino and Ewan Birney. Velvet: algorithms for de novo short read assembly using de Bruijn graphs. Genome research, 18(5):821–829, 2008.
17. Rayan Chikhi, Guillaume Rizk, et al. Space-efficient and exact de Bruijn graph representation based on a Bloom filter. InWABI, pages 236–248, 2012.
18. Ben Langmead, Cole Trapnell, Mihai Pop, Steven L Salzberg, et al. Ultrafast and memory-efficient alignment of short DNA sequences to the human genome. Genome Biol, 10(3):R25, 2009.
19. Heng Li and Richard Durbin. Fast and accurate long-read alignment with Burrows-Wheeler transform. Bioinformatics, 26(5):589–595, 2010.
20. Martin Hunt, Chris Newbold, Matthew Berriman, and Thomas Otto. A compre-hensive evaluation of assembly scaffolding tools. Genome Biology, 15(3), 2014. 21. Alexey Gurevich, Vladislav Saveliev, Nikolay Vyahhi, and Glenn Tesler. QUAST:
quality assessment tool for genome assemblies. Bioinformatics, 29(8):1072–1075, 2013.