Quantifying expression variability in
single-cell RNA sequencing data
Nils Eling
European Molecular Biology Laboratory,
European Bioinformatics Institute
University of Cambridge
This dissertation is submitted for the degree of
Doctor of Philosophy
Ich widme diese Arbeit meiner Familie - Hildegard, Jörg und Laura - und bedanke mich für eure Unterstützung und Geduld während meiner Promotion.
D
ECLARATION
This dissertation is my own work and contains nothing which is the outcome of work done in collaboration with others, except as specified in the individual declarations at the beginning of each chapter. To further indicate the parts of the thesis for which I used data of others or for which others were involved in interpreting the results, I use the pronoun "we". For the parts of my thesis that are purely my own work, I use the pronoun "I".
It is not substantially the same as any that I have submitted, or, is being concurrently submitted for a degree or diploma or other qualification at the University of Cambridge or any other University or similar institution. I further state that no substantial part of my dissertation has already been submitted, or, is being concurrently submitted for any such degree, diploma or other qualification at the University of Cambridge or any other University or similar institution. This dissertation contains fewer than 60,000 words exclusive of tables, footnotes, bibliography, and appendices and has fewer than 150 figures.
Nils Eling August 2018
A
CKNOWLEDGEMENTS
First and foremost, I want to thank my supervisor John Marioni for offering me to work in his research group. John took the risk in supervising me as a PhD student from a wet-lab background and introduced me to statistical analyses. I’m thankful for all his enthusiasm and support which guided me to successfully finishing my PhD in the most enjoyable way. I also want to thank Catalina Vallejos for supervising me and turning me into a "Bayesian statistician". Not only did she support my work but also became a close friend.
This work builds on excellent collaborations. I want to thank Duncan Odom not only for allowing me to collaborate with his lab but also for guiding me through important career-related processes (e.g. paper writing). Christina Ernst supported large parts of this work with experiments, data interpretation and late nights of editing. I also want to thank Celia Martinez-Jimenez for large-scale experimental support and data interpretation which led to a successful publication. Maike de la Roche and Hung-Chang Chen also played a crucial role for publishing the final version of this paper. Furthermore, I thank Detlev Arendt and Kaia Achim for collaborating on an early project during my PhD. My thesis advisory com-mittee members, Sarah Teichmann, Wolfgang Huber and Duncan Odom provided fruitful discussions that advanced my research over the last four years. I also thank the EMBL PhD programme for funding my research and the EMBL-European Bioinformatics Institute as well as the CRUK-Cambridge Institute for offering such a friendly work place.
All current and former lab members of the Marioni lab deserve a huge thanks for providing such a pleasant and stimulating work environment. I specifically thank: Aaron Lun for his statistical support, entertainment and being a BK lunch companion; Michael Morgan for discussing what "noise" really means; Arianne Richard for biological insights into the confusing world of T cells. I also thank Anna, Chris, Luis, Antonio, Konrad, Catalina, Liora, Jonny, Tom, Ximena, Christina, and Rebecca for all the fun times during the last four years. A special thanks also goes to everyone who read and commented on this thesis: Christina Ernst, Jack Monahan, Hannah Meyer, Michael Morgan, Catalina Vallejos, and John Marioni. I thank my examiners Chris Wallace and Ben Lehner for a truly enjoyable viva and the valuable discussions, which improved the presentation of this thesis.
you for distracting me with pizza and comedy nights, endless trips to the Blue Moon and for being a good friend. Hannah, Jack, Christina, Catalina, Dani, Lara, Julia, it was always fun going to formals, punting or trying to discover as many pubs in Cambridge as possible. Sebastian and Ruben, thank you for listening to my complaints and helping me whenever needed, and together with Jonathan, Felix, Georg, Fabian for years of friendship, and for the most exhausting but fun "Alumni Wochenenden".
I also want to thank Nico, Fabian, Josh, Martin, Marc, Alex, and Mike for always welcoming me back home. Even though this only happens few times per year, I truly value your friend-ship.
The Pembroke College Boat Club helped me to find a balance between sports and work and even during high-intensity phases I fully enjoyed the early mornings and the distraction that rowing offered.
Finally, I want to thank Bodi for her constant support and patience during the last four years. Our adventures, Skypes, holidays and weekends together gave me the energy to focus on my work.
A
BSTRACT
Transcriptional noise is an intrinsic feature of cell populations and plays a driving role in mammalian development, tissue homoeostasis and immune function. While expression heterogeneity, a phenotypic readout of transcriptional noise, has been broadly studied in prokaryotic model systems or by profiling individual genes, few whole-transcriptome studies in mammalian systems have been reported. The development of single-cell RNA sequencing technologies introduced powerful tools to investigate transcriptional differences between individual cells, therefore allowing the in-depth characterisation of expression variability. In this thesis, I computationally analysed single-cell RNA sequencing data to understand transcriptional variability and expanded a statistical model to avoid confounding effects when quantifying such variability. First, I profiled individual transcriptomes of CD4+T cells, iden-tifying a global decrease in transcriptional variability upon immune activation. By extending this analysis across two sub-species of mice, I identified an evolutionarily conserved set of immune response genes for which transcriptional variability increases during ageing. I used a Bayesian modelling framework to quantify mean expression and transcriptional variability but due to a strong confounding effect between these two parameters, variability analysis was restricted to genes that are similarly expressed across the tested conditions. To address this problem, I extended the computational framework allowing the parallel assessment of changes in mean expression and variability. Within this Bayesian framework, I introduced a joint prior linking mean expression and variability parameters, which allowed a residual over-dispersion to be measured for each gene. This measure allowed me to statistically assess changes in variability even for genes with differences in mean expression between conditions. Finally, I applied the model to identify temporal changes in variability over the time-course of spermatogenesis. This unidirectional differentiation process involves several complex steps before mature sperm form from spermatogonial stem cells. When profiling changes in variability across this developmental time-course, peaks in variability are caused by rapid changes in gene expression along the differentiation trajectory. This thesis provides a deeper understanding of technical and biological factors that drive transcriptional variability and offers a basis for future research to characterise its role in health and disease.
T
ABLE OF CONTENTS
List of figures xvii
List of tables xix
Acronyms xix
1 Introduction 1
1.1 Biology of expression noise . . . 2
1.1.1 Bet-hedging in unicellular systems . . . 3
1.1.2 Development and differentiation . . . 5
1.1.3 Stochasticity in immune responses . . . 7
1.1.4 Tissue development and homeostasis . . . 8
1.1.5 Evolution . . . 10
1.1.6 Cancer . . . 11
1.1.7 Ageing . . . 12
1.2 Sources of expression noise . . . 14
1.2.1 Intrinsic noise . . . 14
1.2.2 Extrinsic noise . . . 24
1.3 Quantification of molecular variability . . . 27
1.3.1 Single-cell sequencing . . . 27
1.3.2 Imaging approaches . . . 35
1.3.3 Computational modelling and quantification . . . 36
1.4 General applications of scRNA-Seq in biology . . . 40
1.4.1 Atlas-type approaches . . . 40
1.4.2 Developmental biology . . . 41
1.4.3 Cell type evolution . . . 43
1.4.4 Immunology . . . 44
1.4.5 Tissue function and disease . . . 46
1.5 Bayesian approaches to model scRNA-Seq data . . . 48
1.5.1 The basics of Bayesian inference . . . 48
1.5.2 Prior distributions . . . 49
1.5.4 Variational Bayes . . . 52
1.5.5 Bayesian decision theory . . . 53
1.5.6 Modelling scRNA-Seq data . . . 54
1.5.7 BASiCS: Bayesian Inference of Single-Cell Sequencing data . . . . 55
1.6 Outline . . . 59
1.7 Other contributions . . . 60
2 Ageing increases transcriptional noise in CD4+ T cell activation 61 2.1 Introduction . . . 63
2.2 Single-cell RNA sequencing of murine CD4+T cells . . . 65
2.2.1 Experimental strategy . . . 66
2.2.2 Computational strategy . . . 67
2.2.3 Characterisation of isolated CD4+T cells . . . 71
2.3 Species-specific gene expression in naive CD4+T cells . . . 75
2.3.1 Avoiding transcript counting biases due to incorrect alignment . . . 75
2.3.2 Transcriptional dynamics of species-specific genes . . . 76
2.4 Expression dynamics during CD4+T cell activation . . . 78
2.4.1 Mean expression changes during immune activation . . . 78
2.4.2 Changes of expression variability during immune activation . . . . 80
2.4.3 Response-related transcriptional dynamics in CAST . . . 82
2.5 Conservation of the core activation process . . . 83
2.5.1 Detecting evolutionarily conserved response genes . . . 83
2.5.2 Functional assessment of the conserved response genes . . . 85
2.6 Destabilisation of CD4+T cell activation during ageing . . . 86
2.6.1 Ageing does not effect CD4+T cell transcription on a global level . 86 2.6.2 Ageing increases transcriptional variability in response genes . . . . 88
2.6.3 Validation experiments to confirm changes in variability . . . 90
2.6.4 Transcriptional variability in CD4+T cell subsets . . . 92
2.7 Discussion . . . 94
3 Addressing the mean-variability dependency in scRNA-Seq data 97 3.1 Introduction . . . 99
3.2 Extending the BASiCS model . . . 101
3.2.1 The BASiCS model . . . 101
3.2.2 Approaches to correct the mean-variability confounding effect . . . 102
3.2.3 Modelling the confounding between mean and over-dispersion . . . 104
Table of contents xiii
3.2.5 Probabilistic rule associated to the differential test . . . 109
3.2.6 Choice of hyper-parameters . . . 111
3.3 Pre-processing of scRNA-Seq data used in this chapter . . . 114
3.3.1 Dictyosteliumcells . . . 115
3.3.2 Mouse brain cells . . . 115
3.3.3 Pool-and-split RNAseq data . . . 115
3.3.4 CD4+T cell activation . . . 116
3.3.5 CD4+T cell differentiation . . . 116
3.4 The informative prior stabilises parameter estimation . . . 117
3.4.1 Dataset specificity of the regression trend . . . 117
3.4.2 Stabilisation of posterior inference . . . 119
3.4.3 Validation of gene-specific posterior estimates by smFISH . . . 121
3.5 Expression variability during immune responses . . . 122
3.5.1 Testing variability changes upon immune activation . . . 122
3.5.2 Expression dynamics duringin vivoCD4+T cell differentiation . . 127
3.6 Application to droplet-based scRNA-Seq data . . . 131
3.6.1 Differential testing using somitic and pre-somitic mesoderm cells . 132 3.7 Discussion . . . 136
4 Transcriptional dynamics during spermatogenesis at single-cell resolution 139 4.1 Introduction . . . 141
4.2 Data generation and processing strategies . . . 144
4.2.1 scRNA-Seq using the 10X Genomics™ system . . . 144
4.2.2 Bulk RNA-Seq from juvenile animals . . . 146
4.2.3 CUT&RUN from juvenile animals . . . 147
4.2.4 Identification of germ cell types across all scRNA-Seq samples . . . 148
4.3 Developmental staging of mouse spermatogenesis . . . 150
4.3.1 Cell type characterisation using the first wave of spermatogenesis . 150 4.3.2 Classification of cell types based on bulk RNA-Seq data . . . 153
4.4 Under-represented cell types in spermatogenesis . . . 154
4.4.1 Somatic cell types in juvenile testes . . . 154
4.4.2 Spermatogonial differentiation . . . 156
4.4.3 Leptotene and zygotene spermatocytes . . . 158
4.5 Characterisation of male meiosis . . . 160
4.6 Transcriptional dynamics during spermiogenesis . . . 163
4.6.1 Expression of chromatin components during spermiogenesis . . . . 163
4.7 Meiotic silencing dynamics of sex chromosomes . . . 167
4.8 Epigenetic mechanisms of X chromosome reactivation . . . 170
4.8.1 CUT&RUN to profile H3K4me3 and H3K9me3 marks . . . 170
4.8.2 Targeted silencing of spermatid-specific escape genes . . . 172
4.9 Measuring changes in variability over pseudo-time . . . 174
4.9.1 Using BASiCS on continuous data . . . 174
4.9.2 Finding continuous changes in variability by linear model fitting . . 177
4.9.3 Clustering of variability profiles . . . 179
4.10 Discussion . . . 181
5 Conclusion and future directions 183 5.1 Technologies to study the biological role of noise . . . 184
5.2 Confounding effects when measuring noise . . . 186
5.2.1 Experimental confounding factors . . . 186
5.2.2 Technical confounding factors . . . 187
5.3 Experimental validation and manipulation of noise . . . 188
5.3.1 General perturbation of transcriptional noise . . . 188
5.3.2 Targeted perturbation of transcriptional noise . . . 189
5.4 Future approaches to model scRNA-Seq data . . . 190
References 193 Appendix A Experimental methods 237 A.1 Ageing increases transcriptional noise in CD4+T cell activation . . . 237
A.1.1 Mouse material . . . 237
A.1.2 CD4+T cell isolation . . . 237
A.1.3 Flow cytometry . . . 238
A.1.4 ScRNA-Seq library preparation and sequencing . . . 239
A.2 Transcriptional dynamics during spermatogenesis at single-cell resolution . . . 240
A.2.1 Mouse material . . . 240
A.2.2 FACS of spermatogenic cell populations . . . 240
A.2.3 Total RNA-Seq from bulk samples . . . 240
A.2.4 10X Genomics single-cell RNA-Seq . . . 241
A.2.5 Histology . . . 241
Table of contents xv
Appendix B Computational methods 245
B.1 Addressing the mean confounding effect
for differential variability testing . . . 245
B.1.1 Prior specifications of the extended BASiCS model . . . 245
B.1.2 Starting values for hyper-parameters . . . 246
B.1.3 Likelihood of the extended BASiCS model . . . 246
L
IST OF FIGURES
1.1 Bet-hedging strategy of theλ-phage . . . 4
1.2 Progression of transcriptional heterogeneity during embryonic development 6 1.3 Early responders are important for homogeneous immune activation . . . . 8
1.4 Buffering of noise in the colonic crypt . . . 9
1.5 Heterogeneous cell states and cell responses in cancer development . . . 12
1.6 Regulatory features that modulate expression noise . . . 14
1.7 Features of the DNA sequence induce expression noise . . . 16
1.8 RNAPII pausing reduces transcriptional noise . . . 21
1.9 Post-transcriptional regulation to control noisy expression . . . 22
1.10 Differences in cell states induce extrinsic noise . . . 24
1.11 Physical constraints induce heterogeneous expression patterns. . . 26
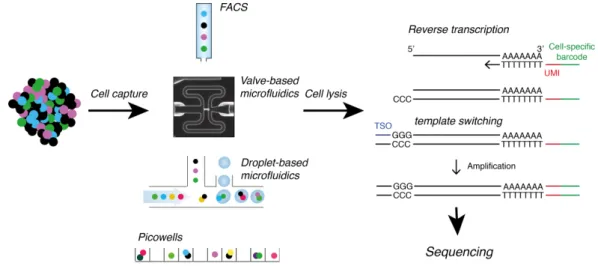
1.12 ScDNA-Seq allows detection of SNVs and CNVs between individual cells . 28 1.13 Workflow for scRNA-Seq technologies . . . 30
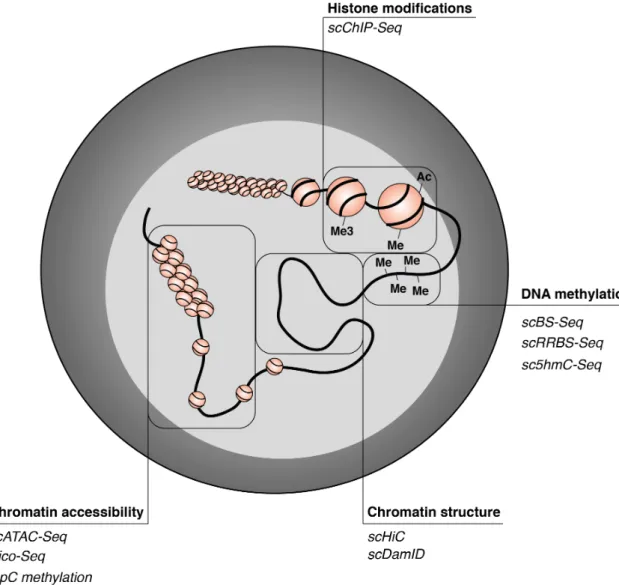
1.14 Single-cell epigenomics to study chromatin structure and modifications . . . 33
1.15 Single-cell multi-omic approaches . . . 35
1.16 MERFISH-type spatial transcriptomics . . . 36
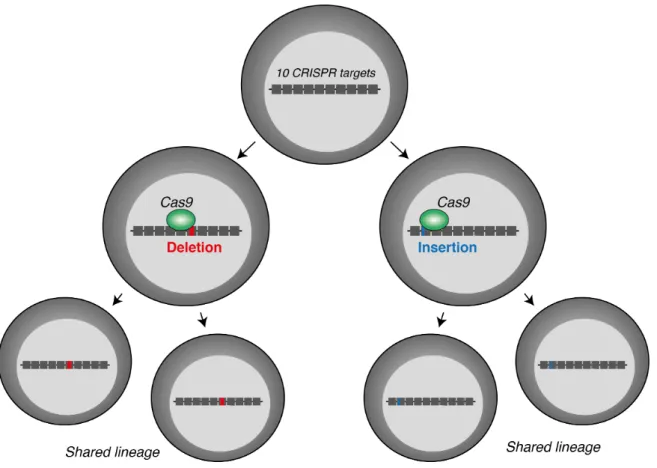
1.17 CRISPR/Cas9-scarring for lineage tracing . . . 43
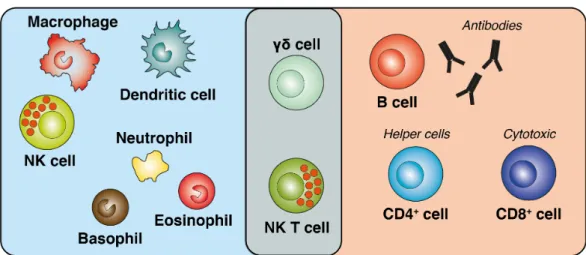
1.18 Cell types of the adaptive and innate immune system . . . 44
1.19 The BASiCS model . . . 56
2.1 scRNA-Seq of CD4+T cells from young and old mice. . . 65
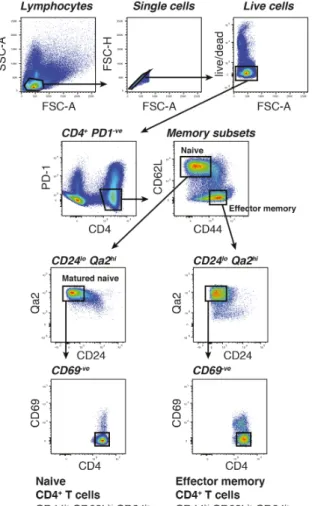
2.2 FACS of naive and effector memory CD4+T cells . . . 66
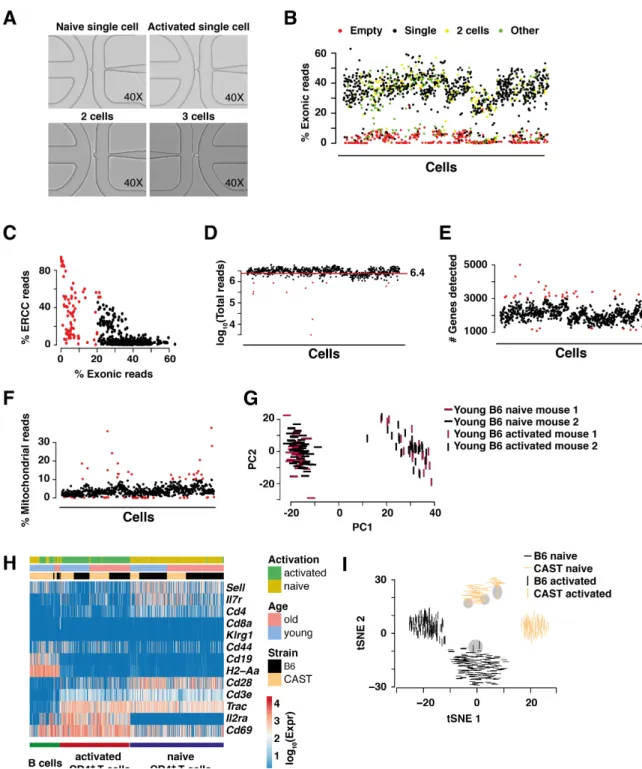
2.3 Quality control of isolated CD4+T cells . . . 69
2.4 Characterisation of isolated CD4+T cells . . . 72
2.5 Visualisation of all isolated CD4+T cells . . . 74
2.6 Cross-mapping correction between divergent mouse species . . . 75
2.7 Species-specific gene expression in naive CD4+T cells . . . 77
2.8 Mean expression dynamics upon CD4+T cell activation . . . 79
2.9 Changes in transcriptional variability upon immune activation . . . 81
2.10 Immune activation dynamics in young CAST animals . . . 82
2.12 Global immune response during ageing . . . 87
2.13 Ageing destabilises the CD4+T cell response . . . 89
2.14 Experimental validation of increased transcriptional variability during ageing 91 2.15 Increased expression variability during ageing in different CD4+T cell subsets 93 3.1 Addressing the mean confounding effect in scRNA-Seq data . . . 103
3.2 EFDR, FPR and TPR estimation using simulated data . . . 110
3.3 Effect of regression hyper-parameters on trend fitting . . . 112
3.4 Comparison of model fits for varying degrees of freedom . . . 113
3.5 Parameter estimation using a variety of scRNA-Seq datasets . . . 118
3.6 Estimation of gene-specific model parameters for varying sample sizes . . . 120
3.7 Stability of posterior estimates for gene-specific parameters . . . 121
3.8 Differential testing results of the two BASiCS models . . . 123
3.9 Changes in expression patterns during early immune activation . . . 125
3.10 Dissecting changes in variability driven by expression outliers . . . 126
3.11 Dynamics of expression variability throughout CD4+T cell differentiation . 128 3.12 Differential regulation of lineage-associated genes across differentiation . . 130
3.13 Quantification of expression dynamics from droplet-based scRNA-Seq data 133 4.1 Staging of the testicular seminiferous epithelium . . . 142
4.2 Experimental design to dissect mouse spermatogenesis . . . 144
4.3 Droplet based scRNA-Seq of juvenile and adult mouse spermatogenesis . . 149
4.4 Staging of cell types during mouse spermatogenesis . . . 151
4.5 Enrichment of under-represented somatic cell types in juvenile samples . . 155
4.6 Cellular heterogeneity during spermatogonial differentiation . . . 157
4.7 Transcriptionally silent cell types in spermatogenesis . . . 159
4.8 Gene expression dynamics during male meiosis . . . 162
4.9 Transcriptional dynamics and chromatin remodelling during spermiogenesis 164 4.10 Transcriptional shut-down during spermiogenesis . . . 166
4.11 X chromosome dynamics during spermatogenesis . . . 169
4.12 Chromatin profiling in spermatocytes and spermatids . . . 171
4.13 Targeted repression of spermatid-specifc escape genes in spermatocytes . . 173
4.14 Detecting changes in variability over pseudo-time . . . 176
4.15 Linear changes in variability over spermiogenesis . . . 178
4.16 Clustering of variability profiles . . . 180
L
IST OF TABLES
1.1 Positive and negative effects of biological noise on cellular systems. . . 13
1.2 Epigenetic control of transcriptional noise . . . 20
1.3 Conjugate prior distributions for common likelihood functions . . . 49
3.1 Datasets used for model testing and analysis. . . 114
A
CRONYMS
Ccl4 chemokine (C-C motif) ligand 4
Eif1 eukaryotic translation initiation factor 1
Fasl Fas ligand
H2-Aa H-2 class II histocompatibility antigen
Il2ra interleukin 2 receptor alpha
PHO5 repressible acid phosphatase
Sir sirtuin
TDH3 glyceraldehyde-3-phosphate dehydrogenase 3
2i 2 inhibitor
A type A spermatogonia
a2i alternative 2 inhibitor
Akap4 A-kinase anchoring protein 4
A. queenslandica Amphimedon queenslandica
AML acute myeloid leukemia
B. subtilis Bacillus subtilis
B type B spermatogonia
B6 Mus musculus domesticus
BASiCS Bayesian Inference of Single-Cell Sequencing data
BCR B cell receptor
CA Cornu Ammonis
Cabs1 calcium binding protein, spermatid associated 1
Carm1 coactivator associated arginine methyltransferase 1
Cas9 CRISPR-associated protein 9
CAST Mus musculus castaneus
CAVI coordinate ascent mean-field variational inference
cDNA complementary DNA
CGI CpG islands
CNV copy number variation
CpG 5’-cytosine–phosphate–guanine-3’
CPM counts per million
CRISPR clustered regularly interspaced short palindromic repeats
CTCF CCCTC-binding factor
CUT&RUN cleavage under targets & release using nuclease
CV2 squared coefficient of variation
Cxcr5 C-X-C chemokine receptor type 5
Cypt1 cysteine-rich perinuclear theca 1
CyTOF cytometry by time-of-flight
DamID DNA adenine methyltransferase identification
DC dendritic cells
Dmrt2 doublesex and mab-3 related transcription factor 2
D. melanogaster Drosophila melanogaster DR-Seq DNA and mRNA sequencing
DroNc-Seq massively parallel single-nuclei sequencing with droplet technology
DS diplotene spermatocyte
DSB double strand breaks
E. coli Escherichia coli
E embryonic day
EC endothelial cell
EFDR expected false discovery rate
Acronyms xxiii
EM effector memory
ERCC External RNA Control Consortium
ERK extracellular signal–regulated kinase
FACS fluorescence-activated cell sorting
Fgf fibroblast growth factor
FPKM fragments per kilobase per million mapped reads
FPR false positive rate
FSC forward scatter
G&T-Seq genome and transcriptome sequencing
GABA gamma-aminobutyric acid
Gata GATA binding protein
gDNA genomic DNA
GEM gel beads in emulsions
GESTALT genome editing of synthetic target arrays for lineage tracing
GO gene ontology
GRBF Gaussian radial basis function
GRCm38 Genome Reference Consortium mouse build 38
H2afx H2A histone family member X
H3K27me3 tri-methylation of lysine 27 of histone H3
H3K36me3 tri-methylation of lysine 36 of histone H3
H3K4me1 mono-methylation of lysine 4 of histone H3
H3K4me2 di-methylation of lysine 4 of histone H3
H3K4me3 tri-methylation of lysine 4 of histone H3
H3K9ac acetylation of lysine 9 of histone H3
H3K9me3 tri-methylation of lysine 9 of histone H3
H3R26 histone H3 arginine-26
H4K16ac acetylation of lysine 16 of histone H3
H4K20me3 tri-methylation of lysine 20 of histone H3
HiC high-troughput chromosome confirmation capture
ICM inner cell mass
IFC integrated fluidic circuit
Ifn interferon
Ikzf4 IKAROS Family Zinc Finger 4
IL immature Leydig
Il interleukin
Il7r interleukin 7 receptor
ILC innate lymphoid cell
In intermediate spermatogonia
IP immunoprecipitation
iPSC induced pluripotent stem cell
IVT in vitrotranscription
KL Kullback-Leibler divergence
Klrg1 killer cell lectin-like receptor subfamily G member 1
LIF leukemia inhibitory factor
log2FC log2fold change
LPS lipopolysaccharide
LS leptotene spermatocyte
M metaphase I and II
m6A N6-methylation of adenosine
MACS magnetic-activated cell sorting
MALBAC multiple annealing and looping-based amplification cycles
MARS-Seq massively parallel RNA single-cell sequencing
MCMC Markov Chain Monte Carlo
MDA multiple displacement amplification
Meox2 mesenchyme homeobox 2
MERFISH multiplexed error-robust fluorescencein situhybridization
mESC mouse embryonic stem cell
Acronyms xxv
miRNA micro RNA
MLP multilayer perceptron
M. leidyi Mnemiopsis leidyi
mRNA messenger RNA
MSCI meiotic sex chromosome inactivation
MTase methyltransferase
NB negative binomial
N. vectensis Nematostella vectensis
NF-κB nuclear factor kappa-light-chain-enhancer of activated B cells
NFAT nuclear factor of activated T cells
NK natural killer
Nr nuclear receptor
P post-natal
PBMC peripheral blood mononuclear cell
PCA principal component analysis
PCR polymerase chain reaction
PD-1 programmed cell death protein 1
PD-L1 programmed death-ligand 1
pgt pseudoground truth
P. dumerilii Platynereis dumerilii
Pl preleptotene spermatocyte
PRC polycomb repressive complex
Prm protamine PS pachytene spermatocyte PSM pre-somitic mesoderm PTM peritubular myoid QC quality control qPCR quantitative PCR RA retinoic acid
Rnf8 ring finger protein 8
RNAPII RNA polymerase II
rRNA ribosomal RNA
RT reverse transcription
RT-PCR real time PCR
RTase reverse transcriptase
RTE recent thymic emigrant
S speramtid
SC spermatocyte
Scml2 sex comb on midleg-like 2
sc5hmC-Seq single-cell 5-hydroxymethylcytosine sequencing
scATAC-Seq single-cell assay of transposase-accessible chromatin using sequencing
scBS-Seq single cell bisulfite sequencing
scChIP-Seq single-cell chromatin IP followed by sequencing
scDNA-Seq single-cell whole genome sequencing
sci-Seq single-cell combinatorial indexed sequencing
scLVM single-cell latent variable model
scM&T-Seq single-cell methylome and transcriptome sequencing
SCOMP single-cell comparative genomic hybridization protocol
scRNA-Seq single-cell RNA sequencing
scRRBS-Seq single-cell reduced representation bisulfite sequencing
scVI single-cell variational inference
SG spermatogonia
sgRNA single guide RNA
siRNA small interfering RNA
SM somitic mesoderm
smFISH single molecule fluorescencein situhybridization
SNN shared nearest-neighbour
SNV single nucleotide variant
SP single positive
SPLiT-Seq split-pool ligation-based transcriptome sequencing
Acronyms xxvii
SSC side scatter
Stra8 stimulated by retinoic acid 8
STORM stochastic optical reconstruction microscopy
STRT single-cell tagged reverse transcription
Tbx21 T-box 21
TCR T cell receptor
TF transcription factor
TFBS transcription factor binding site
Tfh T follicular helper
Tgf transforming growth factor
Th T-helper
Tigit T cell immunoreceptor with Ig And ITIM domains
tMg testicular macrophage
Tnf tumour necrosis factor
Tnp transition protein
TPE-OLD telomere position-effect on long distance
TPR true positive rate
T. adhaerens Trichoplax adhaerens
TRAIL TNF-related apoptosis-inducing ligand
Treg regulatory T cell
Tsga8 testis specific gene A8
tSNE t-distributed stochastic neighbour embedding
TSO template-switch oligo
TSS transcriptional start site
Tyk2 tyrosine kinase 2
UMI unique molecular identifier
WGA whole genome amplification
Zfy zinc finger protein Y-linked
ZIFA zero-inflated factor analysis
ZINB zero-inflated negative binomial
1
Introduction
The intrinsic stochasticity of biochemical reactions introduces phenotypic heterogeneity in seem-ingly homogeneous populations of cells. This phenomenon has been widely studied in prokaryotic and eukaryotic systems and the functional role of phenotypic variation in development, health and disease is the subject of ongoing research. Biological noise, defined as stochasticity in biochemical reactions within individual cells, contributes to form molecular phenotypic variability in cell populations. Intrinsic noise summarises stochastic differences in transcription and translation between individual genes [1–3]. Extrinsic noise on the other hand arises due to fluctuations in cellular states (e.g. cell cycle, cell-to-cell signalling and metabolism) [4–6]. Recent technological advances allow the in-depth analysis of molecular phenotypic variability as proxy for biological noise in cell populations. Imaging methodologies [7] and single-cell “omics” techniques [8] permit the quantification of thousands of mRNA species, the genomic sequence, its epigenetic modification, and selected sets of proteins per cell. Moreover, the development of multi-omics technologies introduced the possibility to link cell-to-cell variation between multiple regulatory layers across individual cells [9]. With the emergence of single-cell RNA sequencing (scRNA-Seq) technologies, new computational strategies to quantify variability were introduced [10–15]. Applying high-throughput scRNA-Seq to mammalian systems characterised the functional role of molecular variability in healthy as well as diseased contexts. Recent studies have described changes in transcriptional variability at different stages during embryonic development, which hints at stochastic contributions to early cell fate decisions [16–18]. On the one hand, phenotypic variation in immune cells, potentially driven by transcriptional noise, increases cellular plasticity and facilitates the population response to pathogens [19, 20]. On the other hand, genetic and non-genetic heterogeneity within cell populations was described as driver for cancer development [21] and disrupts immune responses in aged animals [22]. Here, I introduce noise as an inherent feature of biological system and discuss its positive and negative consequences in cell populations. Furthermore, I outline recent developments of single-cell sequencing and imaging technologies and comment on robust approaches for quantifying molecular phenotypic variability. Finally, I will summarise Bayesian inference as a powerful statistical framework to model transcriptional
1.1
Biology of expression noise
The intrinsic stochasticity of biochemical reactions contributes to a wide distribution of messenger RNAs (mRNAs) and proteins across a seemingly homogeneous populations of cells [1]. In the scientific litearature, this phenomenon is often referred to as “biological noise” (seeBox 1). All cellular systems are exposed to varying levels of noise and employ strategies to make use of or cope with this source of variation. The sources and consequences of biological noise have been studied in an array of viral, prokaryotic and eukaryotic systems [23–25]. Across these systems the extent of its function remains unclear.
Box 1: Defining biological noise
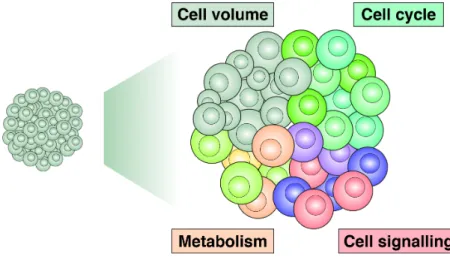
Biological noise in cell populations is defined as stochastic effects on transcription and translation that propagates to form cell-to-cell phenotypic differences. To understand noise, one needs to distinguish between different sources of cell-to-cell variability in multiple measurable factors. On the broadest level, differences between single cells in a population can arise from structured and unstructured sources. When capturing cell populations that contain discrete cell states and/or cell types [26–28], measuring cell-specific features results in the detection of non-stochastic but rather correlated (structured) differences between individual cells. When the cell population structure is not driven by correlated features (unstructured variation), continuous processes (e.g. differen-tiation) can be the dominating source of cell-to-cell phenotypic variability [29]. Computational approaches allow the detection of these trajectories (e.g. via principal component analysis (PCA) or pseudotime inference [30, 31]). Therefore, my work and work of others [32, 33] focus on studying "molecular phenotypic variability", independent of measurement errors, in homogeneous cell populations as proxy for biological noise.
Classically and specifically in populations of bacteria [1], biological noise has broadly been classified into intrinsic and extrinsic noise. Intrinsic noise originates from stochastic biochemical effects that directly influence mRNA and protein expression gene-specifically (e.g. transcription factor (TF) binding dynamics, see [34]). Extrinsic noise on the other hand introduces co-variation across multiple genes (also in a pathway specific manner [35]) due to variations in cell-specific factors such as stress response, mitochondrial maintenance, amino-acid synthesis [36] or cell cycle [4]. Within a population of bacteria, intrinsic noise can therefore be measured as expression differences between regulated genes in one cell, while extrinsic noise is measured as co-regulated variance in gene sets across all cells. In multicellular systems however, the observed molecular phenotypic variability is a combination of stochastic (noise) and deterministic effects, which are difficult to delineate.
1.1 Biology of expression noise 3
When discussing the role of noise in biological systems, it is crucial to differentiate between unicellular systems (prokaryotes, viruses, and yeast) and higher, multicellular eukaryotic sys-tems that show complex signalling events. Furthermore, measuring the stochastic component of biological noise is difficult and requires time-resolved reporter gene read-outs in truly ho-mogeneous cell populations [1]. Due to this, the majority of studies presented in this chapter use the observable molecular phenotypic variation in form of single-cell transcriptomic or proteomic read-outs as proxy for biological noise (seeBox 1). This variation is confounded by unobserved deterministic processes (e.g subtle cell-cycle variation) and delineating the stochastic and deterministic component is challenging.
1.1.1
Bet-hedging in unicellular systems
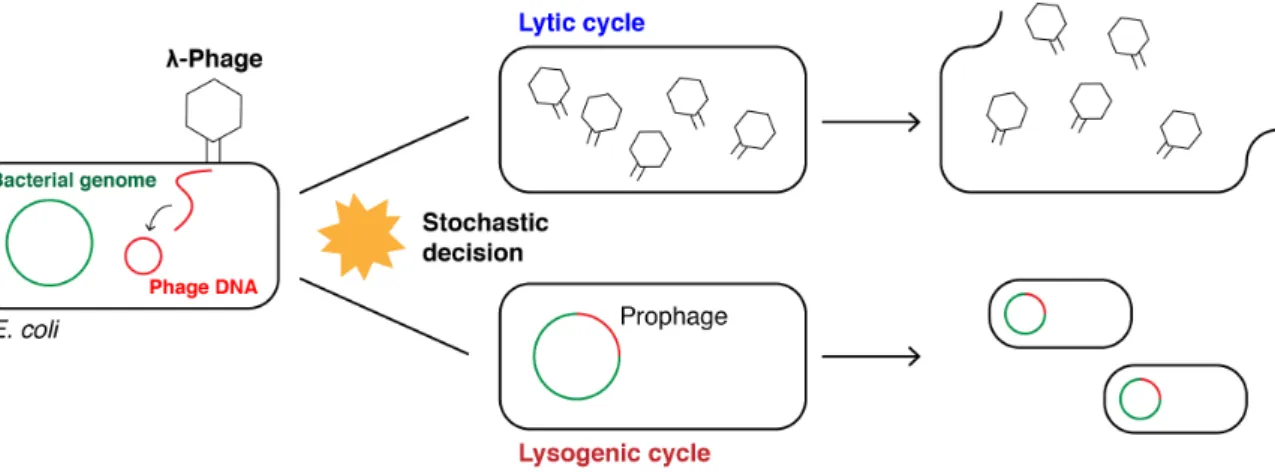
Biological noise has been proposed to trigger the differential decision between latency and replication in viruses such as human immunodeficiency virus (HIV) and theλ-phage. In
the case of theλ-phage, infected cells either reside in a lysogenic state where the genetic
material of the virus is transmitted to daughter cells without inducing cell death, or a lytic state where the virus destroys the host cell (Fig. 1.1) [37]. Previous studies have shown that the lysis-lysogeny switch inλ-phage is driven by intrinsic and extrinsic noise [38, 39].
This idea has been extended by Zeng el al., 2010 where the lysis-lysogeny switch does not depend on a single noise-driven decision but on the sum of all individual phages per cell [40]. In general, by summing across stochastic events or if the lysis-lysogeny decision can be predicted based on cellular volume, the switch does not occur as stochastically as initially anticipated. In the case of HIV, the virus either rapidly replicates or resides in a long-lived latent state from which the virus can switch to replication [41]. It has been shown that combining noise-enhancing and activating drugs shifts latent viruses into the active-replication state that can be targeted by anti-retroviral therapeutics [42]. Independent of the stochastic contribution to the latency-replication switch, this study present one of the first approaches to modulate phenotypic variability of a biological system to enhance therapeutic efficiency.
In unicellular organisms, biological noise has been linked to ‘bet-hedging’ strategies, where a sub-optimal fitness landscape is tolerated across a population of cells in order to facilitate an effective response to environmental changes. Here, phenotypic heterogeneity facilitates the commitment to alternative cell states in cases of stress (e.g. nutrient deprivation, temperature fluctuations). For example, Bacillus subtilis(B. subtilis) either commits to sporulation or competence upon starvation or DNA damage. Sporulation describes an irreversible process during which vegetative growth ends and the cell forms endospores that survive the altered
environment. Competent bacteria on the other hand take up DNA from endospores to repair DNA damage [43]. The probabilistic and transient activation of competence in a sub-population ofB. subtiliscells is modulated by fluctuations in the competence regulators ComK and ComS. An excitable system of negative and positive feedback loops controls the number of cells that reversibly commit to competence while other cells irreversibly execute sporulation [44]. Variations in the process of transferring phoshporyl groups across a cascade of regulators maintains a constant probability for cells committing to sporulation under nutrient deprived conditions [45]. A similar phenomenon is observed inEscherichia coli(E. coli) populations exposed to antibiotics where pre-existing phenotypic heterogeneity allows some cells to resist antibiotic treatment. Once regrown, these cells remain sensitive to the antibiotic [46].
Fig. 1.1: Bet-hedging strategy of theλ-phage.
The linear genome of theλ-phage enters theE. colihost cell and circularises. A stochastic decision is
made to enter the (i) lytic or (ii) lysogenic cycle where (i) theλ-phage genome replicates, theλ-phage particles assemble in the host cell and the cell is destroyed releasing the virions or (ii) theλ-phage
is integrated into the host genome (prophage) and transferred to daughter cells during cell divisions. Under stress conditions, theλ-phage genome is excised from the host genome and enters the lytic cycle.
Similar to phenotypic heterogeneity in unicellular prokaryotes, transcriptional noise facili-tates the switching between mating phenotypes in yeast upon exposure to pheromones [47]. Comparably, commitment to utilising galactose as a nutrient source is a cell fate transition, which is facilitated by stochastic gene expression [48].
In these systems, biological noise introduces variation in mRNA and proteins that increase plasticity for cells to adapt to changeing environments. However, to control and balance the number of cells that commit to a specific fate, noise needs to be buffered, for example, by the regulatory network of feedback loops controlling sporulation and competence.
1.1 Biology of expression noise 5
1.1.2
Development and differentiation
Similar to bet-hedging strategies in unicellular organisms, noise can facilitate the switch between cell states and the probabilistic induction of differentiation processes [25, 49]. However, as mentioned above, measuring biological noise in differentiating multi-cellular organisms is challenging and the observed molecular phenotypic variability is a combination of stochastic and deterministic components. It has been shown that transcriptional variability increases throughout differentiation [50] and development [51]. Dissecting differentiation processes of haematopoietic progenitor cells revealed an increase in transcriptional variability directly before cell fate decisions are made [52, 15]. Once committed, differentiating cell populations collapse in variability and move towards a new attractor state. These studies highlight a possible contribution of molecular variability to cell fate decision event. However, the observed change in variability within differentiating cell populations is purely correlative and it is not possible, with these experiments, to differentiate between variability causing differentiation or differentiation causing variability.
Studies of recent years proposed that stochasticity in expression contributes to early (pre-implantation) embryonic development, and to gastrulation [53]. As early as the 4-cell stage embryo, targets of master pluripotency factors Oct4 and Sox2 are heterogeneously expressed
(Fig. 1.2, left panel). This is caused by heterogeneous methylation patterns of histone H3 arginine-26 (H3R26) induced by coactivator associated arginine methyltransferase 1 (Carm1), which in turn facilitates the binding of Oct4 and Sox2 to induce pluripotency. Cells with unmethylated H3R26 differentiate towards the extra-embryonic trophoectoderm while pluripotent cells form the inner cell mass [16]. Once the cells compact at embryonic day (E) 3.5, cells of the inner cell mass (ICM) stochastically express genes to initiate heterogeneity within the cell population(Fig. 1.2, 2ndpanel). Fgf4 driven signal reinforcement controls this heterogeneity to form a salt-and-pepper like cell state pattern at E3.5. Positional infor-mation and the establishment of gene regulatory networks facilitate the segregation of the epiblast and primitive endoderm lineage at E4.5(Fig. 1.2, 3rdpanel)[18]. In line with this, scRNA-Seq revealed high levels of transcriptional variability in the uncommitted inner cell mass at E3.5 (64-cell stage) in comparison to the E4.5 committed epiblast. Transcriptional variability increases again upon exit from pluripotency in the E6.5 epiblast while cells of the primitive streak at E6.5 synchronise their expression patterns and variability is reduced
(Fig. 1.2, right panel)[17].
Besides the hypothesis of transcriptional variation contributing to embryonic development, a number of alternative drivers for cell fate decisions the mouse embryo exist [54]. For
example, in the 8-cell to 16-cell stage embryo, symmetry breaking could be achieved by an interaction between the cell’s position and polarity, its cortical tension, and the orientation of cell division [54]. Maîtreet al. proposed a system where robust self-organization of 8- to 16-cell stage embryos is achieved by differences in contractility between polar and apolar cells, which leads to the internalization of the more contractile apolar cells [55]. Taken together, it is unclear to which fraction transcriptional variability plays a role in cell fate decision-making and if purely the occurrence of differentiating cells induces transcriptional variation.
Fig. 1.2: Progression of transcriptional noise during embryonic development.
From left to right: schematic of mouse embryonic development from the 4-cell stage to early gastrulation at E6.5. Cell colours indicate gene expression strength. Variable expression at the 4-cell stage induce commitment to form extra-embryonic lineages or pluripotent cells. These pluripotent cells at E3.5 show high expression variability forming the inner cell mass (ICM). Cells rearrange to form the epiblast and primitive endoderm at E4.5 while noise levels increase in the epiblast at E6.5 compared to the primitive streak.
While pluripotent stem cells in the mouse embryo commit irreversibly to cell lineages
during development, in vitro cultured mouse embryonic stem cells (mESCs) reside in a
self-renewing, metastable state [56] and heterogenity within the cell population depends on the growth condition. Transcription factor heterogeneity, especially of the pluripotency regulator Nanog, is highest in leukemia inhibitory factor (LIF)/serum grown cells and allows the Nanog-negative cells to commit to differentiation [57, 58]. Heterogeneously expressed genes that show a bimodal distribution in expression counts correlate with each other in-dicative of the presence of distinct states in mESCs. These distinct states show differences in promoter methylation patterns, introducing the role of epigenetic modifications to main-tain heterogeneity in mESCs [59]. In-depth analysis of mESCs grown in different media
1.1 Biology of expression noise 7
(serum, 2 inhibitor (2i) and alternative 2 inhibitor (a2i)) shows the presence of three dis-tinct cell states in the serum grown cells. mESCs grown in 2i media show less variability in pluripotency markers but higher heterogeneity in cell cycle related genes [12]. From the pluripotent ground state, mESCs can differentiate along somatic lineages via specific differentiation events or noise-induced transitions between attractor states. Mathematical modelling has shown that mESCs differentiate stochastically through distinct hidden cell (micro-)states within a defined (macro-)state coupled to an increase in variability [50]. In contrast to the beneficial features of noise in stem cell differentiation, stochastic events during induced pluripotent stem cell (iPSC) reprogramming limit the formation of single iPSCs [60, 61]. It has been shown that probabilistic events dominate in an early phase of reprogramming while the transcription ofSox2induces a later, more deterministic, phase [62].
These findings indicate an intrinsic heterogeneity of pluripotent cell populations. Extrinsic cues, such as growth medium or signalling networks in the embryo, are needed to control this heterogeneity. However, it is not clear if this seemingly random expression of pluripotent marker genes is truely stochastic or driven by unobserved regulatory mechanisms. Hoppeet al.challenged the idea of lineage choice by stochastic fluctuations of lineage-specific tran-scription factors and highlighted, using time-resolved measurements, that these trantran-scription factors are solely reinforcing lineage choice [63]. Therefore, lineage choice can be initiated by unobserved cues that induce variation in genes expression.
1.1.3
Stochasticity in immune responses
Fast and flexible immune responses are only possible within cell populations that show high plasticity and react to a broad spectrum of stimuli. Stochasticity in cytokine expression can lead to phenotypic variability in the T-helper (Th) cell repertoire and increases the effectiveness to respond upon immune stimuli [64]. For example, fluctuating expression of the lineage defining cytokines interferon (Ifn)γfor Th1 and interleukin (Il) 4 for Th2 in
small populations of cells drive the cell population towards a Th1 or Th2 cell fate while most cells co-express the lineage defining transcription factors GATA binding protein (Gata) 3 and T-box 21 (Tbx21) [65, 66].
Furthermore, Shaleket al., 2014 have shown that upon lipopolysaccharide (LPS) stimulation a small subset of dendritic cells become activated much earlier than the rest of the cell population while expressing Ifnβ. These early responders support the activation of late
responding cells via cell-to-cell communication (paracrine signalling) and self-stimulation via autocrine signalling(Fig. 1.3)[19]. Likewise, a bimodal (digital) expression of Il2 is
detected in Th cells after immunisation where the number of Il2 expressing cells scales with antigen level. Il2 expressing cells support the activation of surrounding cells via paracrine signalling [67]. Similarly, digital activation processes can be observed in the nuclear factor kappa-light-chain-enhancer of activated B cells (NF-κB) signalling pathway. The fraction of
cells that activate this signalling pathway increase with LPS concentration to avoid strong immune activation at low concentrations of a stimulus [68].
Fig. 1.3: Early responders are important for homogeneous immune activation.
Within a population of immune cells (e.g. dendritic cells (DC), Th cells), a sub-population either show higher response strength or induce the production of cytokines such as Il2 or Ifnβ. These early
responders induce activation of surrounding cells via paracrine signalling and self-stimulation via autocrine signalling.
While the plasticity and reactivity of immune cell populations is finely tuned by introducing phenotypic heterogeneity, it is not understood how individual cells commit to each phenotype. In part, stochastic expression introduces molecular phenotypic variability that in turn is tightly controlled by external and internal signalling networks. It will therefore be crucial to study the behaviour of immune cells while incorporating their spatial location which might allow the prediction of each cell’s phenotype [69].
1.1.4
Tissue development and homeostasis
Coping with the influence of biological noise is important for regulated tissue development and homeostasis. An early study showed that in order to minimise the effect of stochasticity in development, plants express heat-shock protein 90 to stabilise regulators of growth and development [70]. Furthermore, redundancy in the Caenorhabditis elegans(C. elegans) intestinal gene regulatory network buffers variability in the down-stream master regulator
elt-2. Once highly connected regulators of this network are removed, phenotypic variation arises from bimodal expression of elt-2 [23]. The cooperation of positive and negative
1.1 Biology of expression noise 9
feedback loops in these highly connected regulatory networks ensure robust expression of key developmental genes [71]. Other models have been proposed in which noise helps to form sharp boundaries between neighbouring domains [72]. Contact based adhesion and repulsion between cells sharpens narrow transition regions by sorting cells within a tissue across small scales. Noise-driven cell state plasticity on the other hand allows cells to switch states and therefore helps narrow a wider transition region [73]. The plasticity to migrate within a population of cells also allow the correction of sensing errors. These errors are induced by either too strong or too weak responses of individual cells to a signalling gradient [74].
Fig. 1.4: Buffering of noise in the colonic crypt.
Each colonic crypt harbours 6-8 stem cells that divide to form stem cells and progenitors cells. Early commitment of progenitor cells to cell fates (e.g. goblet cells or enterocytes) leads to crypt-to-crypt heterogeneity due to commitment noise (left panel). Lateral inhibition within a restricted zone (commitment zone) allows cell fate switching and therefore buffers the crypt-to-crypt heterogeneity (middle panel). Migration of goblet cells after the commitment zone buffers the stochastic occurrence of goblet cell or enteroctye patches within the crypt and allows a constant ratio of 1:3 goblet cells to enterocytes in each crypt (right panel). Adapted from [75].
While the cell division rate within tissues is higher during development, tissue homeostasis is maintained by stochastic events that balance cell division and apoptosis [76]. The effect of noise on maintaining tissue homeostasis has been studied in a diverse set of organs. In fat tissue, a complex system of signalling feedback loops controls protein abundance noise to induce differentiation at a low rate but prevents stochastic de-differentiation [77]. To main-tain coordination in liver function, longer mRNA lifetimes of bursty genes and polyploidy reduce noise in gene expression [78]. Another mechanism to achieve tissue-wide expression
responses involves spatial coordination of stochastically expressing cells in the pituitary gland [79]. Spatially constrained signalling events have also been demonstrated to play a role in maintaining colonic crypt cell type diversity. Per crypt, eight stem cells differentiate into a defined ratio of cell types. To reduce noise in this process, lateral inhibition within a commitment zone reduces the number of differentiated goblet cells and following slower dispersive migration as well as decreased division rates of goblet cells ensures a distinct 1:3 ratio to enterocytes across all crypts(Fig. 1.4)[75].
In sum, phenotypic heterogeneity in tissues can arise from stochastic expression driven by noise. To control for correct tissue responses, signalling networks are in place to modulate this variation. In most studies, individual signalling networks and few molecular read-outs were chosen to understand the variation observed within tissues. However, a combination of multiple regulatory signalling events control cell fate within tissues and disentangling the individual components has not been feasible.
1.1.5
Evolution
As discussed above, biological noise can be beneficial for cell fate commitment but needs to be controlled to allow coordinated expression in cell populations. During evolution, a trade-off between cellular plasticity, the expression responsiveness during environmental changes, and robust expression formed. Natural selection acts on genetically controlled expansions of quantitative phenotypes, which, in part, are derived from biological noise [25]. For example, variable expression of stress response genes allows a cell population to adapt to changing environments [80]. Specifically, the expression of genes controlled by TATA-box containing promoters shows strong divergence between species [81]. To control for robust expression levels once selection becomes stabilising, noise levels are reduced [80, 25, 82]. Lehner, 2008 discussed specifically evolutionary selection to minimise noise in genes that show harmful phenotypic effects upon alteration ("dosage-sensitive genes"). These genes show low expression variability to reduce the probability of altered expression and also lower expression divergence between species [83]. Furthermore, essential genes tend to cluster in the genome in regions with persistent open chromatin to reduce the effect of noise [84]. In line with this, the promoters of core cellular components show a decoupling between expression plasticity and expression variability, which indicates that responsiveness in expression is not a general attribute of high expression variability [85].
1.1 Biology of expression noise 11
In unicellular populations, it has been proposed that the contribution of noise on molecular phenotypic variability evolutionarily increased as a form of rudimentary regulation [86]. As a consequence, phenotypic heterogeneity increases the adaption rate of cell populations to extreme environments [87]. Conversely, in multicellular organisms, collections of cells need to respond in a coordinated manner. It has therefore been proposed that nuclear compartmen-talisation in higher organisms reduces noise by mRNA retention at the nuclear membrane [88, 89].
In most cases, cells in an unperturbed state have been profiled to decipher evolutionary selection acting on variability in gene expression. However, in fluctuating environments where the averaged protein abundance across a cell population is far from the optimum, variability in expression leads to some cells expressing protein levels closer to the optimum. By contrast, in stable environments, noise in gene expression can be deleterious by leading to suboptimal growth conditions for many cells [90, 91]. It is therefore crucial to discuss the fitness effect of changes in molecular variability in the context of fluctuating as well as stable environments.
1.1.6
Cancer
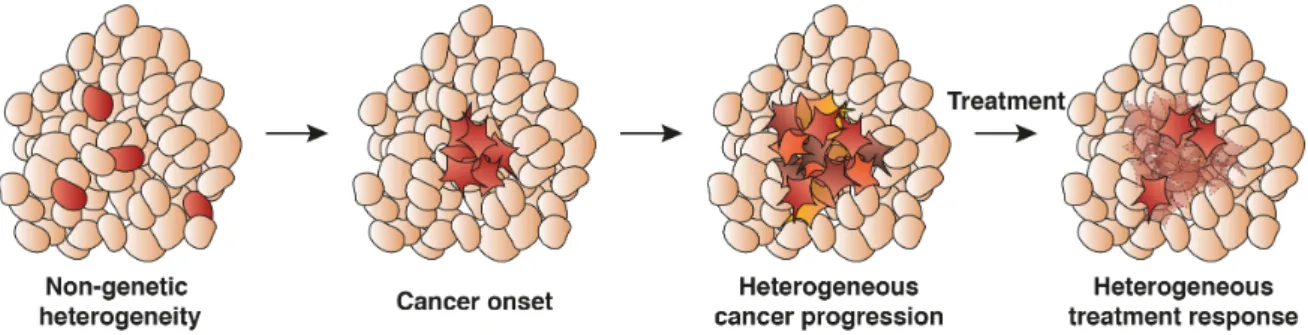
While biological noise can contribute to the adjustment of cells to new microenvironments, errors in the form of gene mutations induce transitions from healthy cells towards a cancer attractor state(Fig. 1.5)[21]. Non-genetic heterogeneity supports the phenotypic adaptation to the new attractor state [92]. The emergence of non-genetic heterogeneity in tumours is coupled to epigenetic dysregulation that allows the survival of cancer cells [93]. Furthermore, it has been proposed that genome wide intra-sample methylation heterogeneity is increased in chronic lymphoitic leukemia increasing cancer cell plasticity in the search for new attractor states [94]. Increased variability in expression can also be observed for more aggressive cancer sub-types across multiple patients [95].
An important consequence of increased phenotypic heterogeneity in cancer cells is the fractional killing of cell populations upon drug treatment (Fig. 1.5) [96]. Variability in proteins mediating TNF-related apoptosis-inducing ligand (TRAIL) induced apoptosis leads to the survival of small fractions of cells [97], which could consequently repopulate the tumour environment. Similarly, the stochastic acquisition of DNA damage upon cisplatin exposure introduces heterogeneity in the up-regulation of p53. Slow up-regulation leads to cell cycle arrest and inhibits apoptosis while only fast up-regulation leads to cell death [98]. In patient derived melanoma cells, sporadic expression of resistance markers forms a rare cell
population that grows into resistant colonies after treatment. While pre-resistant cells do not display epigenetic marks and are therefore close to the non-resistant ground state, treatment induces large epigenetic reprogramming, forming stable resistant cancer colonies [99]. To tackle this problem, combinatorial therapies have been proposed to reduce variability and fractional killing in cancer cell populations [98, 100].
Fig. 1.5: Heterogeneous cell states and cell responses in cancer development.
Stochasticity in expression introduces non-genetic heterogeneity that supports the adaptation of cancerous cells. Cancer progresses to form a collection of cells with divergent expression patterns. This phenotypic heterogeneity leads to fractional killing during treatment and cancer recurrence.
These studies propose a contribution of non-genetic heterogeneity, potentially induced by the loss of noise control, to cancer onset and inefficient treatment response. However, cancer is a heterogeneous disease that develops in a multi-step process involving disregulation in various cellular systems [101]. Therefore, and similar to molecular phenotypic variability in embryonic development, the observed non-genetic heterogeneity can be a phenotypic consequence rather than a driver for cancer onset.
1.1.7
Ageing
Similarly to the onset of cancer, destructive roles of biological noise have been reported during organismal ageing. Previously, it has been debated whether expression noise changes during the lifespan of animals [102, 103]. While these initial studies only used small panels of genes, transcriptional profiling of single cells led to the discovery of a destabilised immune activation programme in CD4+ T cells due to increased expression noise [22]. Similarly, transcriptional noise increases with age in human pancreas coupled to an increased stress signature and atypical hormone expression [104]. For further discussion of age-related effects on transcriptional noise, seeChapter 2.
1.1 Biology of expression noise 13
Table 1.1: Positive and negative effects of biological noise on cellular systems.
System Friend Foe
Unicellular organism Bet-hedging
Development and Probabilistic induction
differentiation of cell differentiation
Immune response Plasticity in immune response
Control of response strength
Tissue development Low cell differentiation rate Non-uniform development
and homeostasis Uncontrolled tissue response
Evolution Adjustment to Non-uniform, stabilising expression
fluctuating environment Uncontrolled tissue responses
Cancer Phenotypic adaption to cancer state
Fractional killing of cancer cells
Ageing Unsynchronised immune response
1.2
Sources of expression noise
Molecular phenotypic variability across homogeneous populations of cells can arise from intrinsic and extrinsic noise, and deterministic components (seeBox 1on page 2). While intrinsic noise is promoter-specific and therefore induces uncoordinated variation in RNA or protein expression between individual genes, extrinsic noise globally influences gene expression across multiple cells and therefore leads to co-variation across larger sets of genes. Here, I give an overview on the different sources of intrinsic and extrinsic noise in a variety of biological systems.
1.2.1
Intrinsic noise
Intrinsic noise in cell populations arises from stochasticity in biochemical reactions that lead to the synthesis of mRNAs (transcription) and proteins (translation) within individual cells. Regulatory features on the genomic, epigenetic, transcriptional and translational level influence and control the strength of intrinsic noise (for an overview seeFig. 1.6).
Fig. 1.6: Regulatory features that modulate expression noise.
Promoter sequence, number of transcription factor (TF) binding sites (TFBS), number of transcrip-tional start sites (TSS), enhancer elements, RNA polymerase II (RNAPII) loading, DNA methylation, nucleosome positioning, histone modifications, polycomb repressive complex binding, micro RNAs (miRNAs), nuclear export of mRNA, ribosome binding and blockage via stem loop formation are features that induce gene-specific intrinsic noise.
1.2 Sources of expression noise 15
DNA features
One of the key regulatory steps prior to RNA synthesis is the binding of TFs to specific DNA sequences within the regulatory region (promoter) of a gene which then triggers the controlled production of primary RNA transcripts from the DNA of this gene [105]. Mutations in the DNA sequence such as single nucleotide variants (SNVs) can alter the binding affinity of TFs and therefore the rate at which a gene is expressed(Fig. 1.7). A systematic study of the glyceraldehyde-3-phosphate dehydrogenase 3 (TDH3) gene expression in yeast found that mutations in known transcription factor binding sites (TFBSs) decrease mean expression and increase expression noise. Moreover, Metzgeret al., 2015 proposed that evolutionary selection removes mutations that increase expression noise and that SNVs with large effects on expression noise show the lowest frequency within sampled yeast strains [106]. However, the authors examined one promoter in stable environmental conditions. How selection on mutations that induce variability in expression works in more complex systems and across multiple promoters is still unexplored.
One of the most widely studied DNA motifs in relation to transcriptional noise is the TATA-box motif in promoters. Generally, TATA-TATA-box containing promoters show high levels of transcriptional noise(Fig. 1.7) [32], possibly due to a simple activation cycle containing one or few inactive states [107]. Moreover, TATA-box containing genes show an increased interspecies variability [81] and higher spontaneous mutational variation [108], indicating an increased evolvability of these particular genes. In an early study, Raser et al., 2004 studied the noisy expression controlled by the budding yeast repressible acid phosphatase (PHO5) promoter. This promoter contains the TATA-box motif and it has been shown that transcriptional noise is reduced when a mutational modification decreases the TATA-box strength [2]. A more recent study confirmed this result and found mutations in yeast pro-moters that eliminate the TATA-box motif which lead to reduced noise levels for these genes [109]. The TATA-box is therefore one genomic feature that can differentiate be-tween genes with variable and stable expression and are enriched amongst stress response genes, which support their role in early adjustment to changing environmental conditions [80] However, a possible confounding factor for the increased noise of TATA-box containing promoters is the number of TFBSs. Tiroshet al., 2006 detected a two-fold enrichment of TFBSs in TATA-box containing promoters [81]. A later study showed that transcriptional
noise scales with increased numbers of TFBSs(Fig. 1.7)[110]. Furthermore, TATA-box
containing genes lack enhancing histone marks and their increased variability in expression can therefore be explained by repressed chromatin [111] (seeSection 1.2.1).
Fig. 1.7: Features of the DNA sequence induce expression noise.
Mutations of the transcription factor (TF) binding site (TFBS), the presence of a TATA box, increase number of TFBSs, reduced number of transcriptional start sites (TSSs) and reduced copy number of genes can induce transcriptional noise.
Promoters can be classified based on their shape as narrow, with few transcriptional start sites (TSSs) that predominantly control tissue-specific gene expression, and broad promoters with larger numbers of TSSs that control the expression of house keeping genes. Mutations that alter the shape of promoters increase transcriptional variability [112]. Furthermore, promoters with one or few TSS show higher levels of expression variability(Fig. 1.7)[32].
1.2 Sources of expression noise 17
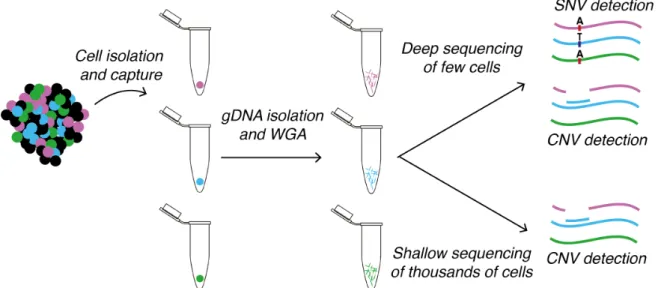
In addition to SNVs, copy number variations (CNVs) (usually defined as copy number variability of regions≥1kb in comparison to a reference genome) in parts of the genome influence gene expression and contribute to, for example, schizophrenia and autism [113]. Combined analysis of DNA and RNA has shown that genes with low copy number tend to be more noisily expressed compared to genes encoded by multiple copies(Fig. 1.7)[114]. In the context of monoallelic expression, genes located on the X chromosome show increased mRNA half-life which in turn increases transcript stability and reduces noise to levels of autosomal genes [32].
In sum, these findings highlight that multiple correlated genomic features are associated with modulating noise. It is therefore challenging to disentangle the individual underlying sources of transcriptional variability.
Epigenetic factors
Epigenetic research is defined as "the study of changes in gene function that are mitoti-cally and/or meiotimitoti-cally heritable and that do not entail a change in DNA sequence" [115]. Epigenetic factors are generally described as DNA methylation at 5’-cytosine–phosphate– guanine-3’ (CpG) dinucleotides, histone modifications and nucleosome positioning [116].
Table 1.2summarises the relationship between epigenetic features and variable gene expres-sion.
CpG islands (CGI) are genomic sites of more than 200 bases with a GC content of more than 50% and are usually unmethylated. Methylation of CGIs in promoters is linked to gene silencing while DNA methylation in gene bodies facilitates transcription [116]. Recently, the presence of CGIs in gene bodies but also at the TSS and in promoter regions was linked to a reduction in transcriptional variability [32]. Morgan and Marioni, 2018 further distinguished between gene promoters associated with short and long CGIs. Similar to the presence of TATA-box motifs as described above, the length of CGIs in promoter regions controls how variably a gene is expressed. Genes associated with short CGIs tend to be more variably expressed and allow an early response to stimulation, exemplified by observations in mouse bone-marrow derived dendritic cells and human breast cancer cells [33]. However, it is not clear whether the length of CGIs is the sole driver for variable gene expression or how multiple genomic features work together to induce transcriptional variability.
Modifications of histones induce the opening or repression of chromatin and therefore indi-rectly modulate gene expression [117]. In an extensive study to link histone modifications
to transcriptional variability, Faureet al., 2017 detected several histone modifications in promoter/core promoter motifs, at the TSS and in gene bodies that increase or decrease variability. The repressive tri-methylation of lysine 27 of histone H3 (H3K27me3) mark is linked to higher variability when present at the TSS, in promoters and in gene bodies. The enhancer related mono-methylation of lysine 4 of histone H3 (H3K4me1) mark only increases variability when present at the TSS and in the core promoter sequence while the repressive tri-methylation of lysine 9 of histone H3 (H3K9me3) mark increases variability when present in the promoter motif. The activating marks tri-methylation of lysine 4 of histone H3 (H3K4me3), acetylation of lysine 9 of histone H3 (H3K9ac) and tri-methylation of lysine 36 of histone H3 (H3K36me3) are linked to low levels of variability when present in gene bodies. In addition to these single features, bivalent promoters that carry the repressive H3K27me3 and enhancing H3K4me3 marks show high levels of transcriptional variability [32]. Here and in Morgan and Marioni, 2018, the authors profiled molecular phenotypic variability in "homogeneous" populations of mESCs as proxy for transcriptional noise. While the effect of fluctuation in cell-cycle stages was regressed out, unobserved variation in, for example, the differentiation potential of mESCs in serum grown medium [12] could still exist. It is therefore difficult to use scRNA-Seq data to study the true underlying effect of transcriptional noise on the overall observable phenotypic variability.
One suggestion why bivalent promoters show high transcriptional variability was brought forward by Karet al., 2017. Here, the authors studied the function of polycomb repres-sive complexes (PRCs) in mESCs. PRCs are epigenetic modifiers of histones that repress transcription of developmental genes [118] and they can bind together with active RNA polymerase II (RNAPII) to bivalent promoters. Switching between the repressed and active states introduces gene expression variability across a population of cells [119]. However, bulk measures were used to identify the bivalency of promoters. That leaves the possibility that in a fraction of cells the promoter resides in an open state while in other cells the promoter is repressed. This highlights the fact that bulk measures might not be suitable to obtain a correct measure of promoter states in cell populations that could contain unobserved cell state heterogeneity.
Chromatin is the packaged state of DNA within the nucleus and its central elements are nucleosomes. Nucleosomes are combinations of eight of the four histones (H3, H4, H2A, H2B) around which 147 bases of DNA twist. An array of histone modifying enzymes exist that regulate the opening or closing of the chromatin; termed heterochromatin and euchro-matin, respectively [120]. Tiroshet al., 2008 showed that promoters with high nucleosome
1.2 Sources of expression noise 19
occupancy close to the TSS tend to display a high range of expression levels across varying conditions (transcriptional plasticity). Distant nucleosome-rich regions are on the other hand associated with low transcriptional variability [121]. Nucleosome covered promoters display shorter transcriptional rates, which in turn explains increased transcriptional variability for these promoters [114]. Single-cell measures indicate cell-to-cell variations in nucleosome positioning around thePHO5promoter upon stress induction. Even in the non-stressed state, a small fraction of cells exhibit nucleosome free regions at the promoter which explains low and possibly noisy expression ofPHO5[122]. This observation again highlights the lack of resolution when using bulk measures to profile the promoter architectures in cell populations. However, current single-cell technologies to profile epigenetic marks lack throughput and are influenced by high levels of technical noise. The observed variations in nucleosome occupancy could therefore be driven by technical variation.
Boundaries between heterochromatin and euchromatin are controlled by boundary elements, such as the transcription factor CCCTC-binding factor (CTCF), that recruit chromatin modifying factors [120]. CTCF also regulates transcription by activating or repressing promoters and regulates distant chromatin interactions [123]. Recent studies suggest that long-range enhancer-promoter interactions modulate transcriptional noise. Interference of CTCF-mediated enhancer-promoter contact either by CTCF knock-out or CTCF-binding site deletion leads to increased expression variability in selected genes [124]. This study however only profiled protein abundance of few genes and did not correct for changes in mean expression that are highly correlated with changes in variance [10]. Enhancers are cis-regulatory elements of non-coding DNA containing TFBSs that regulate the expression of neighbouring genes [125]. Genes within super-enhancer loci, a region with multiple enhancers, control pluripotency master regulators and show high levels of variability in expression down-stream targets of these master regulators show similar co-variation across mESCs [32].
Table 1.2: Epigenetic control of transcriptional noise
Feature Variable Stable
DNA methylation
CGIs Short CGIs
Gene body methylation
Histone modification
H3K27me3 (TSS, promoter, gene body) H3K4me1 (TSS, promoter)
H3K9me3 (promoter) H3K4me3 (gene bodies) H3K9ac (gene bodies) H3K36me3 (gene bodies) H3K27me3 and H3K4me3
Nucleosome position
Nucleosome rich promoters Distant nucleosome rich regions
Deletion of nucleosome remodelling complexes
Genome architecture
CTCF knock-out
CTCF binding site depletion Clustered genes
Nuclear-lamina associated genes
Moreover, the positioning of genes on the genome controls expression noise with densely clustered genes being less variably expressed in comparison to non-clustered genes [126]. Additionally, genes positioned next to “noisy” genes display higher levels of transcriptio