Using Very Large Volume Data Sets for Collaborative Systems Study
Ion IVAN, Cristian CIUREAEconomic Informatics Department,
Academy of Economic Studies, Bucharest, Romania [email protected], [email protected]
This article presents the study requests for collaborative systems, the structure and volume of data necessary for collaborative systems analysis. The paper defines procedures for collect-ing and validatcollect-ing data. This article identifies algorithms to construct homogeneous collectiv-ities. Calculations are carried out with very large data sets and the results are interpreted.
Keywords: collaborative systems, data sets, metric.
Dynamics of collaborative systems
The collaborative systems are an interdis-ciplinary field at the intersection of economy, informatics, management, and sociology. Collaboration involves organizations that have a common mission and join together to form a new structure [1]. A collaborative in-formatics system is also a distribution com-pany whose goal is to sell increasingly quan-tities of his products.
The collaborative informatics systems represent, from the implementation view-point, software entities that are developed during a life cycle process that starts with the problem analysis and ends with the imple-mentation of a fully functional software sys-tem.
The systems consist of components and inte-ractions between them. When collaborative systems are used voluntarily, one of the key drivers to success is how users feel that their experience with the system: if they like, if the system offers them what to expect from him, if they are able to communicate freely and naturally with other participants and whether to recommend it to others [4].
Collaborative systems are classified accord-ing to the followaccord-ing criteria:
a) level of complexity, and by this criterion
are identified:
- collaborative systems with low complexity
level, have few components and the number
of relationships is limited;
- collaborative systems with medium
com-plexity level, have small number of
compo-nents, but do not have large number of streams or systems with large number of
flows and which have large number of
com-ponents;
- collaborative systems with large or highly
complexity level;
- collaborative systems extremely complex,
have many components and many streams: banks, police, internal chain of hotels, airline transport; the banking system is among col-laborative systems with very high level of complexity, because it consists of many components and is characterized by a large variety of links between them.
b) type of application, criterion which groups
systems in:
- collaborative systems in education;
- collaborative systems of defense;
- productive collaborative systems.
c) method of organization, criterion which
divide systems into:
- linear systems, in which subsystems
inte-ract with each other in both directions;
Fig. 1. Linear collaborative system
Between activities A1 and A2 is changed the
message M1, between A2 and A3 is changed
the message M2, between A3 and A4 is changed the message M3, and between A4and
A5 is changed the message M4.
These types of collaborative systems are en-countered in the field of education, each
sub-system representing a graduate school.
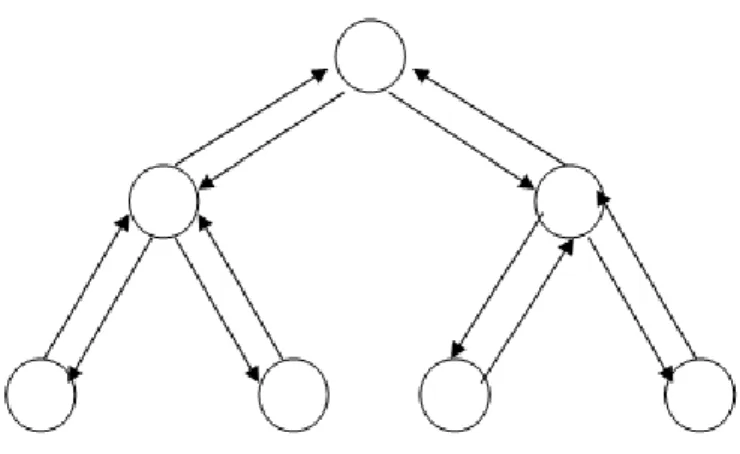
- tree systems, organized by levels, as in
figure 2:
Fig. 2. Tree collaborative system
In a tree system, messages are moving be-tween activities in a hierarchical manner, a message from the second level will reach the level zero only if he move and at level one, and a message of basic activity, represented by the tree root, will be propagated only to activities on the immediately below level. From this level, the message will be for-warded to the activities represented by child nodes of the nodes from level one;
Considering the collaborative system as a tree structure, there are taking into considera-tion:
- the degree of vertical collaboration as the number of links between components from level k to the ones on level k+1;
- the degree of horizontal collaboration as the number of links between components on same level.
Systems of this kind meet in organizational management and public administration.
- network systems, the components
commu-nicate with each other regardless of the level that is;
In the case of a collaborative system, net-work type, subsystems are all interconnected, that all transfers are interrelated. In such a system, messages circulate between all com-ponents without any restriction. Network type collaborative systems meet in the field of production and banking.
The business collaborative system works un-der the black box principle set out by Zadeh,
the entries being given by raw materials and information and the outputs being materia-lized in finished products, services and other information which turns into costs for that business.
Fig. 3. Network collaborative system
Dynamics of collaborative systems concern changes regarding the quality, structure, functions, size, their procedures and stan-dards. Dynamics of collaborative systems are studied using mathematical analysis, provid-ing long-term behavior of each major sys-tems, winning a look inside the system de-sign: which parameters determine the group behavior and how the system characteristics are affected. Is developed a class of mathe-matical models which describe the collective dynamics of the collaborative system and which illustrates the approach by applying to several case studies, including both software agents and robots. For each system, is
trans-formed a set of equations that describe how the system is changing in time and analyze their solutions. Finally, is shown what say these solutions about the collaborative sys-tem behavior.
2.Decisions in collaborative systems
The decision system is very closely related to the information system. The link between the decision and the information systems is as follows:
- first of all, at the entry, the information sys-tem provides to the decision syssys-tem the data which it needs and which it process giving them the appropriate form to be used in the decision process;
- secondly, the data, once processed and tak-en the decision, this is captured by the infor-mation system and directed to compartments where it must reach to be put into practice; - thirdly, the decision system requires even inside it a interim circuit information under conditions in which the collaborative system is led through participatory management. Decisions relating to collaborative systems are divided into:
- current decisions, that relate to daily
deci-sions, contribute to achieving individual ob-jectives and prevails at medium and lower management. Inputs and outputs of such de-cisions concern the daily problems taking place in a collaborative system. The costs re-garding a wrong current decision are small and risks are also reduced;
- short-term decisions, which concern the
decisions for periods of maximum several months and contribute to achieving the group objectives and prevails at medium and lower management. The costs incurred in making such decisions are higher than for current de-cisions;
- medium-term decisions, which concern the
decisions for periods ranging from several months to a year, contributing to achieving the objectives of the group and prevailing at medium and high management. Costs and risks incurred when a medium-term decision is wrong are quite high;
- long-term decisions, that relate to
deci-sions for periods ranging between 1 and 3
years, contributing to achieving the group ob-jectives and overbear at high management level. A wrong decision of this kind involves very large risks and costs and have cata-strophic consequences on the collaborative system involved;
- strategic decisions, that relate to a period
between 3 and 5 years and contributing di-rectly to achieving the fundamental or de-rivative objectives and aims the overall sys-tem activities or its main components.
Economic decision is the action line con-sciously chosen in the driving the system process, from a certain number of possibili-ties in order to achieve some objectives in an efficient maximum. The decision put the re-sources at work, establishes and achieves the system objectives. Requires a training and preparation in which participate a large num-ber of individuals and departments within the system.
Environmental decision consist in all hetero-geneous and exogenous elements of a colla-borative system, which make up the decision situation characterized by the expression of direct and indirect influences on the content and significant results of the decision. In en-vironmental decision is an evolving contra-dictory: on the one hand are a number of changes likely to provide the best prerequi-sites for an effective decision process, and on the other, environmental decision tends to become increasingly more complex due dee-pening social division, reducing the life cycle of products and accelerating the pace of mor-al attrition. In decision making, these ele-ments are expressed in a number of variables and limit conditions and in the involvement of interdependencies between these.
3.Procedures for data collection
Since the first computers become fully opera-tional in 1950, people have realized their power to collect, manipulate, classify, store and retrieve data in a much faster, more flex-ible and more effective manner than human power. The volume and complexity of infor-mation exceeds the processing capacity of one person. That is why the information sys-tems allow to store data for later analysis and
provides methods for processing and filtering to extract only relevant data. By using ma-thematical and statistical algorithms that im-plement known methods for understanding the data is obtained information with new meanings.
Computers have become indispensable for the collection and handling of information, when information is made in high volumes. With the specification of a collaborative sys-tem logical project, are designed procedures for collection, validation, transmission, sto-rage and processing of data entry. Entries in a collaborative system are achieved by retriev-ing the data:
- from primary documents, introduced by operators;
- transmission by all the modalities, includ-ing by satellite;
- by scanning;
- in the form of pulses from machinery of technological process.
Document processing involves extracting in-formation contained in the data fields and converts them to series-bit format that allows storing them in a database. Forms processing is considered complete when all information in the documents have been produced, veri-fied and saved in a database. Collection of data on forms is made either involving an appreciable number of people who collect them and bring them in a program using the computer keyboard, or by entering data au-tomatically in the system.
Among the benefits resulting from the use of a solution for automatically data collection from the forms printed on paper, identifies: - increase efficiency and accuracy in taking and processing the information;
- reduce the number of personnel used in such an activity and implicitly, minimize human errors;
- increased accessibility of information col-lected and easily in their use;
- the storage of documents image on mag-netic disks lead to substantial reduction of space allocated to the classic records, and re-lated costs of administration;
- shortening the processing time of informa-tion as much you want to achieve the STP
(Straight Through Processing);
- improving the quality of services tendered by beneficiaries to their customers.
A brief description of how is working an ap-plication of automatically data collection is as follows:
- the set of forms is scanned using a speed
scanner;
- most data is recognized automatically; - a small number of characters that the pro-gram is not sure he is recognized them make that the image of scanned document to be passed to a human operator for verification and correction;
- the verified data are saved in a database. Documents archives require development of algorithms for flexible retrieval of compo-nents or groups of compocompo-nents to meet re-quirements of collaborative decision-reliance.
Confidentiality is ensured by the fact that the information is delivered to authorized person only and only at a permitted location as access control and authentication are very important to conduct processes on the trans-fer of messages. Access to the database is done only by using an access procedure. The access procedure is structured on hierarchical levels and on parameterized access pass-words. This procedure is available to the user for customization.
The quality of information provided by a col-laborative system to the decision factors and users depends on the quality of input data in a collaborative system depends. It is desira-ble to prevent, if possidesira-ble, plugging in the system incorrect data. The validation data procedures are grouped as follows:
- traditional procedures, which consist in checking by eye data from primary docu-ments;
- automatic control and data validation pro-cedures, in which validation is achieved through validation programs developed by programmers and procedures for automatic control and automatic data correction that identifies and corrects errors automatically, without human factor intervention.
Procedures are built for validating data: al-phabetic, numeric and correlations between
fields. For each application are used standard procedures and the error messages should be much nuanced so as to help troubleshooting a breeze. These error messages must show to the user where and what is wrong.
The presentation manner of the results of va-lidation is as follows:
- displays a confusing message which speci-fies that are errors in data;
- on a different form than they have com-pleted the data shows a list of errors stating the field and the nature of the error;
- the form in which data is completed, at the right of the fields wrong filled appears the er-ror messages, colored in red.
There are more options for the data valida-tion, namely:
- option 1: rigid validation, meaning that the
data entered are validated field with the field and the user can not move forward until it completes correctly previous fields. This va-lidation is accompanied by a reminder re-garding the nature of the error in the form, like a text message or a sound signal;
- option 2: flexible validation on the form,
displaying messages about erroneous data;
- option 3: the form fields erroneous
be-come red;
- option 4: on the form, after sending the
da-ta, a list of errors appears [3].
Should apply any of the four validation op-tions, the application must solve a single problem: the information recorded in the col-laborative system must be accurate and com-plete.
4.Dynamics indicators of collaborative
systems
These indicators characterize homogeneous subsets of data and are divided into the fol-lowing categories:
- indicators operating with time moments; in
a collaborative system represented by a bank which has many branches and agencies lo-cated in many countries, it is interesting to discover the hourly intervals during the day or the days from a week with most of the cash withdrawals; to find the schedule, con-sisting of two hours, during most of the cash withdrawals in a day, is measured every two
hours, the cash withdrawals. During the day there are twelve measurements. The schedule with the numerous withdrawals of cash is de-termined as follows:
IHM = max {IH1, ..., IH12}, where:
IHM - the schedule of a day, with the most
numerous cash withdrawals;
IHi - the volume of cash withdrawals from the
interval of time i; to determine the day with the most numerous withdrawals in a week shall be similar, with the difference that the maximum is calculated from seven values, representing the daily withdrawals;
- indicators operating with levels of a
vari-able, in the bank collaborative system, indi-cators operating with levels of variables are the volume of deposits and the volume of daily withdrawals;
- indicators operating with time moments
and levels of a variable.
These indicators make a metric of collabora-tive systems.
If are considered the collaborative systems
S1, S2, …, Sn, we can build and other
indica-tors for the implementation of quality metric of collaborative systems. For each system Si are collected the data di1, di2, …, dim regard-ing its dynamics. Through the intersection of
di1, di2, …, dim values are obtained some data,
which is common to all collaborative sys-tems. These information are necessary to create new indicators I1, I2, …, Ih. It selects from these indicators some of them which must be sensitive, stable, representative. With the new indicators we evaluate what is unique in collaborative systems.
Also, the indicators for quantification of cha-racteristic levels for maintainability, reliabili-ty, portabilireliabili-ty, complexity has a variety of analytical expressions, from homogeneous expressions to reports of homogeneous ex-pressions, leading to constructions in which logarithmic and exponential function appear. The analytical forms of the indicators must be built such as the indicators simultaneously assure the following conditions. They must be:
- sensitive, that is at small variations of the
influence factors the result variable has small variations; at big variations of the influence
factors the result variable has big variations;
- non-compensatory, that is at different
vari-ation sets of the factors, small values of the result variable are not obtained;
- non-catastrophic, that is at small
varia-tions of the factors, big variavaria-tions of the re-sult variable have not to obtain;
- representative, it represents the quality to
be accepted by users in analysis making as-suring the significance of the results.
The economic process evolution is represented by the continuous dynamic mod-els: by differential equations or by systems of differential equations, as outlined by a single main indicator or a set of indicators related with the model equations, both among them-selves and with the factorial variables which makes the process. Continuous linear dynam-ic models of cybernetdynam-ic systems are frequent-ly encountered in researching the dynamics of economic processes and are represented by linear differential equations.
The quality of a collaborative system is de-fined as all features and characteristics, bear-ing ability to meet the needs specified or im-plied. To measure the quality of a collabora-tive system and assess its performance is used the indicator:
q Y X Y X p B A B A Icalit * ) , max( ) , min( * ) , max( ) , min( , where:
A – the amount planned;
B – the amount realized;
X – the quality planned; Y – the quality achieved;
p – represents the share of the quantitative characteristics (generally amount 0.4);
q – represents the share of the qualitative characteristics (generally amount 0.6) [5]. In [6] are presented algorithms implementa-tions for classifying data, using the top-down inductive method for decision tree construc-tion. They are built on the testing of each node of the tree, beginning with the root node, for each entry. Each node represents the name of an attribute. The instance is in-serted in an existing class, on the basis of common features, evaluating the appropriate attribute of the node reached. Depending on the value, the instance crosses a branch. When no more nodes are evaluated, the
in-stance is classified. If a particular class do not differ in an obviously manner from another, following the introduction of more and more records, the two classes are merged, a process recognized as the pruning
process.
The development of collaborative systems is accelerated, along with the wireless networks and, the quality characteristics become strict-ly related to the security characteristics. The extensions to metrics should include, in the future, indicators of collaborative systems security.
5.Software for very large datasets
man-agement
The storage of huge volumes of data in a company and retrieving such data, in 1990 led to the development of new technologies, building:
- Data warehouses; - Data concentrations; - Data extractions.
Artificial intelligence has a special role to develop and implement technologies for creating and manipulating extremely high da-ta sets and with very high level of complexity [2].
Were properly developed several software products for managing large volumes of data, namely:
- Oracle Datawarehouse, used for data orga-nizing in data warehouses following the mul-tidimensional model;
- Oracle OLAP (On Line Analytical Processing), for retrieving data from data
warehouses, using OLAP technology;
- Oracle Discoverer, to obtain output situa-tions from data warehouses, including ob-taining dynamic reports;
- Oracle Miner, used for advanced statistics, for the discovery, knowledge and informa-tion extracinforma-tion from data.
The WEKA product, the Waikato Environ-ment for Knowledge Analysis, free available from specialized department of the Universi-ty of Waikato, Hamilton, New Zealand, al-low automatically learning techniques to practical problems and integrates various au-tomatically learning tools that are used in a
typical work environment, characterized by a uniform interface. Users use the wide range of automatically learning techniques for ex-traction of useful information from the very large database. It should be noted that WE-KA is used in any area of interest, thus hav-ing a major advantage over other applications of data mining, especially on those commer-cials, which are intended for a single area. WEKA contains tools for data preprocessing, and for data classification are used decision trees, regression, clusterization, rules for as-sociation and visualization. The application is developed in Java and the source code is open, released under the license GNU Gener-al Public License. This is a big advantage of the WEKA system unlike other applications, because it allows changing the system by us-ers in how they need it, possibly with the de-velopment of new automatically learning techniques and implementing their own algo-rithms. Also equally important is that the sys-tem is used on multiple platforms: Unix, Li-nux and Microsoft Windows.
The latest version available to users is WE-KA 3.4.3 and is installed on the Windows platform and other platforms such as Linux or UNIX. It should be noted that for MacOS X is not available at this time than WEKA 3.4.2 version. Java 1.4 virtual machine must be installed on the system in order to run WEKA. An earlier version of WEKA is WEKA 3.0, which is a command line appli-cation. When launching WEKA, a GUI Chooser window appears that allows users to elect to work in CLI command line or for opening the work in Explorer graphical inter-face. WEKA Explorer provides in graphical interface the system packages, namely:
-preprocessing, in which datasets are opened
both as ARFF files and from a specific data-base; also the system allows a unattended da-ta filtering with one of the available filters;
-classify, allowing the choice and run of any
classification algorithm from the defined six categories of algorithms;
- cluster, in which is chosen and is running
the method of data clusterization;
- associate, allowing the setting and
applica-tion of a rule for data combinaapplica-tion;
- select attributes is another WEKA package
and allows the configuration and implemen-tation of any combination of attributes from these that define the data set for detect which are the most relevant attributes from the data set;
- visualize allows viewing the current dataset
in one or two dimensions, and if the attributes have continuous values is used a spectrum of shades of the same color to represent the values, while for discrete attribute each value is represented by a dif-ferent color. Additionally to these tools pack-ages for working with datasets, WEKA con-tains a classifier based on decision trees WEKA CLASSIFIERS TREES USER-CLASSIFIER and a graphical interface for building neural networks WEKA CLAS-SIFIERS FUNCTIONS NEURAL NEU-RALNETWORK.
The data set used in the WEKA program must be in ARFF format in order to be processed. The data come mostly from an Excel table or from a database and must be converted into ARFF format, the most wide-spread for databases in text files. Using this format in parallel with the direct support for databases is another advantage of WEKA. In addition to these positive elements that cha-racterize the WEKA system, there are some disadvantages, namely that requires the learning use of interface, understanding algo-rithms and how are interpreted the numerical and graphical results. In addition, WEKA uses statistical terms instead of using data en-try corresponding terms (e.g., in economic applications), as do other software products, business specialized and more intuitive for a manager or an economist.
To evaluate collaborative systems is imple-mented a software product that allows you to get levels for associated metric.
Data quality is ensured in the situation of analysis and processing of a large volume of data. On these data are made operations such as sorting, regrouping, concatenations or eli-mination of aberrant values. As with a data-set reduced like volume, in the case of a very large data volume certain indicators are cal-culated and highlighted some features of this,
based on the following ranges of values, em-pirically obtained:
- [0; 0,78] is the range that express the bad
character of the calculated indicator;
- (0,78; 0,92] express the good character of
the indicator;
- (0,92; 1] express the very good character
of the indicator.
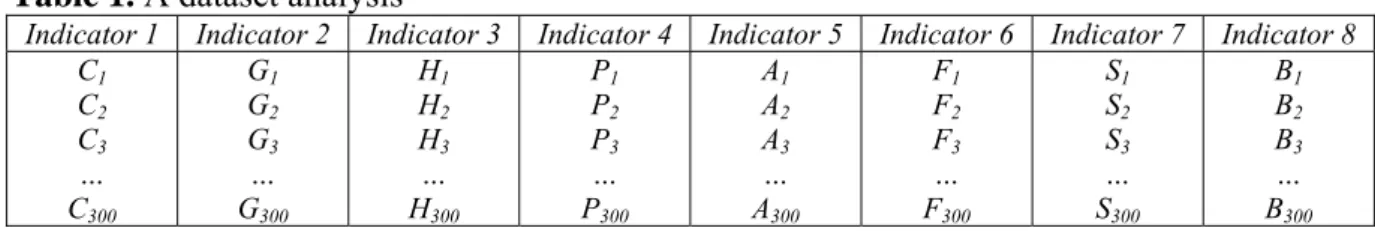
For a dataset of 300 values are calculated the following indicators, whose obtained values are shown in Table 1:
Table 1. A dataset analysis
Indicator 1 Indicator 2 Indicator 3 Indicator 4 Indicator 5 Indicator 6 Indicator 7 Indicator 8 C1 C2 C3 … C300 G1 G2 G3 … G300 H1 H2 H3 … H300 P1 P2 P3 … P300 A1 A2 A3 … A300 F1 F2 F3 … F300 S1 S2 S3 … S300 B1 B2 B3 … B300
Where the indicators in Table 1 do not fall within the range [0; 1] will give the normali-zation of indicators, according to the calcula-tion relacalcula-tionship: min max min V V V V VNi i Є [0; 1], where:
VNi - the normalized value of the indicator i;
Vi - the value of the indicator i;
Vmax - the maximum value of the indicator i;
Vmin - the minimum value of the indicator i. Normalized values of the indicators are sorted descending. Is chosen a distance h
and is determined an item Imin.Are calculated the levels Imin + h, Imin + 2h, Imin + 3h, Imin +
4h = Imaxand are builded datasets that belong
to the intervals:
[Imin ; Imin + h),
[Imin + h; Imin + 2h),
[Imin + 2h; Imin + 3h),
[Imin + 3h; Imin + 4h).
The sets are more homogeneous and allow the application of defined indicators to the metric, obtaining representative levels.
The real problem is to apply the metric and most important to validate it. This will give the confidence that the values are real and the results are reflecting the actual image of the problem. Once the model is defined, it must be implemented in real development or main-tenance cases and it must be tested.
6.Conclusions
The collaborative system is developed based on a set of specifications that were defined in the analysis stage in order to define objec-tives for the development process. The
sys-tem must behave and must give the results the users want and that they have stated at the start.
Increased volume of information and im-provement of operating software products have led to a new quality of data use, as a analysis that shows to the organization man-agement the information difficult or even impossible to obtain in other ways. It is ob-tained such information on customers’ prefe-rences, their profile or distribution. Is pro-vided to the management the data, such as what region of the country is better selling a product, which are the preferences for a spe-cific market segment.
It is obvious that such information is ob-tained only by using certain processes, such as multidimensional analysis, some statistical methods of forecasting and other mathemati-cal methods applied to a very large volume of data. These mathematical methods require the use of a extremely complex specialized software.
From economic perspective, the trade globa-lization, a dramatic sharpening of competi-tion, the spectacular shortening of the prod-ucts life-cycle due to the dynamics of tech-nology, the imposition of extremely high quality requirements, and other such devel-opments, has shown even more the strategic value of information. Intelligence informa-tion manipulainforma-tion requires new management models, more flexible and more functional. The need to respond in optimum time to market requirements has led to decentraliza-tion and to reduce the number of decisional
levels, and enshrines the so-called flat hierar-chies, which are based on delegation of oper-ational decision power to the second man-agement echelon. Basically, classical officer is being replaced by workers with informa-tion. Both at strategic management and at operational management level, the need for pure information, correct and significant has become vital for collaborative systems.
The knowledge-based society evolves only through the high quality of citizen-oriented collaborative systems.
The current research was financed from Eu-ropean Structural Funds, project no. 7832, “PhD and doctoral in the triangle Education-Research-Innovation, DOC-ECI” (cercetare finanţată din Fondurile Structurale Europene, proiect nr. 7832, “Doctorat şi doctoranzi în triunghiul Educaţie-Cercetare-Inovare, DOC-ECI”).
References
[1] R. Arba, “Collaborative Electronic Mar-ketplace,” in International Workshop „Collaborative Support Systems in
Busi-ness and Education”, Cluj-Napoca, pg.
11, October 2005.
[2] C. Bodea, Baze de date: tendinţe în evoluţia tehnologiilor şi aplicaţiilor, Edi-tura Inforec, Bucureşti, 2001.
[3] I. Ivan and C. Ciurea, “Entry data valida-tion in citizen oriented applicavalida-tions”, pa-per of The "4th International Conference
on Applied Statistics", November 20-22,
2008, NIS Publishing House, (Bucharest, Romania), ISBN 1018-046x.
[4] I. Ivan, C. Boja and C. Ciurea, Metrici ale
sistemelor colaborative, Editura ASE,
Bucuresti, 2007.
[5] I. Ivan and C. Ciurea,”Quality characte-ristics of collaborative systems,” in Proc. The Second International Conferences on Advances in Computer-Human
Interac-tions, ACHI 2009, vol. I, (Cancun,
Mex-ico), pp. 164-168, February 2009.
[6] R. Quinlan, “Data Mining from an AI Perspective,” Proceedings of the 15th In-ternational Conference on Data
Engi-neering, Sydney, Australia, March 1999.
Ion IVAN has graduated the Faculty of Economic Computation and
Econom-ic CybernetEconom-ics in 1970, he holds a PhD diploma in EconomEconom-ics from 1978 and he had gone through all didactic positions since 1970 when he joined the staff of the Bucharest Academy of Economic Studies, teaching assistant in 1970, senior lecturer in 1978, assistant professor in 1991 and full professor in 1993. Currently he is full Professor of Economic Informatics within the Department of Economic Informatics at Faculty of Cybernetics, Statistics and Economic Informatics from the Academy of Economic Studies. He is the author of more than 25 books and over 75 journal articles in the field of software quality management, software metrics and informatics audit. He is distinguished member of the scientific board for the magazines and journals like: Informatica Economică, Economic Computation and Economic Cybernetics Studies and Research, Romanian Journal of Statistics.
Cristian CIUREA has a background in computer science and is interested in
collaborative systems related issues. He has graduated the Faculty of Eco-nomic Cybernetics, Statistics and Informatics from the Bucharest Academy of Economic Studies in 2007. He is currently conducting doctoral research in Economic Informatics at the Academy of Economic Studies. Other fields of interest include software metrics, data structures, object oriented program-ming in C++ and Windows applications programprogram-ming in C#.