Multitask Protein Function Prediction
Through Task Dissimilarity
Marco Frasca, Nicol `o Cesa Bianchi
Abstract—Automated protein function prediction is a challenging problem with distinctive features, such as the hierarchical
organization of protein functions and the scarcity of annotated proteins for most biological functions. We propose a multitask learning algorithm addressing both issues. Unlike standard multitask algorithms, which use task (protein functions) similarity information as a bias to speed up learning, we show that dissimilarity information enforces separation of rare class labels from frequent class labels, and for this reason is better suited for solving unbalanced protein function prediction problems. We support our claim by showing that a multitask extension of the label propagation algorithm empirically works best when the task relatedness information is represented using a dissimilarity matrix as opposed to a similarity matrix. Moreover, the experimental comparison carried out on three model organism shows that our method has a more stable performance in both “protein-centric” and “function-centric” evaluation settings. Index Terms—Multitask learning; protein function prediction; label propagation algorithm; Gene Ontology; task dissimilarity.
✦
1
I
NTRODUCTIONT
HE constant increase in the volume and variety of publicly available genomic and proteomic data is a characteristic trait of modern biomedical sciences. A funda-mental problem in this area is the assignment of functions to biological macromolecules, especially proteins. Indeed, the accurate annotation of protein function would also have great biomedical and pharmaceutical implications, since several human diseases have genetic causes. While molecular experiments provide the most reliable annotation of proteins, their relatively low throughput and restricted scope have led to an increasing role for automated function prediction (AFP). AFP is characterized by unbalanced func-tional classes with rare positive instances. Moreover, since only positive membership to functional classes is usually assessed, negative instances are not uniquely defined, and different approaches to choose them have been proposed [1], [2], [3]. Other peculiarities of AFP include: (1) the need of integrating several heterogeneous sources of genomic, proteomic, and transcriptomic data in order to achieve more accurate predictions [4], [5]; (2) the presence of multiple labels and dependencies among class labels; (3) the hierar-chical structure of functional classes (a direct acyclic graph for theGene OntologyGO [6], a forest of trees for theFunCattaxonomy [7]) with different levels of specificity.
Recently, two international challenges for Critical Assessment of Functional Annotation, (CAFA [8] and CAFA2 [9]) were organized to evaluate computational methods that automatically assign protein functions. In particular, CAFA2 emphasized the need for multilabel or structured-output learning algorithms for predicting a set of terms, or a subgraph of the GO ontology for a given protein. In this work we mainly focus on this problem,
• M. Frasca and N. Cesa Bianchi are with the Dipartimento di Informatica, Universit`a degli Studi di Milano, Via Comelico 39 Milano, 20137, Italy. E-mail:{marco.frasca, nicolo.cesa-bianchi}@unimi.it
Preprint submitted to the IEEE Transactions on Computational Biology and Bioinformatics, 2017; Accepted March 17, 2017.
whose solution however requires paying attention also to the other aspects of AFP.
Several approaches to the predicton of protein func-tions were proposed in the literature, including sequence-based [10], [11], [12] and network-sequence-based methods [13], [14], [15], structured output algorithms based on kernels [3], [16], [17] and hierarchical ensemble methods [18], [19], [20]. In particular, the availability of large-scale networks, in which nodes are genes/proteins and edges their functional pairwise relationships, has promoted the development of several machine learning methods where novel annotations are inferred by exploiting the topology of the resulting biomolecular network. Initially, network-based approaches relied on the so calledguilt-by-association(GBA) rule, which makes predictions assuming that interacting proteins are likely to share similar functions [21], [22], [23]. Indirect neighbours were also exploited to modify the notion of pairwise-similarities among nodes by accounting for pairs of nodes connected through intermediate ones [24], [25]. Protein functions can be also propagated through the net-work with an iterative process until convergence [26], [27], by tuning the amount of propagation allowed in the graph through Markov random walks [28], [29], by evaluating the functional flow through the nodes [30], by exploiting kernelized score functions [31], and by modelling protein memberships through Markov Random Fields [32] and Gaussian Random Fields [33], [34]. Furthermore, methods based on the convergence of classical [35], [36] and multi-category Hopfield networks [37] were recently proposed to specifically tackle the class imbalance.
Although protein functions are clearly dependent (see, e.g., the GO functions, where parent terms include all the proteins of their children) most AFP methods described above predict biological functions independently from each other. Multitask methods, on the other hand, take advantage of existing dependencies by transferring information be-tween related tasks, which typically leads to learning faster than algorithms trained independently on each task.
IEEE TRANSACTIONS ON COMPUTATIONAL BIOLOGY AND BIOINFORMATICS, PREPRINT. IN PRESS. ACCEPTED ON MARCH 2017. 2
In this paper we investigate an alternative approach to multitask learning based on exploiting task dissimilarities rather than similarities. In particular, we consider two multi-task extensions of a known label propagation algorithm [26]: the first extension follows a standard multitask approach based on task similarities; the second extension learns in-stead from task dissimilarities. Both approaches can be nat-urally applied to the multilabel prediction of proteins. The prediction tasks we consider are the GO protein functions of fly, human, and bacteria model organisms. We compute different measures of similarity/dissimilarity between GO terms, taking into account both GO structure and protein annotations. We show that the approach learning from task dissimilarities greatly helps in unbalanced tasks (by helping instances labeled with the rare class labels to be correctly classified), and does not hurt in the more balanced cases. This is a crucial point in protein function prediction, since terms better describing protein functions —i.e., the most specific ones— are the most unbalanced (proteins annotated with these terms are very rare). On the other hand, learning from similar tasks tends to be more effective on balanced settings. Note that the proposed multitask extensions of label propagation do not increase the overall running time of the algorithm, allowing its application on large-sized datasets. Finally, we compare our methods with the state-of-the-art methodologies for AFP by considering both “term-centric” and “protein-“term-centric” evaluation settings.
The paper is organized as follows. In Section 2 we formally introduce the problem and in Section 3 we describe the proposed multitask label propagation methodology. Sec-tion 4 is dedicated to the experimental validaSec-tion of the method on a real-world application.
2
A
UTOMATEDP
ROTEINF
UNCTIONP
REDICTIONThe Automated protein Function Prediction (AFP) problem can be formalized as semi-supervised learning problem on a weighted and undirected graphG = (V, E,W), where
V ={1, . . . , n}is the set of vertices,E⊂V×V is the set of edges, andW =wijn×nis the symmetric weight matrix, wherewij is the weight on the edge between verticesiand
j(we assumewii = 0andwij= 0for all(i, j)∈/E). A set ofmbinary classification tasks onGis defined by
m labelingsy(1), . . . ,y(m) ∈ {−1,1}n of the nodes in V,
whereyi(k) is the label of nodeifor taskk. For any subset T ⊆ {1, . . . , n}and any vectory= (y1, . . . , yn), we useyT
to denote the vector obtained fromyby retaining only the coordinates inT.
The multitask prediction problem on the graphGis then defined as follows. Given a setS ⊂ V of training vertices and the complement set U ≡ V \S of test vertices, the learner must predict the test labels yU(1), . . . ,yU(m) for each task given the training labels yS(1), . . . ,y(Sm) for the same tasks.
3
M
ETHODSWe first describe the standard label propagation algo-rithm [26], [38], [39] for single-task classification on graphs. This will be later extended to the multitask setting.
3.1 Label Propagation (LP)
In the single-task setting, a standard notion ofregularityof a labelingf ∈ {−1,1}non a graphGis theweighted cutsize
induced byf and defined as follows: ΓWG(f) =
X (i,j)∈E
fi6=fj
wij . (1)
The weighted cutsize can be also expressed as a quadratic form ΓWG(f) = 1 4f ⊤L f = 1 4 X (i,j)∈E wij(fi−fj)2.
The matrixL=D−W is theLaplacianofG, whereDis the diagonal matrix with entriesDii =di =Pjwij. The Label
Propagation algorithm minimizes the above quadratic form over real-valued (rather than binary) labels. More precisely, LP finds the unique solution of
min
f∈Rnf
⊤L
f
s.t. fi=yi i∈S . (2)
The solution fU∗ of (2) is smooth on G. Namely, if two
verticesi, j∈U are connected with a large weightwij, then
fi∗is close tofj∗. Indeed, the componentsi∈U off∗satisfy
the harmonic property [26]
fi∗= 1 di X j wijfj∗.
The vectorfU∗ can be also written in closed form as
fU∗ = (DUU−WUU)−1WUSfS∗ (3) where W = WUU WUS WUST WSS
is the weight matrix partitioned in blocks to emphasize the labeled and unlabeled part of the graph (similarly for the matrixD). As the components offU∗ given by (3) are not in{−1,1}, the final labeling produced by LP is obtained by thresholding each componentf∗
i fori∈U.
3.2 Multitask label propagation (MTLP)
It is fairly easy to use similarity or dissimilarity informa-tion between tasks in order to generalize LP to multitask learning, while preserving the regularity of every task in the sense of (1).
We start by considering multitask LP based on similarity information. Suppose am×msymmetric matrixCis given, where each entry Ckr ∈ [0,1] quantifies the relatedness
between tasksk andr. Let A = γIm+L be the matrix where γ > 0, Im is the m×midentity matrix, andL is the Laplacian ofC. The matrixAis symmetric and positive definite, sinceA is diagonally dominant with positive di-agonals, and thus invertible. Denote byY then×mlabel matrix whosek-th column is the vectory(k), and byF the
n×mmatrix whosek-th column is the vectorf(k). When learning multiple related tasks, a widely used approach is requiring that similar tasks be assigned
sim-ilar labelings. To this end, we introduce the linear map ψA−1:R n×m→Rn×m, defined as follows: ψA−1(Y) =YA −1. (4) It can be shown that the map ψA−1 acts on a multitask labeling matrixY by getting closer (in Euclidean distance) the labelings (columns ofY) corresponding to tasks that are similar according toC.
By means of ψA−1, the exploitation of task similarities can be encoded into the learning problem (2) as follows:
min F trace(F ⊤ LF) s.t. Fik =Yike i∈S, k= 1, . . . , m (5) whereYe =ψA−1(Y) =YA −1 . The solution to (5) is e FU = (DUU −WUU)−1WUSYeS
where FeU is the submatrix of F including only the rows
indexed byU, andYeS is the submatrix ofYe including only
the rows indexed byS. By observing thatYeS =YSA−1, we
have e
FU = DUU−WUU)−1WUSYSA−1=FU∗A
−1
whereFU∗is the solution of (5) with constraintsFik =Yikfor i∈S andk= 1, . . . , m. The equalityFeU =FU∗A
−1
shows that it is equivalent to apply the task feature map (4) before or after performing label propagation. This ensures that the multitask mapping does not increase the label propagation complexity.
As we show next, this solution does not perform well on unbalanced classification problems, where some class (typically the positive class) is largely underrepresented. We propose here an alternative approach, which exploits the prior information about task relatedness in an “inverse” manner. Specifically, we propose a multitask label propa-gation algorithm which learns multiple tasks by requiring that dissimilar tasks be assigned dissimilar labelings. As we see in the experiments, this approach turns out to work particularly well on unbalanced classification problems.
The first component of our method is a dissimilarity matrix C, where Ckr ∈ [0,1] is measure of dissimilarity between taskskandr(we discuss in Section 3.2.2 possible choices for the matricesCandC).
Given the matrixC, we consider the multitask mapψA: Rn×m→Rn×m, defined as
ψA(Y) =YA (6)
where A = γIm +L, γ > 0, and L is the Laplacian matrix ofC. Unlike the inverse transformation (4), the map ψA moves the columns of matrix M farther away from
each other, in the sense of the Euclidean distance, in the correspondingn-dimensional space. We formally show that in Section 3.2.1. UsingψAinstead ofψA−1 in (5), we obtain the following optimization problem:
min
F trace F
⊤
LF
s.t. Fik =Yikb i∈S, k= 1, . . . , m (7)
withYb =ψA(Y). Similarly to (5), the solution to (7) is b
FU = DUU−WUU)−1WUSYSA=FU∗A
whereFU∗ is the solution of (7) with constraintsFik = Yik
fori ∈ S andk = 1, . . . , m. Just like in the previous case, the equalityFeU =FU∗Ashows that it is equivalent to apply
the task feature map (6) before or after performing label propagation.
We call MTLP-inv the similarity-based method (5) and MTLP the dissimilarity-base method (7). In the next section we show some interesting properties of the mapψAwhich
make MTLP suitable for unbalanced classification problems.
3.2.1 Analysis of the multitask mapψA
Given M ∈ Rn×m, let Mi· and M·k be, respectively, the i-th row and the k-th column of the matrix M. Let also Pi = {1 ≤ k ≤ m : Yik = 1} be the set of tasks for
which the instanceiis positive, andNi the set of tasks for
which the instanceiis negative. We introduce the following notation: for eachk= 1, . . . , m
d+ k,i = X r∈Pi Crk d−k,i= X r∈Ni Crk dk = m X r=1 Crk and a+ k,i= X r∈Pi Ark a−k,i = X r∈Ni Ark ak = m X r=1 Ark.
The next result shows that the action of the linear mapψA
on the label matrix Y is to change the value of each label without altering the sign. The label of an instanceiin taskk
is made roughly proportional to the weighted sum of tasks in C that are dissimilar to kand have a different label for instancei—see also Corollary 1.
Fact 1.GivenY ∈ {−1,1}n×m, the task interaction matrix C ∈ Rm×m, and the mapψA : Rn×m −→ Rn×m such
thatYb =ψA(Y) =YA, whereA=γIm+L, then for
alli= 1, . . . , nit holds b Yik = ( γ+ 2d− k,i if Yik = +1 −γ−2d+ k,i if Yik =−1
Proof:By definition,Yikb =Pmr=1YirArk=a+k,i−a
−
k,i.
We distinguish the following two cases.
Case 1.k∈ Pi. In this case we havea+k,i=Akk−d+k,i =γ+
dk−d+
k,i=γ+d+k,i+d
−
k,i−d+k,i=γ+d
−
k,i, since by definition
dk =d+
k,i+d
−
k,ifor anyi∈ {1,2, . . . , n}. Moreover, sincek∈ Pi, we havea−k,i = −d
−
k,i (by the definition of Laplacian),
and accordingly b Yik = γ+d− k,i−(−d − k,i) =γ+ 2d − k,i Case 2.k ∈ Ni. In this case, it holdsa+k,i =−d
+
k,i, whereas
a−
k,i=Akk−d−k,i =γ+dk−d−k,i=γ+d+k,i. It follows b
Yik = −d+
k,i−γ−d+k,i =−γ−2d+k,i
The property is proven by observing that k ∈ Pi implies Yik= +1andk∈ NiimpliesYik =−1.
Using Fact 1 we can show that the mapψAtends to increase
the distance between the labelingsY·randY·s, for any pair
of distinct tasksr, s ∈ {1,2, . . . , m}. Indeed, we can prove the following.
IEEE TRANSACTIONS ON COMPUTATIONAL BIOLOGY AND BIOINFORMATICS, PREPRINT. IN PRESS. ACCEPTED ON MARCH 2017. 4 Fact 2. GivenY ∈ {−1,1}n×m, the task interaction matrix
C ∈ Rm×m, and the mapψA : Rn
×m −→ Rn×m such
thatYb =ψA(Y) = YA, whereA=γIm+L. Then
for everyr, s∈ {1,2, . . . , m}it holds kY·r − Y·sk2≤ kYb·r − Yb·sk2
for everyγ≥1, wherek · kis the Euclidean norm.
Proof:We prove this property by showing that(Yir− Yis)2≤(Yirb −Yisb )2for alli∈ {1,2, . . . , n}. We distinguish
the following four cases:
Case1: Yir =Yis = 1. In this case(Yir−Yis)2 = 0, and
by Fact 1,(Yirb −Yisb )2 = (γ+ 2d−
r,i−γ−2d
−
s,i)2 =
4(d−r,i−d−s,i)2≥0.
Case2: Yir =Yis=−1. Even in this case(Yir−Yis)2 = 0,
whereas(Yirb −Yisb )2= (−γ−2d+
r,i+γ+ 2d + s,i)2 = 4(d+ s,i−d + r,i)2≥0.
Case3: Yir = 1 ∧ Yis=−1. In this case,(Yir−Yis)2= 4,
and(Yirb −Yisb )2= (γ+ 2d−
r,i+γ+ 2d+s,i)2 = 4(γ+
d−
r,i+d+s,i)2. Since bothd+s,i,d
−
r,i ≥ 0andγ ≥1, it
follows(Yir−Yis)2≤(Yirb −Yisb )2.
Case4: Yir =−1 ∧ Yis = 1. Again(Yir−Yis)2 = 4, and
(Yirb −Yisb )2= (−γ−2d+ r,i−γ−2d−s,i)2 = 4(−(γ+ d+ r,i+d − s,i))2. Asd −
s,i,d+r,i ≥0andγ ≥1we have,
like the previous case,(Yir−Yis)2≤(Yirb −Yisb )2.
The map ψA not only increases the distance between the
instance-indexed label vector for two distinct tasks (as we just showed), but it also increases the distance between the task-indexed label vector for two distinct instances. Indeed, sinceLis positive semidefinite, it is easy to show that when
γ≥1the transformationψAincreases the distance between
the labelings Yi·andYj·, for any pair of distinct instances i, j∈ {1,2, . . . , n}.
We now focus our discussion on another important feature of the algorithm, which makes our multitask label propagation appropriate for tasks with very unbalanced labelings. Specifically, when most entries of each column in the label matrixY are−1. In this case, the rows ofY also contain mostly negative entries. Accordingly, by Fact 1, we can compensate the preponderance of negatives by applying the mapψA. We show that with an example.
Consider the task interaction matrixCsuch thatCrs= 1 for allr6=s. That is, all tasks are strongly dissimilar to each other. Then A= γ+m−1 −1 . . . −1 −1 γ+m−1 . . . −1 .. . ... ... ... −1 . . . γ+m−1 (8) By Fact 1, it is straightforward to prove the following.
Corollary 1. Fix Y ∈ {−1,1}n×m and the map ψ A :
Rn×m→Rn×msuch thatYˆ =ψA(Y) =YA, whereA
is defined as in (8). Then, for alli= 1, . . . , nit holds that b
Yik =
γ+ 2|Ni| if Yik = +1 −γ−2|Pi| if Yik =−1.
Corollary 1 shows that, when|Pi| ≪ |Ni| = m− |Pi|(that
is, the multitask labeling for vertexiis unbalanced towards
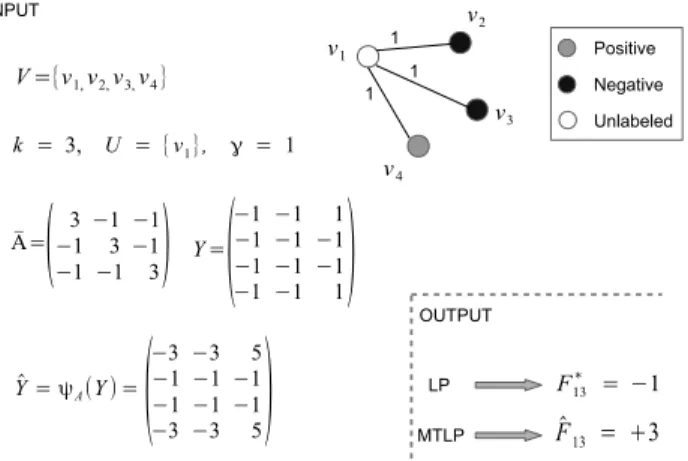
Fig. 1. Toy example with four verticesv1, . . . v4, labeled for three tasks
according to the matrixY. The test point is instancev1in all the tasks,
and we apply LP and MTLP to predict it. For tasks1and2both methods correctly associatev1with a negative label. However, in the third task,
only MTLP correctly predicts a positive label forv1.
negatives), the map ψA assigns to positives (Yik = +1)
an absolute value higher than that assigned to negatives (Yik = −1). An analogous behaviour characterizes our method when a generic matrixCis considered, as stated in Fact 1. This simple property allows the rare positive labels to propagate in the graph. This is unlike the standard LP algo-rithm, where negative vertices are easily overwhelmed by the positive vertices during the label propagation process. The toy example in Figure 1 shows that the application of the mapψA, whereAis defined as in (8), allows to improve
the final classification of vertices. These observations are empirically confirmed in Section 4.
3.2.2 Task similarities
While MTLP and MTLP-inv are designed to work with any task matrix, similarity and dissimilarity measures are typically tailored to specific domains. Different tasks may share different types of similarities, or may be organized in a hierarchy with a specific structure —such as a tree or a directed acyclic graph— where the positive instances of the children tasks are subsets of the positive instances of their parent tasks. In the case of a hierarchy, different approaches for computing the task matrix are possible: considering only the structure of the hierarchy [40], [41], or combining the hierarchical information with the information content of the tasks [42].
In this work we consider two dissimilarity mea-sures (diss0 and diss3) and three similarity measures
(sim1,sim2,sim3). The similarity measures sim1 and sim2
were introduced by Jiang [43] and Lin [44], respectively. Both measures are derived from the dissimilarity measure diss0, whose definition requires a hierarchy over the tasks.
The dissimilaritydiss3 is computed directly from the
sim-ilaritysim3, which does not require any hierarchical
infor-mation.
When tasks are organized in a hierarchy, we denote by anc(k)⊂ {1, . . . , m}the set of ancestor tasks of taskkin the hierarchy. Moreover, we useν(k)to denote the frequency of positive instances for task k. Since a positive instance for
a task k is also positive for any r ∈ anc(k), it holds that
ν(k) ≤ ν(r). Finally, we denote byMA(k, r) the common ancestor of tasksk and rwhose frequency ν(MA(k, r))is the lowest among all ancestors ofkandr.
Let −log(ν(k)) be the information content of task k. We start by recalling the hierarchical dissimilarity measure introduced in [44],
diss0(k, r) =−logν(k)−logν(r) + 2 logν(MA(k, r)).
This is the sum of the information content ofkandrminus the information content of their closest common ancestor MA(k, r). Note thatdiss0is always positive, asMA(k, r)≥
max{ν(k), ν(r)}. The two hierarchical similarity measures associated withdiss0are defined as follows.
Jiang similarity measure:
sim1(k, r) =
1 1 + diss0(k, r)
. Lin similarity measure:
sim2(k, r) =
2 logν(MA(k, r)) logν(k) + logν(r)
Our third similarity measure does not rely on a hierarchy of tasks. LetP(k) the set of instances that are positive for the
taskk.
Information content measure:
sim3(k, r) = P(k)∩P(r) P(k)∪P(r) ifP (k)∪P(r)6=∅ 0 otherwise.
This is the ratio between the number of examples that are positive for both tasks and the number of examples that are positive for at least one task. The higher the number of shared positive examples, the higher the similarity (up to 1). When two tasks do not share any positive example, their similarity is zero. In a hierarchy of tasks, tasks with many positive examples are usually closer to the root (less specific). In this case the denominator of sim3 tends to
reduce the similarity between the two tasks as opposed to the case in which the task have a small number of positive annotations. Indeed, sharing annotations between two specific tasks (closer to leaves) is more informative than sharing annotations between two more general tasks (closer to the root).
In the experiments, we compare learning with similar-ities sim1(k, r) and sim2(k, r) against learning with the
dissimilarity diss0(k, r). We also compare learning with
sim3(k, r)againstdiss3(k, r) = 1−sim3(k, r). For each one
of the similarity/dissimilarity measures defined above, we setCkr = sim(k, r)and Ckr = diss(k, r)(where necessary,
values are normalized so that all matrix entries lie in the range[0,1]).
4
R
ESULTS ANDD
ISCUSSIONIn this section we evaluate our multitask algorithm on the prediction of the bio-molecular functions of proteins belonging to some considered model organisms. We start by describing the experimental setting. Then we compare
the performance of our algorithm against that of state-of-the-art methods.
4.1 Experimental setting
4.1.1 Data
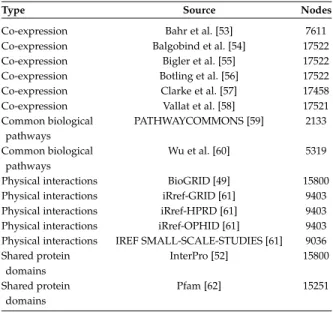
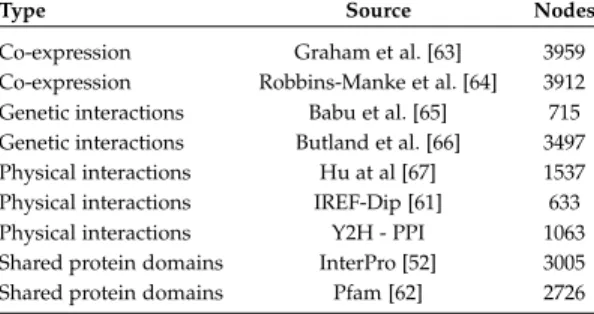
We considered three different experiments to predict the protein functions of three model organisms: Drosophila melanogaster (fly), Homo sapiens (human) and Escherichia coli (bacteria). Gene networks for model organisms have been downloaded from the GeneMANIA web-site (www.genemania.org), and selected in order to cover different types of data, including co-expression, genetic in-teractions, shared domains, and physical interactions. The selected networks are described in Tables 1, 2 and 3. For every organism, networks were integrated through
Type Source Nodes
Co-expression Baradaran-Heravi et al. [45] 8857
Co-expression Busser et al. [46] 8857
Co-expression Colombani et al. [47] 8857
Co-expression Lundberg et al. [48] 8857
Genetic interactions BioGRID [49] 929
Genetic interactions Yu et al. [50] 1414
Physical interactions Guruharsha et al. A [51] 1866
Physical interactions Guruharsha et al. B [51] 3833
Physical interactions BioGRID [49] 558
Shared protein domains InterPro [52] 5627
TABLE 1 Fly networks.
Type Source Nodes
Co-expression Bahr et al. [53] 7611
Co-expression Balgobind et al. [54] 17522
Co-expression Bigler et al. [55] 17522
Co-expression Botling et al. [56] 17522
Co-expression Clarke et al. [57] 17458
Co-expression Vallat et al. [58] 17521
Common biological PATHWAYCOMMONS [59] 2133
pathways
Common biological Wu et al. [60] 5319
pathways
Physical interactions BioGRID [49] 15800
Physical interactions iRref-GRID [61] 9403
Physical interactions iRref-HPRD [61] 9403
Physical interactions iRref-OPHID [61] 9403
Physical interactions IREF SMALL-SCALE-STUDIES [61] 9036
Shared protein InterPro [52] 15800
domains
Shared protein Pfam [62] 15251
domains
TABLE 2 Human networks.
unweighted sum on the union of genes in the individual networks. No preprocessing was applied to the individual networks, whereas each network, denoted by the corre-sponding connection matrixW, was normalized as follows:
ˆ
IEEE TRANSACTIONS ON COMPUTATIONAL BIOLOGY AND BIOINFORMATICS, PREPRINT. IN PRESS. ACCEPTED ON MARCH 2017. 6
Type Source Nodes
Co-expression Graham et al. [63] 3959
Co-expression Robbins-Manke et al. [64] 3912
Genetic interactions Babu et al. [65] 715
Genetic interactions Butland et al. [66] 3497
Physical interactions Hu at al [67] 1537
Physical interactions IREF-Dip [61] 633
Physical interactions Y2H - PPI 1063
Shared protein domains InterPro [52] 3005
Shared protein domains Pfam [62] 2726
TABLE 3 Bacteria networks.
whereDis the diagonal matrix with diagonal entriesdii= P
jWij.
Protein functions were downloaded from the Gene On-tology. This ontology is structured as a directed acyclic graph with different levels of specificity and contains three branches: Biological Process (BP), Molecular Functions (MF), and Cellular Components (CC). We considered the experi-mental annotations in the releases 07.03.16, 16.03.16, and 17.10.16 respectively for fly, human and bacteria organisms. We performed a dedicated experiment for every branch.
For predicting the most specific terms in the ontology (i.e., those best describing protein functions), and in order to consider terms with a minimum amount of prior infor-mation, we selected all the GO terms with5−100positive annotated genes, obtaining2657(1742BP,539MF,376CC), 5312 (3799 BP, 957 MF, 556 CC), and 1324 (653 BP, 610 MF,61CC) terms for fly, human, and bacteria, respectively. We considered two groups of GO terms according to their specificity: GO terms with5-20 and21-100annotated pro-teins, for a total of2categories for every GO branch. In the end, we obtained a total of 10329 fly, 15262human, and 4132 bacteria genes which have at least one GO positive annotation in the considered GO release. The obtained tasks are therefore severely unbalanced toward negatives.
4.1.2 Evaluation metrics
In order to evaluate the generalization performance of the compared methods, we applied a 3-fold cross-validation experimental setting and adopted the Area Under the Precision-Recall Curve (AUPRC) as “per term” ranking measure. AUPRC is indeed more informative on unbalanced settings than the classical area under the ROC curve [68]. Furthermore, following the recent CAFA2 international challenge, we also considered a “protein-centric evaluation” to assess performance accuracy in predicting all ontological terms associated with a given protein sequence [9]. In this scenario, the multiple-label F-score is used as performance measure. More precisely, if we indicate asTPj(t), TNj(t)
andFPj(t)respectively the number of true positives, true
negatives, and false positives for the proteinjat threshold
t, we can define the “per-protein” multiple-label precision
Prec(t)and recallRec(t)at a given thresholdtas: Prec(t) = 1 n n X j=1 TPj(t) TPj(t) + FPj(t) Rec(t) = 1 n n X j=1 TPj(t) TPj(t) + FNj(t)
wherenis the number of proteins. In other words,Prec(t) (resp., Rec(t)) is the average multilabel precision (resp., recall) across proteins. The multilabel F-measure depends on t and according to CAFA2 experimental setting, the maximum achievable F-score (Fmax) is adopted as the main
multilabel “per-protein” metric:
Fmax= max t
2Prec(t)Rec(t)
Prec(t) + Rec(t) (9)
4.2 Results
4.2.1 Evaluating GO semantic similarities
This section investigates the impact of the task similar-ity/dissimilarity measures described in Section 3.2.2 on the performance of the proposed multitask label propagation algorithms. Table 4 shows the obtained results. In this experiment we set γ = γ = 1 (the choice of parameter
γ is discussed in Section 4.2.5). When MTLP-inv uses the similarity measures sim1,sim2 and MTLP uses diss0 for
MTLP, MTLP outperforms MTLP-inv in both AUPRC and
Fmax. Nevertheless, the GO term similarity sim3 is much
more informative for MTLP-inv, which achieves in this case results competitive with MTLP (whose performance instead is nearly indistinguishable when usingdiss0 or diss3), and
in some cases even better. The difference in favor of MTLP seems to increase with the data imbalance: on humandata set, the most unbalanced, we observe the highest gap in favor of MTLP; whereas on theBacteria data set, the least unbalanced, the gap is reduced and —in some cases like for the MF terms— MTLP-inv significantly outperforms MTLP in terms of average AUPRC. In terms of Fmax, however,
MTLP is always the top method.
Overall, these results suggests that MTLP should be preferred when the proportion of positives is drastically smaller than that of negatives. When data are more bal-anced, MTLP-inv better exploits the similarities among tasks and, at least in term of AUPRC, is a valid option. In terms of multilabel accuracy, is always better than MTLP-inv. Finally, it is worth noting that both methods outperforms LP in terms of AUPRC (see Section 4.2.3 for LP results), whereas in terms ofFmaxonly MTLP achieves better results
than LP. In order to investigate the reasons why, unlike MTLP-inv, MTLP performance slightly varies with the task dissimilarity measure, we run MTLP on the fly organism and CC tasks by randomly generating the matrix C. We generated matrices with different sparsity (from5%to95%, with steps of 10%) and with different ranges of weight values. Specifically, we uniformly selected weights in the interval[0, τ], withτ ranging from0.1to1, by steps of0.1. In Figure 2, we show the heatmap of the average AUPRC obtained in each experiment. As expected, the results are considerably worse than those obtained when considering real dissimilarity matrices (see Table 4). There is a small
METHODS BP MF CC
All 5-20 21-100 Fmax All 5-20 21-100 Fmax All 5-20 21-100 Fmax
FLY MTLPdiss0 0.140 0.133 0.153 0.247 0.333 0.322 0.355 0.411 0.262 0.265 0.253 0.354 MTLPdiss3 0.140 0.133 0.153 0.246 0.333 0.322 0.355 0.410 0.262 0.265 0.253 0.357 MTLP-invsim1 0.020 0.013 0.031 0.183 0.198 0.179 0.238 0.374 0.150 0.138 0.181 0.306 MTLP-invsim2 0.020 0.014 0.031 0.170 0.192 0.172 0.235 0.351 0.101 0.082 0.147 0.259 MTLP-invsim3 0.135 0.129 0.146 0.244 0.328 0.318 0.352 0.381 0.261 0.265 0.251 0.333 HUMAN MTLPdiss0 0.144 0.133 0.165 0.273 0.248 0.247 0.250 0.383 0.224 0.259 0.156 0.317 MTLPdiss3 0.145 0.134 0.165 0.275 0.249 0.248 0.250 0.385 0.224 0.259 0.156 0.318 MTLP-invsim1 0.008 0.005 0.014 0.200 0.093 0.083 0.152 0.330 0.105 0.113 0.090 0.274 MTLP-invsim2 0.008 0.005 0.012 0.182 0.059 0.050 0.079 0.294 0.066 0.064 0.068 0.223 MTLP-invsim3 0.139 0.129 0.159 0.244 0.243 0.241 0.244 0.355 0.220 0.256 0.160 0.299 BACTERIA MTLPdiss0 0.119 0.107 0.169 0.210 0.173 0.157 0.238 0.269 0.122 0.105 0.220 0.348 MTLPdiss3 0.119 0.107 0.168 0.212 0.173 0.157 0.238 0.276 0.122 0.105 0.219 0.348 MTLP-invsim1 0.069 0.056 0.123 0.181 0.106 0.092 0.165 0.235 0.101 0.086 0.187 0.246 MTLP-invsim2 0.053 0.043 0.094 0.109 0.057 0.045 0.107 0.117 0.106 0.089 0.207 0.281 MTLP-invsim3 0.121 0.108 0.176 0.189 0.181 0.165 0.247 0.247 0.123 0.107 0.212 0.289 TABLE 4
Comparison according to average AUPRC and multilabel F-measure (Fmax) between MTLP and MTLP-inv using the semantic similarity measures
described in Section 3.2.2. ColumnAllis the average across all GO terms, column5-20is the average across GO terms with at most20positive genes, and column21-100is the average across terms with more than20positives. Best results are in boldface. Results are underlined when the
difference between MTLP and MTLP-inv is statistically significant (Wilcoxon signed rank test,p-value <0.05).
0.1 0.2 0.3 0.4 0.5 0.6 0.7 0.8 0.9 1 0.95 0.85 0.75 0.65 0.55 0.45 0.35 0.25 0.15 0.05 0.1833 0.1833 0.1837 0.1844 0.1848 0.1861 0.1888 0.1905 0.1937 0.1957 0.1834 0.1833 0.184 0.1848 0.1869 0.1884 0.1902 0.1915 0.1937 0.1954 0.1837 0.1837 0.1847 0.1852 0.1865 0.187 0.1875 0.1899 0.1934 0.1959 0.1835 0.1836 0.1839 0.1842 0.1851 0.1858 0.1871 0.1891 0.1925 0.1945 0.1836 0.1836 0.1838 0.1842 0.1853 0.1858 0.1868 0.1878 0.1892 0.1933 0.1836 0.1835 0.1839 0.1839 0.1858 0.1869 0.1884 0.1889 0.1917 0.1941 0.1835 0.1839 0.1839 0.1844 0.1863 0.1875 0.189 0.1902 0.1912 0.1922 0.1836 0.1836 0.1837 0.1854 0.1861 0.1874 0.1877 0.19 0.192 0.1936 0.1835 0.1835 0.1836 0.1837 0.1841 0.1856 0.1862 0.1873 0.1878 0.1895 0.1835 0.1835 0.1835 0.1835 0.1835 0.1847 0.1847 0.1852 0.1855 0.1857
Fig. 2. Average AUPRC values achieved by MTLP method offly data and CC GO terms when the matrixCis randomly generated. Values of
τare reported on the columns, whereas row labels show the proportion of nonzero entries in the generated matrix. The lighter the color, the larger the corresponding AUPRC value.
AUPRC variation from the different random data, with higher AUPRC when the dissimilarity matrix is denser and with larger entries (the former seems to affect the results more than the latter). This is consistent with Fact 1, since the lower the weight and/or the sparser the matrix, the closer MTLP is to LP. Finally, on randomly generated dissimilarity matrices MTLP performs even worse than LP, as we can see from Figure 4. 0.15 0.2 0.25 All 5 21 Fmax MTLP−(i) MTLP−inv−(i) MTLP−(ii) MTLP−inv−(ii) BP 0.3 0.35 0.4 All 5 21 Fmax MF 0.25 0.3 0.35 All 5 21 Fmax CC
Fig. 3. Average AUPRC performance across all GO terms (All), across GO terms with at most20positive instances (5), and across terms with more than20positives (21).
IEEE TRANSACTIONS ON COMPUTATIONAL BIOLOGY AND BIOINFORMATICS, PREPRINT. IN PRESS. ACCEPTED ON MARCH 2017. 8
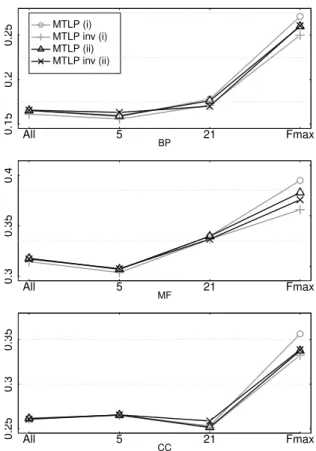
4.2.2 Grouping GO terms for multitask mapping
Following the approach proposed in [4], in addition to the strategy grouping GO terms by branch (i) adopted in the previous section, we have examined an alternative way for grouping the terms to be considered in the multitask map (6) when running MTLP algorithm. Specifically, we grouped GO terms not just by GO branch (BP, MF, and CC), but also by taking into account the number of annotated proteins (ii), obtaining6groups: BP with5-20(1119terms) and 21-100(623terms) annotations, MF 5-20 (362terms), 21-100(177terms), and CC 5-20 (267terms), 21-100(109 terms). The corresponding results onfly data are reported in Figure 3. AUPRC results show negligible differences between strategies (i) and (ii), for both MTLP and MTLP-inv. More clear is the difference in terms ofFmax, with opposite behaviour between MTLP and MTLP-inv: MTLP has worse performance in all GO branches; MTLP-inv instead tends to perform better (see for instance MF results). Indeed, black lines (grouping strategy (ii)) in correspondence ofFmaxare always between grey lines (grouping strategy (i)). However, the best results are still achieved by MTLP when grouping terms by GO branch, and accordingly we consider this strategy in the rest of the paper.
4.2.3 Prediction of GO functions for fly, human, and
bacte-ria organisms
MTLP (γ = 1) was compared with state-of-the-art graph-based methodologies applied to the prediction of protein functions. We considered: LP, the label propagation algo-rithm described in Section 3.1;COSNetM[15], an extension of a node classifier designed for unbalanced settings [36];
RW, the classicalt-step random walk algorithm [69];GBA, a method based on theguilt-by-associationassumption [23];
MS-kNN, one of the best methods in the recent CAFA2 challenge applying the kNN algorithm to each network independently, and then combining the obtained predic-tions [70].
In order to deal with label imbalance in LP, we applied a label normalization step before running label propagation. This step normalizes the labels of each GO term so that positive and negative labels sum to1. In our experiments, this variant of LP performs much better than the vanilla LP algorithm. For the RW algorithm we set the limit on the number of iterations to100, since higher values did not im-prove the performance while increasing the computational burden. Finally, we set to 5 the parameter k for the kNN algorithm, as a result of a tuning process on training data.
In Figures 4 and 5 we show the obtained results in terms of AUPRC and Fmax, on BP and CC terms respectively
(on MF terms the methods showed a similar behaviour). Interestingly, MTLP always achieves the highest AUPRC averaged over all tasks (All), with statistically significant im-provements over the second top method (p-value <0.001), except forbacteriadata and for BP terms onflydata. When comparing with LP method, the improvement is always significant, except for CC (bacteria data). COSNetM is the second method onhumanandflydata sets, while onbacteria
LP (CC) and RW (BP) rank as second method. Furthermore, and more importantly, MTLP improvements are more no-ticeable on the most unbalanced terms, which are those best
characterizing the biological functions of genes. GBA, MS-kNN and RW methods seem suffer the strongly unbalanced setting, and perform worse than LP, with the exception of RW onbacteriadata set. The good performance of COSNetM in this unbalanced setting is likely due to its cost-sensitive strategy, which requires learning two model parameters. This extra learning step increases its computation time. Indeed, COSNetM takes on average around 4 seconds on a Linux machine with Intel Xeon(R) CPU 3.60GHz and 32 Gb RAM to perform an entire cross validation cycle for one task on fly data, whereas both LP and MTLP take on average slightly less than one second. This confirms our observation that applying the mapψAafter label propagation does not
increase the algorithm complexity, and just slightly increases the execution time for computingψA.
Even in terms of FmaxMTLP obtains the best results, with LP second-best method (except on BP —fly data). This shows that our method can achieve good predictive capabilities both when predicting single GO terms and when predicting a GO multilabel for single proteins. On the other side, the compared methods tend to have competitive performance in only one scenario. For instance, RW poorly performs in terms of Fmax, whereas, unlike AUPRC,
MS-kNN achieves good Fmax results: on BP (fly data) it is the best method after MTLP. Even COSNetM, which is the second method in terms of AUPRC, achieves the third or the fourth bestFmaxrank.
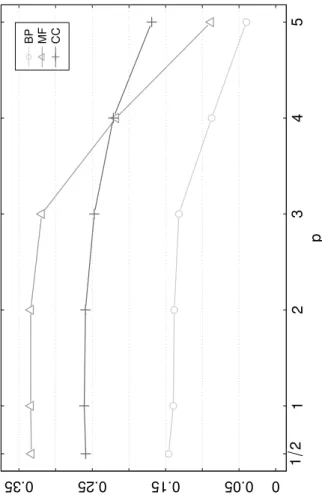
4.2.4 Evaluating different powers of the Laplacian matrix
A further experiment was carried out to analyze how MTLP performance changes when using the map ψA,p(Y) = YApforp≥ 1
2, instead ofψA(Y) =YA. We empirically
tested on thefly organism different values of p, fixing the parameterγ = 1and using thediss3 measure. The results
are shown in Figure 6. We consideredp= 1
2,2,3,4,5. Except
for BP terms, where the mapψA,1/2performs slightly better
than ψA,1, all choices of p 6= 1 lead to worse results. In
particular, the performance strongly decays forp >2.
4.2.5 Impact of parameterγ
Large values of theγparameter, introduced in Section 3.2, tend to reduce the multitask contribution encoded in A, sinceAis diagonally dominant and absolute labels assigned to positives and negatives vertices by the mapψAtend to be
almost the same (see Fact 1). Hence, this allows to “regulate” to some extent the method between multitask and singletask label propagation. We experimentally tuned γ on fly and
human data from 0.25 to 1.5 with step size 0.25. It turns out there is a negligible difference, with results reported in Table 4 and corresponding toγ= 1. This is expected, since
mis much larger than1in the considered experiments. For this reason, we also performed another experiment in which we selected a smaller subset of terms in the BP branch (a similar trend is observed for the MF and CC branches). Specifically, we ran our algorithm on a subset of42terms for theflyorganism, by varyingγin the specified range. The results are shown in Table 5. Confirming our observations, our method is more sensitive to γ values in this setting, and the overall trend is that the average AUPRC tends to decrease whenγbecomes larger (similarly toFmax). This not
5 21 All 5 21 All 5 21 All 5 21 All 5 21 All 5 21 All 0 0.05 0.1 0.15 0.2 0.25 RW GBA MS−kNN LP COSNetM MTLP FLY BP CC BP CC BP CC HUMAN BACTERIA
Fig. 4. Average AUPRC performance across all GO terms (All), across GO terms with at most20positive instances (5), and across terms with more than20positives (21). 0 0.05 0.1 0.15 0.2 0.25 0.3 0.35 RW GBA MS−kNN LP COSNetM MTLP FLY BP CC BP CC BP CC HUMAN BACTERIA
IEEE TRANSACTIONS ON COMPUTATIONAL BIOLOGY AND BIOINFORMATICS, PREPRINT. IN PRESS. ACCEPTED ON MARCH 2017. 10 p AUPRC 1 2 1 2 3 4 5 0 0.05 0.15 0.25 0.35 BP MF CC
Fig. 6. Average AUPRC values achieved by MTLP of fly data with different values of the parameterp.
γ All 5-20 20-100 0.25 0.158 0.150 0.182 0.5 0.157 0.151 0.177 0.75 0.145 0.134 0.178 1 0.144 0.133 0.178 1.25 0.140 0.130 0.175 1.5 0.139 0.129 0.174 TABLE 5
AUPRC of the MTLP method (p= 1, task similarity measurediss3
averaged across42selected MF GO terms forhumandata by varying the parameterγ. ColumnAllis the average across all tasks, column
5-20is the average across terms with at most20annotations, and column21-100is the average across terms with more than20positives.
surprising: as we explained, with large values ofγ MTLP behaves closer to LP, whose results are lower in this setting.
5
C
ONCLUSIONSWe have shown that task relatedness information repre-sented through task dissimilarity is better suited for la-bel propagation in unbalanced protein function prediction than task similarity. The proposed multitask label propaga-tion algorithm compared favourably with the state-of-the-art methodologies for protein function prediction on three model organisms. Although we gained some intuition and
collected empirical evidence, we are still invesigating the multitask problems where our approach is most effective. Specifically, it would be useful to investigate whether dis-similarity information helps when coupled with multitask algorithms different from label propagation. For example, linear learning algorithms such as SVM or Perceptron. Laplacian spectral theory is also likely to help us shed some further light on the properties of our method.
A
CKNOWLEDGMENTSThe authors would like to thank the reviewers of BIOKDD16 for useful comments on an earlier draft of this paper.
R
EFERENCES[1] N. Youngs, D. Penfold-Brown, K. Drew, D. Shasha, and R. Bon-neau, “Parametric bayesian priors and better choice of negative examples improve protein function prediction,” Bioinformatics, vol. 29, no. 9, pp. 1190–1198, 2013.
[2] M. Frasca and D. Malchiodi, “Selection of negative examples for node label prediction through fuzzy clustering techniques,” in
Advances in Neural Networks: Computational Intelligence for ICT, S. Bassis, A. Esposito, C. F. Morabito, and E. Pasero, Eds. Cham: Springer International Publishing, 2016, pp. 67–76. [Online]. Available: http://dx.doi.org/10.1007/978-3-319-33747-0 7 [3] S. Mostafavi and Q. Morris, “Using the gene ontology hierarchy
when predicting gene function,” inProceedings of the Twenty-Fifth Annual Conference on Uncertainty in Artificial Intelligence (UAI-09). Corvallis, Oregon: AUAI Press, 2009, pp. 419–427.
[4] S. Mostafavi and Q. Morris, “Fast integration of heterogeneous data sources for predicting gene function with limited annota-tion,”Bioinformatics, vol. 26, no. 14, pp. 1759–1765, 2010.
[5] M. Frasca, A. Bertoniet al., “UNIPred: unbalance-aware Network Integration and Prediction of protein functions,”Journal of Compu-tational Biology, vol. 22, no. 12, pp. 1057–1074, 2015.
[6] The Gene Ontology Consortium, “Gene ontology: tool for the unification of biology,”Nature Genet., vol. 25, pp. 25–29, 2000. [7] A. Ruepp, A. Zollner, D. Maier, K. Albermann, J. Hani, M. Mokrejs,
I. Tetko, U. Guldener, G. Mannhaupt, M. Munsterkotter, and H. Mewes, “The FunCat, a functional annotation scheme for systematic classification of proteins from whole genomes,”Nucleic Acids Research, vol. 32, no. 18, pp. 5539–5545, 2004.
[8] P. Radivojac et al., “A large-scale evaluation of computational protein function prediction,”Nature Methods, vol. 10, no. 3, pp. 221–227, 2013.
[9] Y. Jiang, T. R. Oron et al., “An expanded evaluation of protein function prediction methods shows an improvement in accuracy,”
Genome Biology, vol. 17, no. 1, p. 184, 2016. [Online]. Available: http://dx.doi.org/10.1186/s13059-016-1037-6
[10] D. Martin, M. Berriman, and G. Barton, “Gotcha: a new method for prediction of protein function assessed by the annotation of seven genomes.”BMC Bioinformatics, vol. 5, p. 178, 2004. [11] T. Hawkins, M. Chitale, S. Lubanet al., “Pfp: Automated prediction
of gene ontology functional annotations with confidence scores using protein sequence data.”Proteins, vol. 74, no. 3, pp. 566–82, 2009.
[12] A. Juncker, L. Jensen, A. Perleoni, A. Bernsel, M. Tress, P. Bork, G. von Heijne, A. Valencia, A. Ouzounis, R. Casadio, and S. Brunak, “Sequence-based feature prediction and annotation of proteins,”Genome Biology, vol. 10:206, 2009.
[13] A. Vazquez, A. Flammini, A. Maritan, and A. Vespignani, “Global protein function prediction from protein-protein interaction net-works,”Nature Biotechnology, vol. 21, pp. 697–700, 2003.
[14] R. Sharan, I. Ulitsky, and R. Shamir, “Network-based prediction of protein function,”Mol. Sys. Biol., vol. 8, no. 88, 2007.
[15] M. Frasca, “Automated gene function prediction through gene multifunctionality in biological networks,” Neurocomputing, vol. 162, pp. 48 – 56, 2015.
[16] A. Sokolov and A. Ben-Hur, “Hierarchical classification of Gene Ontology terms using the GOstruct method,”Journal of Bioinfor-matics and Computational Biology, vol. 8, no. 2, pp. 357–376, 2010.
[17] A. Sokolov, C. Funk, K. Graim, K. Verspoor, and A. Ben-Hur, “Combining heterogeneous data sources for accurate functional annotation of proteins,” BMC Bioinformatics, vol. 14, no. Suppl 3:S10, 2013.
[18] G. Obozinski, G. Lanckriet, C. Grant, J. M., and W. Noble, “Consis-tent probabilistic output for protein function prediction,”Genome Biology, vol. 9, no. S6, 2008.
[19] Y. Guan, C. Myers, D. Hess, Z. Barutcuoglu, A. Caudy, and O. Troyanskaya, “Predicting gene function in a hierarchical context with an ensemble of classifiers,” Genome Biology, vol. 9, no. S2, 2008.
[20] G. Valentini, “Hierarchical Ensemble Methods for Protein Func-tion PredicFunc-tion,” ISRN Bioinformatics, vol. 2014, no. Article ID 901419, pp. 1–34, 2014.
[21] E. Marcotte, M. Pellegrini, M. Thompson, T. Yeates, and D. Eisen-berg, “A combined algorithm for genome-wide prediction of protein function,”Nature, vol. 402, pp. 83–86, 1999.
[22] S. Oliver, “Guilt-by-association goes global,”Nature, vol. 403, pp. 601–603, 2000.
[23] B. Schwikowski, P. Uetz, and S. Fields, “A network of protein-protein interactions in yeast.”Nature biotechnology, vol. 18, no. 12, pp. 1257–1261, Dec. 2000.
[24] Y. Li and J. Patra, “Integration of multiple data sources to pri-oritize candidate genes using discounted rating systems,”BMC Bioinformatics, vol. 11, no. Suppl I:S20, 2010.
[25] P. Bogdanov and A. Singh, “Molecular function prediction using neighborhood features,”IEEE ACM Transactions on Computational Biology and Bioinformatics, vol. 7, no. 2, pp. 208–217, 2011. [26] X. Zhuet al., “Semi-supervised learning with gaussian fields and
harmonic functions,” in Proc. of the 20th Int. Conf. on Machine Learning, Washintgton DC, USA, 2003.
[27] H. Zhou and T. Hastie, “Regularization and variable selection via the elastic net,” Journal of the Royal Statistical Society B, vol. 67, no. 2, pp. 301–320, 2007.
[28] M. Szummer and T. Jaakkola, “Partially labeled classification with markov random walks,” in NIPS 2001, vol. 14, Whistler BC, Canada, 2001.
[29] A. Azran, “The rendezvous algorithm: Multi- class semi-supervised learning with Markov random walks,” inProceedings of the 24th International Confer- ence on Machine Learning (ICML), 2007. [30] E. Nabieva, K. Jim, A. Agarwal, B. Chazelle, and M. Singh, “Whole-proteome prediction of protein function via graph-theoretic analysis of interaction maps,” Bioinformatics, vol. 21, no. S1, pp. 302–310, 2005.
[31] G. Valentini, G. Armano, M. Frasca, J. Lin, M. Mesiti, and M. Re, “RANKS: a flexible tool for node label ranking and classification in biological networks,”Bioinformatics, 2016, in press. Accepted on 22 April 2016.
[32] M. Deng, T. Chen, and F. Sun, “An integrated probabilistic model for functional prediction of proteins,”J. Comput. Biol., vol. 11, pp. 463–475, 2004.
[33] K. Tsuda, H. Shin, and B. Scholkopf, “Fast protein classification with multiple networks,”Bioinformatics, vol. 21, no. Suppl 2, pp. ii59–ii65, 2005.
[34] S. Mostafavi, D. Ray, D. Warde-Farley, C. Grouios, and Q. Morris, “GeneMANIA: a real-time multiple association network integra-tion algorithm for predicting gene funcintegra-tion,” Genome Biology, vol. 9, no. S4, 2008.
[35] U. Karaozet al., “Whole-genome annotation by using evidence integration in functional-linkage networks,”Proc. Natl Acad. Sci. USA, vol. 101, pp. 2888–2893, 2004.
[36] A. Bertoni, M. Frasca, and G. Valentini, COSNet: A Cost Sensitive Neural Network for Semi-supervised Learning in Graphs. Berlin, Heidelberg: Springer Berlin Heidelberg, 2011, pp. 219–234. [Online]. Available: http://dx.doi.org/10.1007/978-3-642-23780-5 24
[37] M. Frasca, S. Bassis, and G. Valentini, “Learning node labels with multi-category hopfield networks,” Neural Computing and Applications, vol. 27, no. 6, pp. 1677–1692, 2016. [Online]. Available: http://dx.doi.org/10.1007/s00521-015-1965-1
[38] M. Belkin and P. Niyogi, “Laplacian eigenmaps for dimensionality reduction and data representation,”Neural Computation, vol. 15, pp. 1373–1396, 2002.
[39] B. Kveton, M. Valko, A. Rahimi, and L. Huang, “Semi-supervised learning with max-margin graph cuts.” in AISTATS, ser. JMLR Proceedings, Y. W. Teh and D. M. Titterington, Eds., vol. 9.
JMLR.org, 2010, pp. 421–428. [Online]. Available: http://dblp.uni-trier.de/db/journals/jmlr/jmlrp9.html#KvetonVRH10
[40] Z. Wu and M. Palmer, “Verbs semantics and lexical selection,” in Proceedings of the 32nd annual meeting on Association for Computational Linguistics. Morristown, NJ, USA: Association for Computational Linguistics, 1994, pp. 133–138. [Online]. Available: http://portal.acm.org/citation.cfm?id=981751
[41] C. Leacock and M. Chodorow, “Combining local context and wordnet similarity for word sense identification,” inMIT Press, C. Fellfaum, Ed., Cambridge, Massachusetts, 1998, pp. 265–283. [42] L. Meng, R. Huang, and J. Gu, “A review of semantic similarity
measures in wordnet,”International Journal of Hybrid Information Technology, vol. 6, no. 1, pp. 1–12, 2013.
[43] J. J. Jiang and D. W. Conrath, “Semantic Similarity Based on Corpus Statistics and Lexical Taxonomy,” inInternational Confer-ence Research on Computational Linguistics (ROCLING X), Sep. 1997, pp. 9008+. [Online]. Available: http://adsabs.harvard.edu/cgi-bin/nph-bib query?bibcode=1997cmp.lg....9008J
[44] D. Lin, “An information-theoretic definition of similarity,” in
Proceedings of the Fifteenth International Conference on Machine Learning, ser. ICML ’98. San Francisco, CA, USA: Morgan Kaufmann Publishers Inc., 1998, pp. 296–304. [Online]. Available: http://dl.acm.org/citation.cfm?id=645527.657297
[45] A. Baradaran-Heravi, K. S. Cho, B. Tolhuiset al., “Penetrance of biallelic SMARCAL1 mutations is associated with environmental and genetic disturbances of gene expression,” Human Molecular Genetics, vol. 21, no. 11, pp. 2572–2587, Jun. 2012.
[46] B. W. Busser, L. Shokri, S. A. Jeager et al., “Molecular mecha-nism underlying the regulatory specificity of a Drosophila home-odomain protein that specifies myoblast identity.” Development (Cambridge, England), vol. 139, no. 6, pp. 1164–1174, Mar. 2012. [47] J. Colombani, D. S. Andersen, and P. Lopold, “Secreted peptide
dilp8 coordinates drosophila tissue growth with developmental timing,”Science, vol. 336, no. 6081, pp. 582–585, 2012.
[48] L. E. Lundberg, M. Fiqueiredo, P. Stenberget al., “Buffering and proteolysis are induced by segmental monosomy in Drosophila melanogaster,”Nucleic Acids Research, Mar. 2012.
[49] C. Stark, B. joe Breitkreutz, T. Regulyet al., “Biogrid: a general repository for interaction datasets.” Nucleic Acids Research, no. Database-Issue, pp. 535–539, 2006.
[50] J. Yu, S. Pacifico, G. Liuet al., “DroID: the Drosophila Interactions Database, a comprehensive resource for annotated gene and pro-tein interactions,”BMC Genomics, vol. 9, no. 1, pp. 461+, Oct. 2008. [51] K. G. Guruharsha, J. Rual, B. Zhai et al., “A Protein Complex Network of Drosophila melanogaster,” Cell, vol. 147, no. 3, pp. 690–703, Oct. 2011.
[52] R. Apweiler, T. K. Attwood, A. Bairoch et al., “The InterPro database, an integrated documentation resource for protein fami-lies, domains and functional sites,”Nucleic Acids Research, vol. 29, no. 1, pp. 37–40, Jan. 2001.
[53] T. M. Bahr, G. J. Hugheset al., “Peripheral Blood Mononuclear Cell Gene Expression in Chronic Obstructive Pulmonary Disease,”
American Journal of Respiratory Cell and Molecular Biology, vol. 49, no. 2, pp. 316–323, 2013.
[54] B. V. Balgobind, M. M. Van den Heuvel-Eibrinket al., “Evaluation of gene expression signatures predictive of cytogenetic and molec-ular subtypes of pediatric acute myeloid leukemia,”Haematologica, vol. 96, no. 2, pp. 221–230, 2011.
[55] J. Bigler, H. A. Randet al., “Cross-study homogeneity of psoriasis gene expression in skin across a large expression range,” PLoS ONE, vol. 8, no. 1, pp. 1–15, 01 2013.
[56] J. Botling, K. Edlund, M. Lohr, B. Hellwig, L. Holmberg, M. Lambe, A. Berglund, S. Ekman, M. Bergqvist, F. Pontn, A. Knig, O. Fernandes, M. Karlsson, G. Helenius, C. Karlsson, J. Rahnenfhrer, J. G. Hengstler, and P. Micke, “Biomarker discovery in nonsmall cell lung cancer: Integrating gene expression profiling, meta-analysis, and tissue microarray validation,” Clinical Cancer Research, vol. 19, no. 1, pp. 194–204, 2013. [Online]. Available: http://clincancerres.aacrjournals.org/content/19/1/194.abstract [57] C. Clarke, S. F. Madden et al., “Correlating
tran-scriptional networks to breast cancer survival: a large-scale coexpression analysis,” Carcinogenesis, vol. 34, no. 10, pp. 2300–2308, 2013. [Online]. Available: http://carcin.oxfordjournals.org/content/34/10/2300.abstract [58] L. Vallat, C. A. Kemperet al., “Reverse-engineering the genetic
circuitry of a cancer cell with predicted intervention in chronic lymphocytic leukemia,” Proceedings of the National Academy of
IEEE TRANSACTIONS ON COMPUTATIONAL BIOLOGY AND BIOINFORMATICS, PREPRINT. IN PRESS. ACCEPTED ON MARCH 2017. 12 Sciences, vol. 110, no. 2, pp. 459–464, 2013. [Online]. Available:
http://www.pnas.org/content/110/2/459.abstract
[59] E. G. Cerami, B. E. Grosset al., “Pathway commons, a web resource for biological pathway data,”Nucleic Acids Research, vol. 39, no. suppl 1, pp. D685–D690, 2011.
[60] G. Wu, X. Feng, and L. Stein, “A human functional protein interaction network and its application to cancer data analysis,”
Genome Biology, vol. 11, no. 5, pp. 1–23, 2010.
[61] S. Razick, G. Magklaras, and I. M. Donaldson, “irefindex: A consolidated protein interaction database with provenance,”BMC Bioinformatics, vol. 9, no. 1, pp. 1–19, 2008. [Online]. Available: http://dx.doi.org/10.1186/1471-2105-9-405
[62] R. D. Finn et al., “The pfam protein families database: towards a more sustainable future,” Nucleic Acids Research, vol. 44, no. D1, pp. D279–D285, 2016. [Online]. Available: http://nar.oxfordjournals.org/content/44/D1/D279.abstract [63] A. I. Graham, G. Sanguinetti, N. Bramall, C. W. McLeod, and R. K.
Poole, “Dynamics of a starvation-to-surfeit shift: a transcriptomic and modelling analysis of the bacterial response to zinc reveals transient behaviour of the fur and soxs regulators,”Microbiology, vol. 158, no. 1, pp. 284–292, 2012.
[64] J. L. Robbins-Manke, Z. Z. Zdraveski, M. Marinus, and J. M. Essigmann, “Analysis of global gene expression and double-strand-break formation in dna adenine methyltransferase- and mismatch repair-deficient escherichia coli,”Journal of bacteriology, vol. 187, no. 20, pp. 7027–7037, October 2005. [Online]. Available: http://europepmc.org/articles/PMC1251628
[65] M. Babuet al., “Genetic interaction maps in escherichia coli reveal functional crosstalk among cell envelope biogenesis pathways,”
PLoS Genet, vol. 7, no. 11, pp. 1–15, 11 2011.
[66] G. Butlandet al., “esga: E. coli synthetic genetic array analysis,”
Nat Meth, vol. 5, no. 3, pp. 789–795, jan 2008.
[67] P. Hu, S. C. Jangaet al., “Global Functional Atlas of Escherichia coli Encompassing Previously Uncharacterized Proteins,” PLoS Biol, vol. 7, no. 4, pp. e1 000 096+, Apr. 2009. [Online]. Available: http://dx.doi.org/10.1371/journal.pbio.1000096
[68] T. Saito and M. Rehmsmeier, “The precision-recall plot is more informative than the roc plot when evaluating binary classifiers on imbalanced datasets,”PLoS ONE, vol. 10, no. 3, pp. 1–21, 03 2015.
[69] L. Lov´asz, “Random walks on graphs: A survey,” inCombinatorics, Paul Erd˝os is Eighty, D. Mikl´os, V. T. S ´os, and T. Sz˝onyi, Eds. Budapest: J´anos Bolyai Mathematical Society, 1996, vol. 2, pp. 353– 398.
[70] L. Lan, N. Djuric, Y. Guo, and V. S., “MS-kNN: protein function prediction by integrating multiple data sources,” BMC Bioinfor-matics, vol. 14, no. Suppl 3:S8, 2013.
Marco Frasca received his Ph.D. degree in Computer Science from University of Milano, Italy in 2012. He is currently a post-doc research fellow in Computer Science at the University of Milano. His research interests include the study of neural networks models for unbalanced clas-sification problem and the development of ma-chine learning techniques for emerging prob-lems in life sciences, such as protein function prediction, gene-disease prioritization, and drug repositioning.
Nicol `o Cesa Bianchiis professor of Computer Science at the University of Milano, Italy. He held visiting positions with UC Santa Cruz, Graz Technical University, Ecole Normale Superieure (Paris), Google, and Microsoft Research. He re-ceived a Google Research Award and a Xe-rox University Affairs Committee Award. His re-search interests include theory and applications of machine learning, sequential optimization, and algorithmic game theory. On these top-ics, he published two monographs:Prediction,
Learning, and Games and Regret Analysis of Stochastic and