DOI: 10.12928/TELKOMNIKA.v14i4.3956 1502
Received May 9, 2016; Revised November 17, 2016; Accepted November 30, 2016
SVM Parameter Optimization Using Grid Search and
Genetic Algorithm to Improve Classification
Performance
Iwan Syarif*1, Adam Prugel-Bennett*2, Gary Wills3
1
Politeknik Elektronika Negeri Surabaya, Indonesia 2,3
School of Electronics and Computer Science, University of Southampton, United Kingdom *Corresponding authors, e-mail: [email protected], [email protected], [email protected]
Abstract
Machine Learning algorithms have been widely used to solve various kinds of data classification problems. Classification problem especially for high dimensional datasets have attracted many researchers in order to find efficient approaches to address them. However, the classification problem has become very complicated and computationally expensive, especially when the number of possible different combinations of variables is so high. Support Vector Machine (SVM) has been proven to perform much better when dealing with high dimensional datasets and numerical features. Although SVM works well with default value, the performance of SVM can be improved significantly using parameter optimization. We applied two methods which are Grid Search and Genetic Algorithm (GA) to optimize the SVM parameters. Our experiment showed that SVM parameter optimization using grid search always finds near optimal parameter combination within the given ranges. However, grid search was very slow; therefore it was very reliable only in low dimensional datasets with few parameters. SVM parameter optimization using GA can be used to solve the problem of grid search. GA has proven to be more stable than grid search. Based on average running time on 9 datasets, GA was almost 16 times faster than grid search. Futhermore, the GA’s results were slighlty better than the grid search in 8 of 9 datasets.
Keywords: support vector machine, genetic algorithms, parameter optimization
Copyright © 2016 Universitas Ahmad Dahlan. All rights reserved.
1. Support Vector Machine Classifier
Classification is a supervised learning technique which learns a function from training data set that consists of input features/attributes and categorical output [1]. This function will be used to predict a class label of any valid input vector. The main goal of classification is to apply machine learning algorithms to achieve the best prediction accuracy [2].
Classification problem can be viewed as optimization problem where the goal is to find the best model that represents the predictive relationships in the data [3]. Other than the well-known classical data mining techniques such as naive Bayes, decision tree, rule induction, etc., Support Vector Machine (SVM) has gained more attention and has been adopted in data classification problems in order to find a good solution. [4] reported that SVM has been proven to perform much better when dealing with high dimensional datasets.
SVM is an emerging data classification technique which is proposed by [5], has been widely adopted in various fields of classification. The SVM algorithm has an advantage that it is not affected by local minima, furthermore it does not suffer from the curse of high dimensionality because of the use of support vectors [6]. Unfortunately, the SVM performance highly depends on parameter setting and its kernel selection. The selection quality of SVM parameters and kernel functions have an effect on the learning and generalization performance [7]. The SVM algorithm is explained more details in [8].
2. Parameter Optimization
Generally, most of machine learning algorithms will not achieve optimal results if their parameters are not being tuned properly. To build a high accuracy classification model, it is very important to choose a powerful machine learning algorithm as well as adjust its parameters.
Parameter optimization can be very time consuming if done manually especially when the learning algorithm has many parameters [9, 10]. The largest problems encountered in setting up the SVM model are how to select the kernel function and its parameter values. Inappropriate parameter settings lead to poor classification results.
In this paper, we used two methods to adjust the SVM parameter: grid search with cross-validation and Genetic Algorithms (GA).
2.1. Parameter Optimization using Grid Search
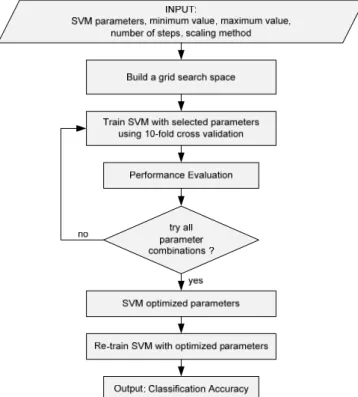
The grid search is originally an exhaustive search based on defined subset of the hyper-parameter space. The hyper-parameters are specified using minimal value (lower bound), maximal value (upper bound) and number of steps. There are three different scales that can be used: linear scale, quadratic scale and logarithmic scale. The performance of every combination is evaluated using some performance metrics.
Figure 1. SVM parameter using GRID search
Grid search optimizes the SVM parameters (C, , degree, etc.) using a cross validation (CV) technique as a performance metric. The goal is to identify good hyper-parameter combination so that the classifier can predict unknown data accurately. According to [11], the cross-validation technique can prevent the over-fitting problem.
To choose C and using k-fold CV, we first split the available data into k subsets (in most experiments we set k=10). One subset is used as a testing data and then evaluated using the remaining k-1 training subsets. Then we calculate the CV error using this split error for the SVM classifier using different values of C, and other parameters. Various combination of hyper-parameters value are entered and the one with the best cross-validation accuracy (or the lowest CV error) is selected and used to train an SVM on the whole dataset.
In linear kernel there is only one important parameter to optimize which is C, in RBF kernel and sigmoid kernel there are 2 parameters: C and while polynomial kernel has 3 parameters: C, and degree. Actually there are more than three parameters but selecting more parameters and a large number of steps (or possible values of parameters) result in a huge number of combinations. For example, if we choose to optimize 5 parameters and 25 steps for
TELKOMNIKA Vol. 14, No. 4, December 2016 : 1502 – 1509
each parameter, then the total combinations would be 255 or 9,765,625 which requires a huge amount of time. The SVM parameter optimization using grid search is explained in Figure 1.
One of the biggest problems of SVM parameter optimization is that there are no exact ranges of C and values. We believe that the wider the parameter range is, the more possibilities the grid search method has of finding the best combination parameter. Therefore, in our experiment we decided to make the range of C and from 0.001 to 10,000.
2.2. Parameter Optimization using Genetic Algorithm
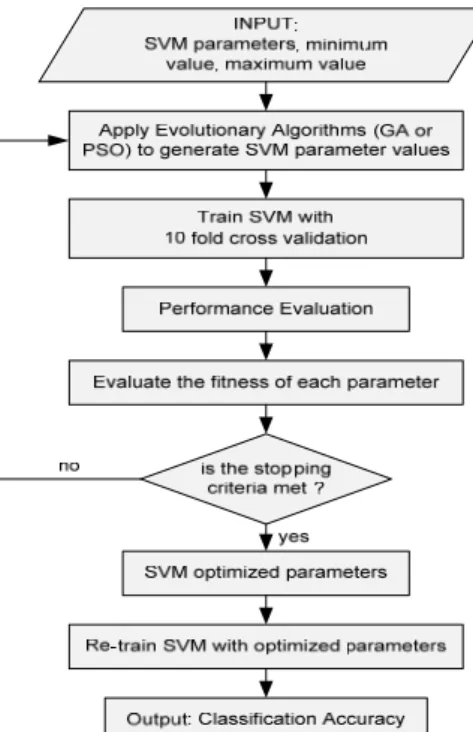
The GA which was firtsly proposed by John Holland in the 1975, is a method for solving optimization problems that is based on natural selection, the process that drives biological evolution. GA can also be used for SVM parameter optimization. GA searches the best parameters but not naively like a brute-force or grid search. GA is very useful to implement when the best ranges and dependencies of various SVM parameters are not known at all. GA is more appropriate than grid search which is very time consuming because it tries too many combinations of parameters. The parameter optimization using GA algorithm is explained in the Figure 2.
Figure 2. Parameter Optimization using Evolutionary Algorithm
3. Experimental Settings 3.1. Datasets
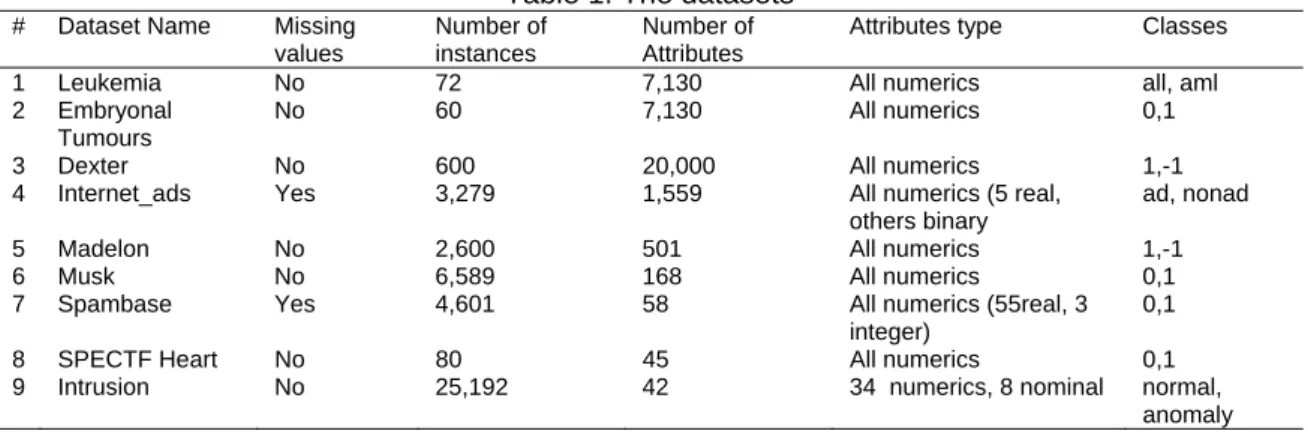
We used nine dimensional datasets which have the number of features from 45 attributes (the smallest) until 20,000 attributes (the highest). The list of datasets are shown in Table 1.
Dexter, internet_ads, madelon, musk, spambase, SPECTF heart and intrusion datasets were downloaded from UCI Machine Learning Repository while leukemia and embryonal tumours datasets were from BioInformatics Group Seville (BIGS).
Table 1. The datasets
# Dataset Name Missing
values
Number of instances
Number of Attributes
Attributes type Classes
1 Leukemia No 72 7,130 All numerics all, aml
2 Embryonal Tumours
No 60 7,130 All numerics 0,1
3 Dexter No 600 20,000 All numerics 1,-1
4 Internet_ads Yes 3,279 1,559 All numerics (5 real,
others binary
ad, nonad
5 Madelon No 2,600 501 All numerics 1,-1
6 Musk No 6,589 168 All numerics 0,1
7 Spambase Yes 4,601 58 All numerics (55real, 3
integer)
0,1
8 SPECTF Heart No 80 45 All numerics 0,1
9 Intrusion No 25,192 42 34 numerics, 8 nominal normal,
anomaly
3.2. Performance Metric
The metric used to evaluate the performance of SVM is given in Table 2 [12]:
Table 2. Performance metric Actual Result
True False Predicted
Result
True True Positive (TP) False Positive (FP)
False False Negative (FN) True Negative (TN)
We use accuracy, precision, recall and F-measure as performance measurement which shown in Table 3.
Table 3. Classification performance measurement
Measure Formula Precision TP TP FP Recall / Sensitivity / TP TP FN Selectivity TN FP TN Accuracy TP TN TP TN FP FN
F-Measure 2 ∗ Precision ∗ Recall
Precision Recall
3.3. Experimental Results
In the beginning, we apply feature selection algotihms to all data sets. After that, we run SVM with three different configuration: SVM with default parameters, SVM with grid search optimization and SVM with GA optimization. The results are explained in the following sections.
3.3.1. Feature Selection Algorithms
Before we applied SVM into high dimensional datasets, we used feature selection algorithms to reduce the number of attributes. Feature selection algorithm is a popular technique used to find the most important and optimal subset of features for building powerful learning models. An efficient feature selection method can eliminate irrelevant and redundant data.
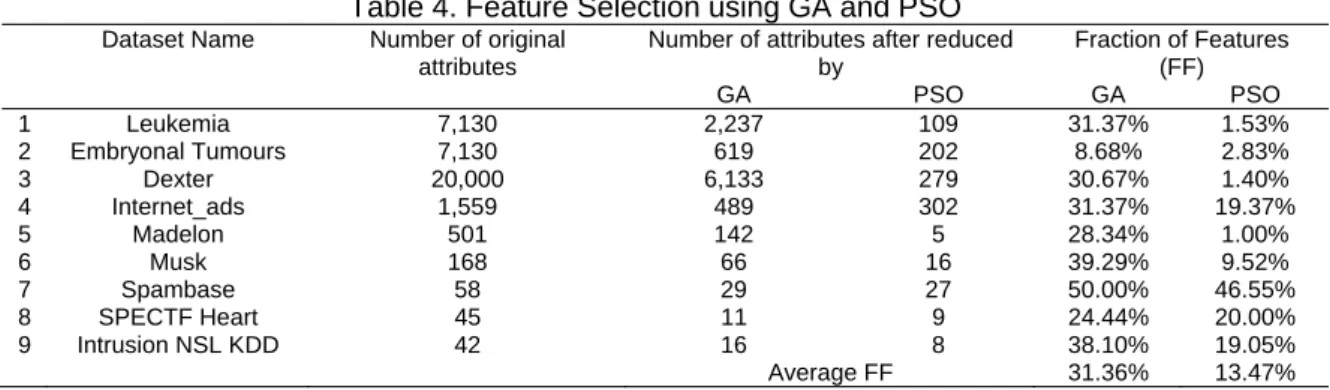
In our previous experiments [13], we applied two feature selection algorithms which are Genetic Algorithm (GA) and Particle Swarm Optimization (PSO) and the results are shown in Table 4.
TELKOMNIKA Vol. 14, No. 4, December 2016 : 1502 – 1509
Table 4. Feature Selection using GA and PSO
Dataset Name Number of original
attributes
Number of attributes after reduced by Fraction of Features (FF) GA PSO GA PSO 1 Leukemia 7,130 2,237 109 31.37% 1.53% 2 Embryonal Tumours 7,130 619 202 8.68% 2.83% 3 Dexter 20,000 6,133 279 30.67% 1.40% 4 Internet_ads 1,559 489 302 31.37% 19.37% 5 Madelon 501 142 5 28.34% 1.00% 6 Musk 168 66 16 39.29% 9.52% 7 Spambase 58 29 27 50.00% 46.55% 8 SPECTF Heart 45 11 9 24.44% 20.00% 9 Intrusion NSL KDD 42 16 8 38.10% 19.05% Average FF 31.36% 13.47%
Table 4 shows that both GA and PSO have successfully reduced the number of attributes of all data sets, where GA reduced the number of attributes to 31.36% of original data in average while PSO was 13.47% in average. Therefore, in all of our experiments below, we used datasets which have been reduced by PSO.
3.3.2. SVM with Default Parameters
We used LibSVM function provided by RapidMiner Machine Learning Tools and applied this algorithm into 9 datasets with the default parameters and using four different kernels which are linear, RBF, sigmoid and polynomial kernels. The results are shown in Table 5.
Table 5. SVM with default parameters
No PSO-reduced datasets SVM kernels
Linear RBF Polynomial Sigmoid
F Measure F Measure FMeasure F Measure
1 Leukemia 74.11% 84.25% 80.94% 66.67% 2 Embryonal Tumours 74.50% 76.67% 74.50% 76.67% 3 Dexter 74.92% 68.70% 63.00% 53.18% 4 Internet_ads 96.81% 92.19% 96.81% 95.08% 5 Madelon 61.45% 65.59% 60.55% 66.67% 6 Musk 91.29% 96.58% 93.03% 78.74% 7 Spambase 79.70% 84.91% 73.90% 64.84% 8 SPECTF Heart 74.11% 84.25% 80.94% 66.67% 9 Intrusion NSL KDD 26.70% 94.41% 40.03% 84.44%
SVM with RBF kernel achieved the best results in 5 of 9 datasets while other three kernels (linear, polynomial and sigmoid) achieved best results in 2 of 9 datasets. In embryonal tumours dataset, RBF kernel and sigmoid kernel have the same results.
3.3.3. SVM Parameter Optimization Using Grid Search
In the second experiments, we applied parameter optimization of SVM using grid search. Grid search is used to optimized C parameter (in linear kernel), C and gamma parameter (in RBF and sigmoid kernels) and C, gamma & degree (in polynomial kernel). The parameter ranges for experiments is explained in Table 6.
Table 6. Hyper parameters range for experiments
Parameters Kernel Min Max Type Steps Scale
C linear 0.001 10,000 Real 10 logarithmic or logarithmic legacy
gamma Linear, RBF, sigmoid 0.001 10,000 Real 10 logarithmic or logarithmic legacy
degree polynomial 1 5 Integer 1 Linear (1,2,3,4,5)
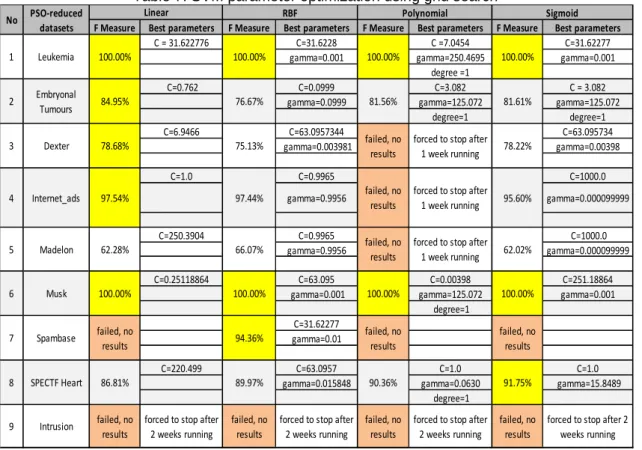
The SVM parameter optimization using Grid Search experimental results are shown in Table 7. Compare to the previous results (please see Table 5), the SVM parameter optimization
using grid search gives significant improment. In leukemia dataset, grid search improved the measure from 84.25% to 100%. In embryonal tumours dataset, grid search improved the F-measure from 76.67% to 84.95% and in musk dataset grid search improved the F-F-measure from 95.68% to 100%. Overall, grid search was able to significantlty improve the classification performance on 8 of 9 datasets. However, grid search was failed to find the best SVM parameters on intrusion dataset.
This experiment shows that the grid search always finds near optimal parameter combination within the given ranges, unfortunately it is very time consuming. If the dimension of datasets is quite high or the number of parameter combinations is huge, the grid search might be never finished as it happened in intrusion dataset for all kernels and also in dexter, internet_ads, madelon and spambase datasets for polynomial kernel. Therefore, eventhough grid search gives excellent results in almost all datasets, but it is reliable only in low dimensional dataset with few parameters.
Table 7. SVM parameter optimization using grid search
3.3.4. Parameter Optimization Using Genetic Algorithm
We used GA function provided by RapidMiner Machine Learning Tools to adjust the SVM parameters with the default parameters as follows:
1. Max generations: sets the number of generations for process termination, the default value is 50
2. Population size: specifies the population size or the number of individuals per generation, the default value is 5
3. Tournament fraction: specifies the fraction of the current population which should be used as tournament members, the default value is 0.25
4. Crossover prob: specifies the probability for an individual to be selected for crossover, the default value is 0.9
5. Mutation type: there are three mutation types which are Gaussian mutation, switching mutation and sparsity mutation. We used the default value: Gaussian mutation
F Measure Best parameters F Measure Best parameters F Measure Best parameters F Measure Best parameters C = 31.622776 C=31.6228 C =7.0454 C=31.62277
gamma=0.001 gamma=250.4695 gamma=0.001 degree =1
C=0.762 C=0.0999 C=3.082 C = 3.082 gamma=0.0999 gamma=125.072 gamma=125.072
degree=1 degree=1 C=6.9466 C=63.0957344 C=63.095734 gamma=0.003981 gamma=0.00398 C=1.0 C=0.9965 C=1000.0 gamma=0.9956 gamma=0.000099999 C=250.3904 C=0.9965 C=1000.0 gamma=0.9956 gamma=0.000099999 C=0.25118864 C=63.095 C=0.00398 C=251.18864 gamma=0.001 gamma=125.072 gamma=0.001
degree=1 C=31.62277
gamma=0.01
C=220.499 C=63.0957 C=1.0 C=1.0 gamma=0.015848 gamma=0.0630 gamma=15.8489
degree=1 forced to stop after
2 weeks running
forced to stop after
2 weeks running
forced to stop after
2 weeks running
forced to stop after 2
weeks running forced to stop after
1 week running 100.00% 100.00% 97.44% 95.60% 62.28% 66.07% 62.02% 100.00% 100.00% 84.95% 81.56% 81.61% failed, no results failed, no results failed, no results 78.68% 75.13% 78.22%
97.54% forced to stop after 1 week running forced to stop after
1 week running failed, no results 8 SPECTF Heart 9 Intrusion 94.36% failed, no results failed, no results failed, no results 86.81% 89.97% 90.36% 91.75% 3 Dexter 4 Madelon 6 Musk failed, no results failed, no results failed, no results 100.00% 100.00% 100.00% Internet_ads 5 Sigmoid No PSO‐reduced datasets 1 Leukemia 7 Spambase Linear RBF Polynomial 2 Embryonal Tumours 76.67% 100.00%
TELKOMNIKA Vol. 14, No. 4, December 2016 : 1502 – 1509
6. Selection type: there are eight different selection types which are union, cut, roulette wheel, stochastic universal sampling, Bolztmann, rank and tournament (default value).
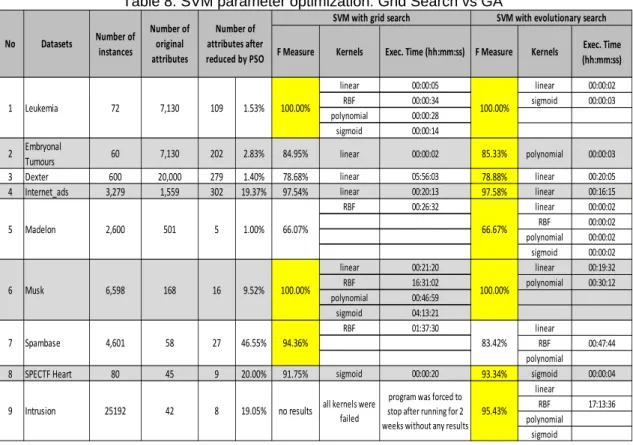
The experimental results of SVM parameter optimization using GA are shown in Table 8.
Table 8. SVM parameter optimization: Grid Search vs GA
In the previous experiment, grid search had failed because of very long execution time and returned no results when applied to intrusion (all four kernels), spambase (linear, polynomial and sigmoid kernel), madelon (polynomial kernel), internet_ads (polynomial kernel) and dexter (polynomial kernel) datasets. In the current experiment, GA has proven to be more stable than grid search.
In leukemia and musk datasets, grid search achieved 100% accuracy in 4 kernels while GA achieved 100% accuracy in 2 kernels. From these 2 datasets results, we can see that linear kernel is much faster than other kernels (RBF, polynomial and sigmoid kernels). In embryonal tumours, dexter, internet_ads, SPECTF Heart and intrusion datasets, evolutionary search has slightly better accuracy but much faster execution time. Only in 1 dataset (spambase) grid search has better accuracies than the GA.
However, in the madelon and the intrusion datasets GA could not guarantee good results for all kernels because the classification performances were not so good (in madelon datasets the F-measure is only 66.67% and in intrusion dataset the F-measure is only 61.31%).
4. Conclusion
Although SVM work well with default value, the performance of SVM can be improved significantly using parameter optimization. One of the biggest problems of SVM parameter optimization is there is no exact ranges of C and values. We believe that the wider the parameter range is, the more possibilities the grid search method finds the best combination parameter.
Our experiment shows that the grid search always finds near optimal parameter combination within given ranges. SVM parameter optimization using grid search is very powerful
F Measure Kernels Exec. Time (hh:mm:ss) F Measure Kernels Exec. Time (hh:mm:ss) linear 00:00:05 linear 00:00:02 RBF 00:00:34 sigmoid 00:00:03 polynomial 00:00:28 sigmoid 00:00:14 2 Embryonal
Tumours 60 7,130 202 2.83% 84.95% linear 00:00:02 85.33% polynomial 00:00:03 3 Dexter 600 20,000 279 1.40% 78.68% linear 05:56:03 78.88% linear 00:20:05 4 Internet_ads 3,279 1,559 302 19.37% 97.54% linear 00:20:13 97.58% linear 00:16:15
RBF 00:26:32 linear 00:00:02 RBF 00:00:02 polynomial 00:00:02 sigmoid 00:00:02 linear 00:21:20 linear 00:19:32 RBF 16:31:02 polynomial 00:30:12 polynomial 00:46:59 sigmoid 04:13:21 RBF 01:37:30 linear RBF 00:47:44 polynomial
8 SPECTF Heart 80 45 9 20.00% 91.75% sigmoid 00:00:20 93.34% sigmoid 00:00:04 linear RBF 17:13:36 polynomial sigmoid 9.52% 46.55% 19.05% 6,598 4,601 25192 Number of original attributes 7,130 501 168 58 42 109 5 16 27 8 Number of attributes after reduced by PSO 95.43%
SVM with evolutionary search
9 Intrusion no results all kernels were failed
program was forced to stop after running for 2 weeks without any results
6 Musk 100.00% 100.00%
7 Spambase 94.36% 83.42%
1
No Datasets
SVM with grid search
Leukemia 100.00%
Number of
instances
72 1.53% 100.00%
and it is able to improve the accuracy significantly. However, grid search has several disadvantages, it is extremely slow and furthermore it may lead to very long execution time. For example, grid search has been failed in finding optimal SVM parameters for intrusion dataset which has a large number of instances. The process was forced to stop after 2 weeks running. Therefore, grid search is very reliable only in low dimensional dataset with few parameters. To solve this problem, we use Genetic Algorithm (GA) which is very useful to implement when the best ranges and dependencies of various SVM parameters is not known at all. GA has proven to be more stable than grid search. When applied to 9 datasets, GA has an average running time of 294 seconds while grid search is around 4,680 seconds (it does not include intrusion dataset which was failed). It means, SVM parameter optimization using GA is more than 15.9 times faster than using grid search.
References
[1] Gaber M, Zaslavsky A, Krishnaswamy S. A Survey of Classification Methods in Data Streams. In: Aggarwal C. Editors. Data Streams, Advances in Database Systems. US: Springer. 2007: 39-59. [2] Williams NZS, Armitage G. A Preliminary Performance Comparison of Five Machine Learning
Algorithms for Practical IP Traffic Flow Classification. Computer Communication Review. 2006; 30. [3] Otero FEB, Freitas AA, Johnson CG. Inducing decision trees with an ant colony optimization
algorithm. Applied Soft Computing. 2012; 12: 3615-3626.
[4] Ding S, Chen Li. Intelligent Optimization Methods for High-Dimensional Data Classification for Support Vector Machine. Intelligent Information Managament. 2010; 2(6).
[5] Cortes C, Vapnik V. Support-Vector Networks. Mach. Learn. 1995; 20: 273-297.
[6] Sánchez AVD. Advanced support vector machines and kernel methods. Neurocomputing. 2003; 55: 5-20.
[7] Sudheer C, Maheswaran R, Panigrahi BK, Mathur S. A hybrid SVM-PSO model for forecasting monthly streamflow. Neural Computing and Applications. 2013.
[8] Chang CC, Lin CJ. LIBSVM: A library for support vector machines. ACM Trans. Intell. Syst. Technol. 2011; 2(27): 1-27.
[9] Friedrichs F, Igel C. Evolutionary tuning of multiple SVM parameters. Neurocomputing. 2005; 64: 107-117.
[10] Rossi ALD, de Carvalho ACP. Bio-inspired Optimization Techniques for SVM Parameter Tuning. In 10th Brazilian Symposium on Neural Networks, 2008. SBRN ’08. Presented at the 10th Brazilian Symposium on Neural Networks, 2008. SBRN ’08. 2008: 57-62.
[11] Lin SW, Ying KC, Chen SC, Lee ZJ. Particle swarm optimization for parameter determination and feature selection of support vector machines. Expert Systems with Applications. 2008; 35: 1817-1824.
[12] Davis J, Goadrich M. The relationship between Precision-Recall and ROC curves. In Proceedings of the 23rd International Conference on Machine Learning, ICML ’06. New York, NY, USA. 2006: 233-240.
[13] Syarif I. Dimensionality Reduction Algorithms on High Dimensional Datasets. EMITTER International Journal of Engineering Technology. 2014; 2(2).