Do Code Smells Impact the Effort of Different
Maintenance Programming Activities?
Z´ephyrin Soh
∗, Aiko Yamashita
†, Foutse Khomh
∗, and Yann-Ga¨el Gu´eh´eneuc
∗ ∗Department of Computer and Software Engineering, Polytechnique de Montreal{zephyrin.soh,foutse.khomh,yann-gael.gueheneuc}@polymtl.ca
†Department of Information Technology, Oslo and Akershus University College of Applied Sciences, Oslo, Norway
Abstract—Empirical studies have shown so far that code smells have relatively low impact over maintenance effort at file level. We surmise that previous studies have found low effects of code smells because the effort considered is a “sheer-effort” that does not distinguish between the kinds of developers’ activities. In our study, we investigate the effects of code smells at the activity level. Examples of activities are: reading, editing, searching, and navigating, which are performed independently over different files during maintenance. We conjecture that structural attributes represented in the form of different code smells do indeed have an effect on the effort for performing certain kinds of activities. To verify this conjecture, we revisit a previous study about the impact of code smell on maintenance effort, using the same dataset, but considering activity effort. Six professional developers were hired to perform three maintenance tasks on four functionally equivalent Java Systems. Each developer performs two maintenance tasks. During maintenance task, we monitor developers’ logs. Then, we define an annotation schema to identify developers’ activities and assess whether code smells affect different maintenance activities. Results show that different code smells affect differently activity effort. Yet, the size of the changes performed to solve the task impacts the effort of all activities more than code smells and file size. While code smells impact the editing and navigating effort more than file size, the file size impacts the reading and searching activities more than code smells. One major implication of these results is that if code smells indeed affect the effort of certain kinds of activities, it means that their effects are contingent on the type of maintenance task at hand, where some kinds of activities will become more predominant than others.
Index Terms— code smells; programming activity; mainte-nance effort; program comprehension; software quality.
I. INTRODUCTION
Code smells are indicators of underlying structural short-comings that can negatively impact the maintainability of a software system. Several empirical studies investigated the effects of code smells on different aspects of maintainability, one of them being maintenance effort.
Abbes et al. [1] observed that “God Class” and “Spaghetti Code” alone have no effect on comprehension effort while the combination of them significantly increase the effort and decrease the accuracy of comprehension tasks. Sjøberg et al. [2] examined the relation between code smells in files and maintenance effort and concluded that the impact of code smells over maintenance effort is limited. Sjøberg et al. [2] also concluded that other factors, such as size (LOC) or number of revisions, are better indicators of maintenance
effort. The previous studies bear a noteworthy limitation, since the effort considered was a “sheer-effort”, which does not distinguish between the kinds of activities performed on a file. Thus, our goal is to investigate the effects of code smells at a different level of granularity:i.e.,at activity level. To achieve our goal stated above, we analyse the same dataset from a previous empirical study [2] but this time, distinguishing the effort amongst the different activities. The study consist of given professional developers to perform maintenance task on Java systems. Six developers perform three maintenance tasks on four functionally equivalent Java systems. When developers perform the tasks, we collect their logs using Eclipse Mimec plugin. We want to annotate the logs and derive maintenance activities. Thus, we perform some think aloud sessions with the goal of validation our annotation. We define an annotate schema to generate reading, editing, searching, and navigating activities. We assess the effort spent by developers to perform each kind of activity and, using multiple linear regression, we study how code smells impact the effort spent performing each king of activity.
We find that different code smells significantly impact the effort of different activities. For example, “Feature Envy” affects searching effort, and “Data Clumps” affects editing effort. Editing, navigating, and reading effort are affected by three smells: “Feature Envy”, “God Class”, and “ISP Violation”.
We find that the effect of code smells on editing and navigating effort is in fact larger than file size, whiles the opposite is the case for reading and searching effort. We conclude that developers and tool providers should be wary of the presence of code smells because they impact the change-and fault-proneness of classes [3] but also the developers’ efforts during their different activities. One major implication of our results is that if code smells indeed affect the effort of certain kinds of activities, it means that their effects are contingent on the type of maintenance task at hand, where certain activities will become more predominant than others.
We organised the paper as follows: Section II describes related work; Section III provides details on our study; Section IV reports our results; Section V discusses threats to validity. Finally, Section VI concludes with future work.
II. RELATEDWORK
Code smells—such as those defined by Fowler [4]—have been proposed to embody poor design choices. These code smells stem from experienced software developers’ expertise and are reported to negatively impact systems. For example, Khomh et al. [5] found that there is a strong correlation between code smells and the change-proneness of source code files. Tabaet al.[6] and D’Ambroset al.[7] found that source code files that contain anti-patterns tend to be more change-and fault-prone than other source code files [3, 5].
A common code smell is the God Class, which is a class that takes too many responsibilities relative to the classes with which it is coupled. The God Class centralizes the system functionality in one class, which contradicts the decomposition design principles. Another example of code smell is the Shotgun Surgery. A class is affected by the Shotgun Surgery smell when a change in the class results in the need to make a lot of little changes in several other classes.
The literature related to code smells generally falls into three categories: (1) the detection of code smells (e.g.,[8, 9]); (2) the evolution of code smells in software systems (e.g., [10– 12]) and their impact on software quality (e.g.,[3, 5, 6, 13]); and (3) the relationship between code smells and software development activities (e.g.,, [1, 2]). Our work in this paper falls into the third category – we aim to understand the effect of code smells on the effort required to perform certain kinds of activities (e.g.,Editing, Navigating, Reading, or Searching). Previous studies have investigated the effects of individual code smells on maintenance effort. Deligiannis et al. [14] conducted an observational study where four participants evaluated two systems, one compliant and one non-compliant to the principle of avoiding God classes, and concluded that familiarity with the application domain plays an important role when judging negative effects on completeness, correctness and consistency during comprehension tasks. Lozano and Wermelinger [15] compared the maintenance effort of methods during periods when they did not contained a clone and when they did contained a clone. They found that there was no increase in the maintenance effort in 50% of the cases. Abbes et al. [1] conducted an experiment in which twenty-four students and professionals were asked questions about the code in six open-source systems. They concluded that God classes and God methods in isolation had no effect on effort or quality of the responses, but when appearing together they led to a statistically significant increase in response effort. Sjøberget al.[2] investigated the effects of 12 code smells on maintenance effort at file level, and found that, after adjusting for file size and the number of changes (revisions) as quality predictor, none of the code smells remained a significant driver of effort. In contrast, the code smell Refused Bequest con-tributed significantly to less effort. Although Sjøberg analyzes the effects of code smells on effort at file level, they calculated the sheer effort, which do not distinguish between the efforts on performing different maintenance activities (Navigating, Editing, Reading, etc) on a file. This study intends to extend
TABLE I
LOCPER FILE TYPE FOR ALL FOUR SYSTEMS.
Systems A B C D
Java 8,205 26,679 4,983 9,960
JSP 2,527 2,018 4,591 1,572
Others 371 1,183 1,241 1,018
Total 11,103 29,880 10,815 12,550
the study by Sjøberget al.by exploring the effects of the same code smells on the effort employed on specific maintenance activities performed in a file during maintenance.
III. STUDYDEFINITION ANDDESIGN
To evaluate the effect of code smells on the effort required to perform certain kinds of maintenance activities, we answer the following research question: Do code smells affect the effort required to edit, navigate, read, or search for information during a maintenance task? We set up an experiment whose variables are the activity effort, the size of the files, and the size of the changes performed to the source code of four systems. A. Systems Under Study
The Software Engineering Department at Simula Research Laboratory sent a call for bids in 2003 for the development of a new Web-based information system to keep track of their empirical studies. Based on the bids, four Norwegian consultancy companies were hired to independently develop a version of the system, all using the same requirements. More details on the initial project can be found in [16]. The four functionally-equivalentsystems are designated as Systems A, B, C, and D. They were primarily developed in Java and had similar three-layered architectures but had considerable differences in their designs and implementations as shown in Table I, which displays the physical lines of code (LOC) for all the different types of files in the systems (Java, JSP, and other files, such as XML and HTML).
The main functionality of the systems was keeping a record of the empirical studies and related information at Simula (e.g., the researchers responsible for the studies, participants, data collected, and publications resulting from the studies). Another functionality was to generate a graphical report on the number of studies conducted per year. The systems were all deployed over Simula Research Laboratories’ Content Management System (CMS), which at that time was based on PHP and a relational database system. The systems had to connect to a database in the CMS to access data related to researchers at Simula as well as information on the publications therein. B. Maintenance Tasks and Developers
In 2008, Simula Research Laboratory introduced a new CMS called Plone [17] and, consequently, it was no longer possible for the systems to remain operational. The systems had to be adapted to the new environment, giving the op-portunity to conduct and observe a real-life Maintenance Project. This project was commissioned to two companies, one in Czech Republic and one in Poland. The functional
Developer
Round 1
1 2 3 4 5 6
A
B
C
D
C
A
2
D
A
D
C
B
B
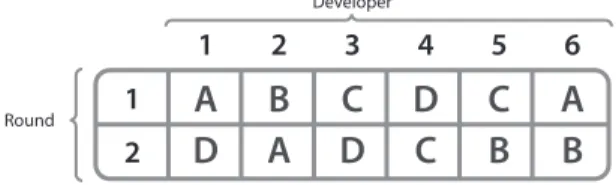
Fig. 1. Assignment of systems to developers in the case study.
similarity (Note that the systems werefunctionally equivalent because they were developed using the same requirements specification) of the systems allowed the investigation of cases with very similar contexts (e.g.,identical tasks and pro-gramming language and similar development environments) and the differences in the systems designs allowed observing the effect of code smells on the effort to conduct different types of maintenance activities. The maintenance project was conducted at the companies sites and the second author of this paper was present in both sites during the entire duration of the project, acting as a Simula representative and conducting the study.
Three tasks were implemented during the project. The first two tasks consisted of adapting the systems to the new platform and the third task consisted of adding a new functionality (See [18] for more details on the maintenance tasks). The project had a total cost of 50.000 Euros, and the maintenance tasks were conducted between September and December 2008. Six different developers completed the three maintenance tasks individually. The developers were recruited from a pool of 65 participants of a previously completed study on programming skill [19]. All the selected developers had been evaluated to have a similar good level of development skill, and of English skill for the purpose of the study.
C. Activities, Tools, and Assignment of Developers to Systems Initially, the developers were given an overview of the project (e.g.,the maintenance project goals, tasks). They also completed a questionnaire and a set of programming exercises to familiarize themselves with the domain of the systems. A specification was given to the developers for each maintenance task and, when needed, they discussed it with the researcher present on site. An acceptance test was conducted once all the tasks were completed for one system. The development tool used was MyEclipse [20]. To collect more observation points, each of the six developers was asked to first conduct all tasks in one system (in the order that they were presented in Table II) and then to repeat the same maintenance tasks on a second system (the criteria for system assignment can be found in [18]). Thus, we make a distinction between first-round cases and second-round cases. “First round” denotes a case in which a developer has not maintained any of the systems previously, and “second round” denotes a case in which developers repeat the tasks on a second system. Figure 1 describes the order in which the systems were assigned to each developer.
TABLE III
VARIABLES INVOLVED IN THE STUDY
Types Variables
Dependent variable Effort (time) in: Editing, Navigating, Reading, Searching.
Independent variable Number (or presence) of smells of 12 types in the files on which the developers worked on during the maintenance tasks.
Control variables System, Developer, Round, File size (LOC), Revisions (predictor of quality).
D. Variables and Data Collection
Table III shows the variables in the study. The variables were measured at file level. The remainder of this section describes in detail the variables that we measured alongside with the procedure followed to collect each of the variables.
D.1. Independent Variables – Twelve types of code smells were extracted from the systems by using Borland To-gether [21] and InCode [22] and used as independent variables. Table IV describes the code smells [4, 23, 24] that were detected in the systems and their scale types. A design princi-ple violation called Interface Segregation Principrinci-ple Violation (a.k.a. ISP Violation) was included [23] because it can be considered as an essential indicator of maintenance problems and because Borland Together could detect it.
As can be seen from Table IV, all code smells, except Feature Envy, were treated as binary variables because most of the smells are binary by nature (i.e., present = 1, not present = 0) and because the majority of the non-binary code smells had only one to two occurrences per file. This means that we would not gain much in explanatory power when increasing the complexity of the model to include the amount of observations of a code smell in a file. We applied Natural logarithm to the Feature Envy variable to avoid strong effects from few very high values.
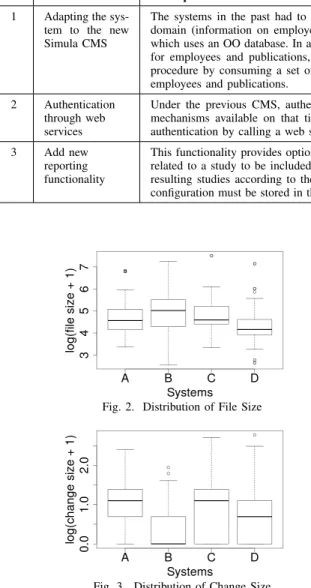
D.2. Control Variables – In addition to the code smell, we included a variable reflecting the file size, measured as the number of lines of code (LOC) including comments and blank lines, and a variable reflecting the size of the task (number of revisions) on a file. The number of revisions measures the number of changes (commits) performed to fix the task. The developers were asked to commit at least once a day and ensure that the revision would compile without errors before the commit [2]. We use the number of revisions to measure the size of the task because Emam [25] reports against using code churn (LOC added and delete) to measure effort. Consideration of blank lines when computing the LOC was due to a tool limitation. However, we consider that when there are long files with extra white lines in between, the size effect can be exacerbated by the presence of additional blank spaces. These variables were measured using SVNKit [26] (a Java library for requesting information to Subversion). These variables were used to adjust for an increase of likelihood of a file requiring more effort because of a large size or a large number of changes in the file. Both variables are log-transformed to avoid large influence from a few very high values. Figure 2 shows
TABLE II MAINTENANCE TASKS
No. Task Description
1 Adapting the sys-tem to the new Simula CMS
The systems in the past had to retrieve information through a direct connection to a relational database within Simula’s domain (information on employees at Simula and publications). Now Simula uses a CMS based on the Plone platform, which uses an OO database. In addition, the Simula CMS database previously had unique identifiers based on Integer type, for employees and publications, as now a String type is used instead. Task 1 consisted in modifying the data retrieval procedure by consuming a set of web services provided by the new Simula CMS in order to access data associated with employees and publications.
2 Authentication through web services
Under the previous CMS, authentication was done through a connection to a remote database and using authentication mechanisms available on that time for the Simula Web site. This maintenance task consisted of replacing the existing authentication by calling a web service provided for this purpose.
3 Add new
reporting functionality
This functionality provides options for configuring personalized reports, where the user can choose the type of information related to a study to be included in the report, define inclusion criteria based on people responsible for the study, sort the resulting studies according to the date that they were finalized, and group the results according to the type of study. The configuration must be stored in the systems’ database and should only be editable by the owner of the report configuration.
Fig. 2. Distribution of File Size
Fig. 3. Distribution of Change Size
the distribution of the sizes of the files explored during the maintenance tasks. For all the systems, the sizes of the files explored by the developers is almost the same.
Figure 3 presents the distribution of the number of changes performed to all the files for all the tasks per system. There could be differences in the effect of code smells on problematic code dependent on which of the four systems that were under development. Although assessed as having similar skills, some developers might be faster than others and faster in the second round than in the first round. Thus, we also use systems, developers, and rounds as (nominal) control variables.
D.3. Dependent Variables – In Sjøberget al.[2], the effort measured at file level was extracted from the same event logs. However, the previous study only considered sheer effort, which comprises the effort for all the different activities conducted on files.
In this study, we analyze the effort at different level by differentiating amongst the kinds of activities (i.e., editing, navigating, reading, searching). Similarly to the work by
Sjøberget al., the activity effort was log transformed to avoid the influence of extreme values in the dataset.
D.4. Instrumentation – We use Mimec[27], a plug-in that logs all the developers’ actions performed in Eclipse on the GUI level via listeners. Mimec attaches listeners to various parts of the Eclipse IDE and then records user interactions into event logs. We use these event logs as a data source for measuring effort because they allowed measuring the exact time the developers spent and also what kind of activity was performed. Some interactions captured by Mimec include:
• Selection of artifacts in the package explorer
• Selection of Java elements (classes, methods, variables) in the editor window
• Selecting Java elements in the file outline • Editing source files (Java files)
• Scrolling the source code window • Switching between open files
• Running Eclipse “commands” (copy, paste, go to line)
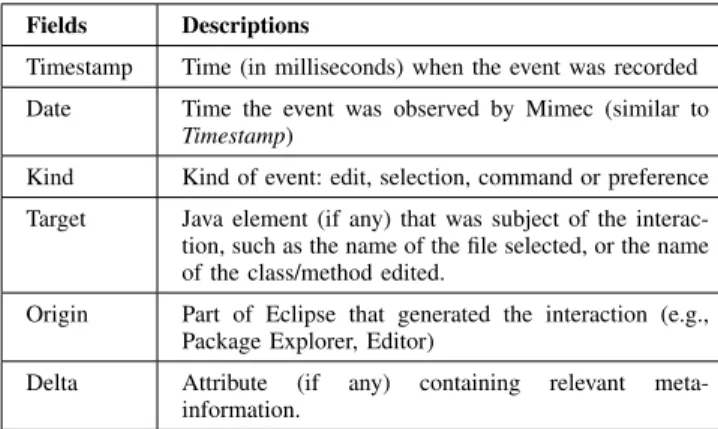
A single entry in the log file corresponds to an event generated by one of the listeners in Mimec. The event logs were stored as Comma-Separated Value (CSV) files, and each event consists of 6 pieces of data: Timestamp, Date, Kind, Target, Origin, and Delta. Table V describes each of the elements for one entry in the log and Table VI presents an example of a log file segment.
D.5. Log annotation and effort extraction process –We an-notated automatically the event logs by creating anannotation schemathat was given as input to a Java program that traversed the log files and annotated the entries (Table VIII presents a segment of annotated log). A manual annotation process (e.g., where you assign a sequence of log events to a given kind of activity) was not possible because not all the event logs were backed with video recordings because we performed think-aloud sessions at random points of the project, during which the screen was recorded. Also, it would not have been viable from a practical perspective,i.e.,to annotate manually more than 100 event logs of approximately 8 hours each. The annotation schema (Table VII presents a segment) defined
TABLE IV
CODE SMELLS AND THEIR DESCRIPTIONS FROM[4, 23]
Code Smells(ID) Descriptions Variables
Types Data Class (DC) Classes with fields and getters and setters not implementing any function in prticular. Binary Data Clumps (CL) Clumps of data items that are always found together whether within classes or between classes. Binary Duplicated Code in
condi-tional branches (DUP)
Same or similar code structure repeated within the branches of a conditional statement. Binary Feature Envy (FE) A method that seems more interested in other classes than the one it is actually in. Fowler recommends putting a method
in the class that contains most of the data the method needs.
Continuous
God Class (GC) A class has the God Class code smell if the class takes too many responsibilities relative to the classes with which it is coupled. The God Class centralizes the system functionality in one class, which contradicts the decomposition design principles.
Binary
God Method (GM) A class has the God Method code smell if at least one of its methods is very large compared to the other methods in the same class. God Method centralizes the class functionality in one method.
Binary Interface Segregation
Princi-ple Violation (ISPV)
The dependency of one class to another should consist on the smallest possible interface. Even if there are objects that require non-cohesive interfaces, clients should see abstract base classes that are cohesive. Clients should not be forced to depend on methods they do not use, since this creates coupling.
Binary
Misplaced Class (MC) In “God Packages” it often happens that a class needs the classes from other packages more than those from its own package.
Binary
Refused Bequest (RB) Subclasses do not want or need everything they inherit. Binary
Shotgun Surgery (SS) A change in a class results in the need to make a lot of little changes in several classes. Binary Temporary variable is used for
several purposes (TMP)
Consists of temporary variables that are used in different contexts, implying that they are not consistently used. They can lead to confusion and introduction of faults.
Binary
Use interface instead of im-plementation (IMP)
Castings to implementation classes should be avoided and an interface should be defined and implemented instead. Binary
TABLE VI
EXAMPLE OF A PIECE OFLOG GENERATED BYMIMEC !
!
Example!of!a!piece!of!Log!generated!by!Mimec! !
Timestamp) Date) Kind) Target) Origin) Delta)
23:53.4' Wed'Oct'15'22:23:53'CEST'2008' command' sourceHandle:'null' org.eclipse.ui.internal.WorkbenchWindow' activated' 23:58.8' Wed'Oct'15'22:23:58'CEST'2008' command' sourceHandle:'null' preferences$item.label.&Window/&Preferences...' menu' 24:00.7' Wed'Oct'15'22:24:00'CEST'2008' command' sourceHandle:'null' org.eclipse.ui.internal.WorkbenchWindow' activated' !
!
A!segment!of!annotation!schema! !
Event)
code) Kind) Origin) Delta) Activity) Sub;Activity) Additional)Info)
1' command' com.genuitec.eclipse.ast.deploy.core.ui.action.AddDeploymentAction$item.label.Add'Deployment...' menu' Other'activity' ProjectPEnvironment'configuration' Configure'server' 2' command' com.genuitec.eclipse.easie.core.ui.action.ServerStartAction$item.label..Run'Server' toolbar' Executing' Executing' Start'the'server' !
!
Example!of!a!piece!of!annotated!Mimec!log! !
Event) PC)time) Time) Kind) Target) Origin) Delta) Event)code) Activity) Sub;Activity) Additional)Info) 19' 2008P11P24'13:26:43.984'13:26:43' preference' null' com.genuitec.myeclipse.perspective.myeclipseperspective' perspective'changed:'editorOpen' 198' activity'Other' Switching'to'Eclipse' Go'to'MyEclipse'perspective' 20' 2008P11P24'13:26:58.703'13:26:58' selection' ?' org.jboss.tools.common.propertieseditor.PropertiesCompoundEditor' '' 321' Navigating' Switch'to'other'file' .properties'file'Select'a' !
TABLE V
DESCRIPTION OF DATA CONTAINED IN AN EVENT
Fields Descriptions
Timestamp Time (in milliseconds) when the event was recorded Date Time the event was observed by Mimec (similar to
Timestamp)
Kind Kind of event: edit, selection, command or preference Target Java element (if any) that was subject of the interac-tion, such as the name of the file selected, or the name of the class/method edited.
Origin Part of Eclipse that generated the interaction (e.g., Package Explorer, Editor)
Delta Attribute (if any) containing relevant meta-information.
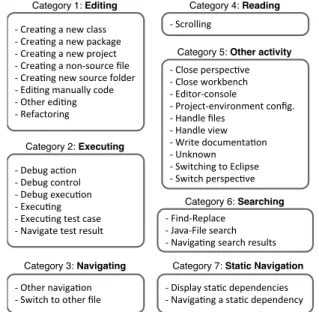
a mapping between different combinations of the attributes Kind, Origin, and Delta, to a specific activity category and an activity sub-category(See Fig. 4). The annotation schema was created from analyzing several videos from the think-aloud sessions. Once we finalized the annotation, the Java
program would identify the elapsing of time for each of the different activities and would truncate consecutive events that belong to a same activity and would calculate the time between one activity and the next one. All the events were associated with the source code so we believe this constitutes an accurate measure of the effort spent in Java files. In addition, we cross-validate these results by selecting random activity reports and examining their corresponding videos.
D.6. Workarounds needed with Mimec –In the maintenance project, the developers had to work with multiple environments besides the Eclipse IDE (e.g., look at documentation, run the application in the browser). Thus, they would leave the IDE, but Mimec does not register when the developer leaves the IDE, only when he/she comes back to it. Consequently, the elapsing time from the moment that a developer leaves the IDE until he/she comes back will be assigned to the activity performed just before leaving the IDE, and this would yield inaccurate values. To solve this problem, we created a lookup-table with average times of all the kinds of activities from all the event logs from all the developers. We compute the average time without any distinction if developers leave the IDE or
TABLE VII
ASEGMENT OF ANNOTATION SCHEMA
! !
Example!of!a!piece!of!Log!generated!by!Mimec! !
Timestamp) Date) Kind) Target) Origin) Delta)
23:53.4' Wed'Oct'15'22:23:53'CEST'2008' command' sourceHandle:'null' org.eclipse.ui.internal.WorkbenchWindow' activated' 23:58.8' Wed'Oct'15'22:23:58'CEST'2008' command' sourceHandle:'null' preferences$item.label.&Window/&Preferences...' menu' 24:00.7' Wed'Oct'15'22:24:00'CEST'2008' command' sourceHandle:'null' org.eclipse.ui.internal.WorkbenchWindow' activated'
! !
A!segment!of!annotation!schema! !
Event)
code) Kind) Origin) Delta) Activity) Sub;Activity) Additional)Info)
1' command' com.genuitec.eclipse.ast.deploy.core.ui.action.AddDeploymentAction$item.label.Add'Deployment...' menu' Other'activity' ProjectPEnvironment'configuration' Configure'server' 2' command' com.genuitec.eclipse.easie.core.ui.action.ServerStartAction$item.label..Run'Server' toolbar' Executing' Executing' Start'the'server'
! !
Example!of!a!piece!of!annotated!Mimec!log! !
Event) PC)time) Time) Kind) Target) Origin) Delta) Event)code) Activity) Sub;Activity) Additional)Info)
19' 2008P11P24'13:26:43.984'13:26:43' preference' null' com.genuitec.myeclipse.perspective.myeclipseperspective' perspective'changed:'editorOpen' 198' activity'Other' Switching'to'Eclipse' Go'to'MyEclipse'perspective' 20' 2008P11P24'13:26:58.703'13:26:58' selection' ?' org.jboss.tools.common.propertieseditor.PropertiesCompoundEditor' '' 321' Navigating' Switch'to'other'file' .properties'file'Select'a'
!
TABLE VIII
EXAMPLE OF A PIECE OF ANNOTATEDMIMEC LOG !
!
Example!of!a!piece!of!Log!generated!by!Mimec! !
Timestamp) Date) Kind) Target) Origin) Delta)
23:53.4' Wed'Oct'15'22:23:53'CEST'2008' command' sourceHandle:'null' org.eclipse.ui.internal.WorkbenchWindow' activated' 23:58.8' Wed'Oct'15'22:23:58'CEST'2008' command' sourceHandle:'null' preferences$item.label.&Window/&Preferences...' menu' 24:00.7' Wed'Oct'15'22:24:00'CEST'2008' command' sourceHandle:'null' org.eclipse.ui.internal.WorkbenchWindow' activated' !
!
A!segment!of!annotation!schema! !
Event)
code) Kind) Origin) Delta) Activity) Sub;Activity) Additional)Info)
1' command' com.genuitec.eclipse.ast.deploy.core.ui.action.AddDeploymentAction$item.label.Add'Deployment...' menu' Other'activity' ProjectPEnvironment'configuration' Configure'server' 2' command' com.genuitec.eclipse.easie.core.ui.action.ServerStartAction$item.label..Run'Server' toolbar' Executing' Executing' Start'the'server' !
!
Example!of!a!piece!of!annotated!Mimec!log! !
Event) PC)time) Time) Kind) Target) Origin) Delta) Event)code) Activity) Sub;Activity) Additional)Info) 19' 2008P11P24'13:26:43.984'13:26:43' preference' null' com.genuitec.myeclipse.perspective.myeclipseperspective' perspective'changed:'editorOpen' 198' activity'Other' Switching'to'Eclipse' Go'to'MyEclipse'perspective' 20' 2008P11P24'13:26:58.703'13:26:58' selection' ?' org.jboss.tools.common.propertieseditor.PropertiesCompoundEditor' '' 321' Navigating' Switch'to'other'file' .properties'file'Select'a' ! !"Crea'ng"a"new"class !"Crea'ng"a"new"package !"Crea'ng"a"new"project !"Crea'ng"a"non!source"file !"Crea'ng"new"source"folder !"Edi'ng"manually"code !"Other"edi'ng !"Refactoring Category 1: Editing !"Debug"ac'on !"Debug"control !"Debug"execu'on !"Execu'ng !"Execu'ng"test"case !"Navigate"test"result Category 2: Executing !"Other"naviga'on !"Switch"to"other"file Category 3: Navigating !"Scrolling Category 4: Reading !"Close"perspec've !"Close"workbench !"Editor!console !"Project!environment"config. !"Handle"files !"Handle"view !"Write"documenta'on !"Unknown !"Switching"to"Eclipse !"Switch"perspec've
Category 5: Other activity
!"Find!Replace" !"Java!File"search !"Naviga'ng"search"results Category 6: Searching !"Display"sta'c"dependencies !"Naviga'ng"a"sta'c"dependency
Category 7: StaticNavigation
Fig. 4. Categorization of developers’ activities (adapted from [28])
not. The sample size used for calculating the averages was very high, and the resulting standard deviations were very low (within the millisecond range). The heuristic for calculating the time for consecutive activities was as follows:
If any event A is followed by an event B with the label ‘Go to MyEclipse perspective’ (indicating the return to the IDE after leaving it), then: Case 1:If the elapsed time between A and B is equal or lower than the average time for an activity in the lookup-table, assign the whole elapsed time to the activity related to event A. Case 2: If the elapsed time between A and B is higher than the average time for an activity in the lookup-table, assign the average time from the lookup table to that activity, and the elapsed time minus the average time to “Unknown activity outside of IDE”.
Figure 5 shows how developers spent effort performing each kind of activity. It reveals that developers mostly perform nav-igating activity (58.72%), reading activity (28.27%), editing
Fig. 5. Proportion of the Effort Spent on each Activity
activity (10.18%), searching activity (2.47%), static navigation (0.16%), and other activities (0.15%). This distribution of the effort amount activities is consistent with Koet al. according to the top four most effort consuming activities [29]. However, while reading code is the first activity in term of effort consuming in Ko et al.’s study, our analysis shows that navigating is the most effort consuming activity. We think that this difference is due to the definition of action belonging to an activity. For example, we consider scrolling as a reading activity while Koet al.also consider actions, such as hovering mouse cursor. In our analysis, we only focus on the top four effort consuming activities i.e., navigating, reading, editing, and searching.
E. Analysis Method
We used Multiple Linear Regression [30] to build one model for each of the different activity efforts. More powerful mod-eling techniques such as General Linear Models (GLMs) [31] are available, but they complicate the analysis/interpretation of the models and affect the level of comparability with respect to the previous study [2], which used Multiple Linear Regression. The control variables were included in the model as covari-ates. We applied natural logarithm to the number of Feature Envy, the activities effort, file sizes, and the numbers of
changes. This transformation was performed to make the data suitable for regression-based modeling. We use the R implementation for linear regression.
For each activity effort, we build a model based on control variables (developer, system, round) to assess how these vari-ables could explain the effort, i.e.,Model 0. Then, by adding code smells to Model 0, we obtain Model 1 that aims to assess how code smells explain the effort and they affect the fit of Model 0. In Model 2, we add the file size to Model 1 to measure how file sizes contribute to explain the effort. Finally, we build Model 3 by adding the file size to Model 2. For the sake of simplicity, we put “NA” (Not Applicable) in case a variable is not used in a model. By incrementally adding variables to the model, we assess the contribution of each variable (or group of variables, e.g., code smells) for explaning the effort.
IV. RESULTS ANDDISCUSSION A. Regression Analysis
Tables IX to XII present the results of regression analysis. The values in each table denotes the coeficient of the variable in the model while (*), (**), and (***) report the significance of the variables in the explanation of the effort.
Table IX shows the results for editing effort. The first model uses the control variables (developers, systems, and round) to model the activity effort. Theses variables do not explain the editing effort (R2= 0.009), which shows that the
difference in developers, systems, and rounds is not enough to show differences in editing effort. We think that this result is not surprising because developers usually edit code with a well-defined goal (e.g.,validate the relevance of the program element or changes to resolve the task). Thus, the difference in control variables would not show the variation in editing effort but in the activities prior to editing activity. For example, developers have different ways to navigate source code [32, 33] and the difference in navigation may affect the navigating effort. When adding code smells to Model 0, Table IX (Model 1) shows that five code smells (FE, GC, ISPV, CL, and IMP) are associated with more editing effort. On the contrary, RB decreases the editing effort. The adjusted R-square (0.26) shows that code smells can account for 26% of the variation in maintenance effort. Moreover, using only code smells to model the editing effort (if we remove the control variables from Model 1) it shows the adjusted R-square of 0.25, which according to Cohen’s guidelines [34, 35] for classifying the effect size, is closer to having a ‘medium’ effect rather than ‘small’ effect (i.e., Cohen suggests as a basic guideline that if the coefficient is .10, is a small effect, .30 is a medium effect, and .50 is a large effect).
We add the file size to Model 1 and obtain Model 2 that shows almost the same results as Model 1, except the RB that does not affect the editing effort in Model 2. We observe a close adjusted R-squares in Model 1 and Model 2 (0.26 vs. 0.29). Moreover, we run Model 0 with file sizes only to see if file sizes could explain the editing effort. The results of the later analysis show that file sizes could not explain
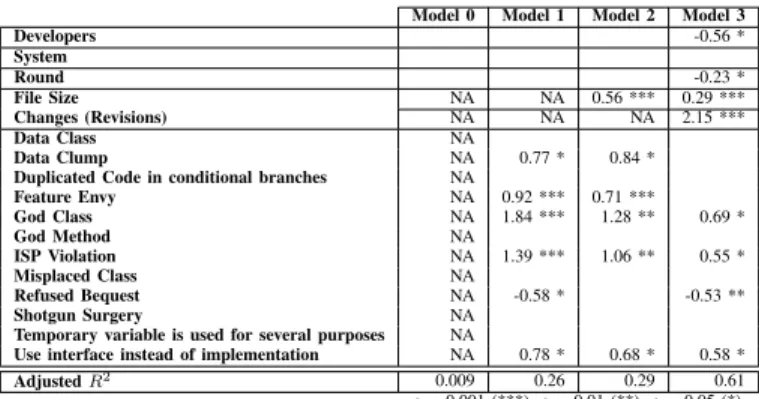
TABLE IX
RESULTS OFREGRESSIONANALYSIS FOREDITINGEFFORT
Model 0 Model 1 Model 2 Model 3
Developers -0.56 * System Round -0.23 * File Size NA NA 0.56 *** 0.29 *** Changes (Revisions) NA NA NA 2.15 *** Data Class NA Data Clump NA 0.77 * 0.84 *
Duplicated Code in conditional branches NA
Feature Envy NA 0.92 *** 0.71 *** God Class NA 1.84 *** 1.28 ** 0.69 * God Method NA ISP Violation NA 1.39 *** 1.06 ** 0.55 * Misplaced Class NA Refused Bequest NA -0.58 * -0.53 ** Shotgun Surgery NA
Temporary variable is used for several purposes NA
Use interface instead of implementation NA 0.78 * 0.68 * 0.58 *
AdjustedR2 0.009 0.26 0.29 0.61 α= 0.001 (***),α= 0.01 (**),α= 0.05 (*)
editing effort as did code smells (R-square = 0.11). This results indicate that, compared to code smells, file sizes have a limited impact on editing effort.
Model 3 includes change size (revision) to Model 2 and shows a high adjusted R-square (0.61). FE and CL do not impact the editing effort in Model 3. When we remove all code smells from Model 3, the fit of the model (R2 = 0.59)
shows that code smells do not impact editing effort as do numbers of revisions and file sizes.
Overall, according to the analysis of the impact of each variable (file size, change size, and code smells) separately on editing effort, and then their combination, we conclude that, in terms of both their effect size and their contribution to improving the fit of the model, code smells have more relevance than file size. In contrast, change size impacts the editing effort more than code smells and the effect of code smells on editing effort vanishes when the change size is taken into account. However, change size is a metric that can only be calculated post-hoc (i.e., you need development/maintenance history in order to compute it), which is in contrast to code smells. Thus, code smells can be useful indicators of effort for certain activities in the absence of code evolution data, where only the source code is available.
Compared to Sjøberget al.[2], who reported that file size affects the effort more than code smells, our results show that some smells affect the editing effort more than file size. This hints that developers should be aware that it may take longer to edit files containing CL, FE, GC, ISPV, and IMP.
Table X shows the result of navigating effort. Similar to the editing effort, code smells have a limited impact on navigating effort because code smells improve the Adjusted R-square of Model 1 (R2 = 0.02), which is still small (R2 = 0.26). The
file size added in Model 1 improve the fit of the model (See Model 2). It shows that code smells impact the navigating effort more than the files size. According to the improvement of the model fit when we add the change size to Model 2 to obtain Model 3, we observe that the change size explains better the navigating effort than code smells and file size. We can conclude that, on the contrary to editing effort, CL does not increase the navigating effort and FE does not require less
TABLE X
RESULTS OFREGRESSIONANALYSIS FORNAVIGATINGEFFORT
Model 0 Model 1 Model 2 Model 3 Developers -0.17 *** -0.17 *** -0.18 *** -0.20 *** System 0.12 * Round -0.29 * -0.29 * -0.34 ** File Size NA NA 0.72 *** 0.52 *** Changes (Revisions) NA NA NA 1.60 *** Data Class NA Data Clump NA
Duplicated Code in conditional branches NA
Feature Envy NA 0.92 *** 0.65 *** God Class NA 1.99 *** 1.27 ** 0.83 * God Method NA ISP Violation NA 1.09 ** 0.66 * Misplaced Class NA Refused Bequest NA Shotgun Surgery NA
Temporary variable is used for several purposes NA
Use interface instead of implementation NA 0.72 * 0.53 *
AdjustedR2 0.02 0.26 0.31 0.50 α= 0.001 (***),α= 0.01 (**),α= 0.05 (*)
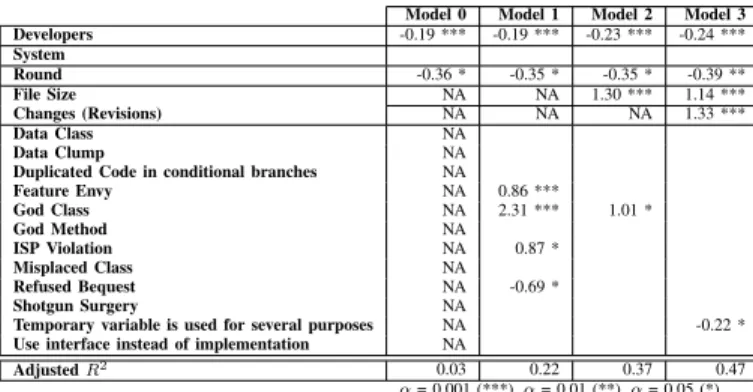
TABLE XI
RESULTS OFREGRESSIONANALYSIS FORREADINGEFFORT
Model 0 Model 1 Model 2 Model 3 Developers -0.19 *** -0.19 *** -0.23 *** -0.24 *** System Round -0.36 * -0.35 * -0.35 * -0.39 ** File Size NA NA 1.30 *** 1.14 *** Changes (Revisions) NA NA NA 1.33 *** Data Class NA Data Clump NA
Duplicated Code in conditional branches NA
Feature Envy NA 0.86 *** God Class NA 2.31 *** 1.01 * God Method NA ISP Violation NA 0.87 * Misplaced Class NA Refused Bequest NA -0.69 * Shotgun Surgery NA
Temporary variable is used for several purposes NA -0.22 *
Use interface instead of implementation NA
AdjustedR2 0.03 0.22 0.37 0.47 α= 0.001 (***),α= 0.01 (**),α= 0.05 (*)
navigating effort.
Table XI shows the result of reading effort. According to Model 1, code smells have an impact on reading effort (code smells improve the fit of Model 0 from 0.03 to 0.22). Model 2 shows that the files sizes improve the explanation of the reading effort. When we remove the file size from Model 2 and replace by the change size, theR2becomes 0.36. It shows that the change and file size equally (in term of the fit of the model) contribute to the reading effort. However, Model 3 shows that in term of the magnitude of the impact, the change size explains the effort more than the file size. Finally, we can conclude that the change size and file size explain more the effort than code smells.
Table XII shows the result of searching effort and reveals that change size impacts more (in term of the magnitude and the fit of the model) the effort than file size. Only “Feature Envy” smell affects the searching effort.
We summarize the impact of code smells on different activity effort in Table XIII. We can observe that different code smells impact the effort of activities. For example, only FE affects the searching effort and CL affects only the editing effort. Editing, navigating, and reading efforts are affected by three smells (FE, GC, and ISPV). In [36], it was found that CL is negatively correlated to the presence of problems, as opposed to ISPV. This is quite interesting, as indicates that longer effort does not necessarily be considered problematic
TABLE XII
RESULTS OFREGRESSIONANALYSIS FORSEARCHINGEFFORT
Model 0 Model 1 Model 2 Model 3 Developers -0.30 *** -0.29 *** -0.30 *** -0.31 *** System Round File Size NA NA 0.37 *** 0.27 *** Changes (Revisions) NA NA NA 0.80 *** Data Class NA Data Clump NA
Duplicated Code in conditional branches NA
Feature Envy NA 0.92 *** 0.78 *** 0.52 *** God Class NA God Method NA ISP Violation NA Misplaced Class NA Refused Bequest NA Shotgun Surgery NA
Temporary variable is used for several purposes NA
Use interface instead of implementation NA
AdjustedR2 0.11 0.24 0.27 0.35 α= 0.001 (***),α= 0.01 (**),α= 0.05 (*)
TABLE XIII
SUMMARY OF THEIMPACT OFCODESMELL ONACTIVITY EFFORT
Editing Navigating Reading Searching Data Class
Data Clump +
Duplicated Code in conditional branches
Feature Envy + + + + God Class + + + God Method ISP Violation + + + Misplaced Class Refused Bequest - -Shotgun Surgery
Temporary variable is used for several purposes
Use interface instead of implementation + + “+”: require more effort “-”: required less effort “empty”: no effect on the effort
(as the case of CL, where we conjecture that the nature of the task may have required the developers to spend more time working on Data Clumps). In contrast, the study by [36] reported that ISPV was positively correlated with the higher likelihood of problems during maintenance, and the results from our study hint that these problems can have consequences on increased effort for editing, navigating and reading. ‘Problems’ as reported in [36] mainly were concerned with task context localization and program comprehension, which are in alignment with the types of activities where we observed an increased effort.
Finally, compared to the file and change size, code smells affect effort differently with different magnitude. For editing and navigating effort, code smells affect the effort more than file size, while for reading and searching effort, smells affect effort less than file size. Thus, we answer our research question as follows: Yes, code smells do affect the effort required to edit, navigate, read, or search for information during a maintenance task with different levels of impact depending on the kind of activity.
V. THREATS TOVALIDITY
This section discusses the threats to validity of our studies following common guidelines for empirical studies [37]. It also provides preliminary recommendations.
Threats to construct validity – concern the design of our study. In our study, we asked developers to perform their tasks in multiple rounds, which could lead them to learn.
We mitigate any possible learning bias by using round as an independent variable in our models.
Threats to conclusion validity –pertain to our correct use of mathematical tools. We used natural logarithm and Multiple Linear Regression [30] to build our models. We use the implementation provided by R. Therefore, we believe that our results do not suffer from threats to their conclusion. Yet, future work should investigate our research question using other mathematical tools, like General Linear Models. Our results explain different activities effort using dependent variables. The fact that a dependent variable explain certain effort and the level in which it explain the effort may depend on the correlation between that dependent variable and other dependent variables. In this case, both correlated dependent variables may explain the effort, but our model may keep only one variable. We plan to use the regression modeling strategies [38] to handle correlated and redundant variables.
Threats to internal validity – concern our selection of sys-tems, tools, and analysis method. The accuracy of Mimec and other similar tools, e.g., Mylyn, is a threat. These tools may miss some activities and record the times spent by developers, including interruptions and idle moments, unless developers are very careful to stop/start recording appropriately. There-fore, the developers’ event logs may contain erroneous and– or missing data. We accept this threat and will replicate our study in future work with more recordings and other tools to further increase our confidence in our results.
In addition, our use of Borland Together and InCode may have generated spurious occurrences of the code smells and–or missed some real occurrences. We accept this threat because we used two different tools, which produce some common results that we could cross-checked successfully. Moreover, we also manually analysed some of their results and confirmed that they were of sufficient accuracy for our study. Future work could replicate our study with other tools to refine our results. The tool that we used count the LOC by considering blank line. We do realise that blank lines most likely have no effect on the developers’ effort but accept this threat because, still, numerous blank lines could exacerbate the effect of size.
Finally, we used an automated tool to annotate the event logs. We carefully checked our algorithm and some of its outputs and are confident that it does not contain bugs that would jeopardize our results. Yet, other tools could be used to further confirm our results.
Threats to reliability validity – concern the possibility of replicating this study. Every result obtained through empirical studies is threatened by potential bias from the used data sets [39]. To mitigate these threats, we performed our study using 6 developers that developed and maintained independently four systems. In addition, we attempted to provide all the necessary details required to replicate our study.
Threats to external validity – concern the generalisability of our results. Because we use six companies and four sys-tems, we cannot claim that our results would apply to any software company or any systems. Yet, we are bringing new, interesting information regarding the impact of code smells
on the developers’ effort when performing different kinds of activities and, thus, we are ready to accept this threat. Future (quasi-)replications with different developers and systems are necessary to further confirm our results.
VI. CONCLUSION ANDFUTUREWORK
In this paper, we follow previous works on the impact of code smells on development activities [1, 3, 5–7] and revisit the dataset from one particular study [2] to assess the impact of code smells not on the developers’ “sheer-effort” but on their different kinds of activities,e.g.,reading, editing, searching, and navigating. We ask the question:Do code smells affect the effort required to edit, navigate, read, or search for information during a maintenance task?
Our conjecture is that code smells have an impact on the developers’ effort for certain kinds of activities. We study this effect by analyzing the same dataset from a previous study [2] but this time, distinguishing the effort amongst the different activities. We found that different code smells significantly impact the effort of different activities. For example, we found that “Feature Envy” affects searching effort while “Data Clumps” affects editing effort.
We found that editing, navigating, and reading efforts are affected by three smells: “Feature Envy”, “God Class”, and “ISP Violation”. We found that the effect of code smells on editing and navigating effort is, in fact, larger than file size, whiles the opposite is the true for reading and searching effort. We conclude that developers and tool providers should be wary of the presence of code smells because they impact the change-and fault-proneness of classes [3] but also the developers’ efforts during their different activities.
In future work, we plan to use different tools to collect developers’ event logs while developing/maintaining different systems. In addition, more in-depth qualitative analysis will be conducted on the think-aloud sessions and observational notes as to understand better how code smells affect the effort of the different activities. We could potentially use preliminary taxonomies such as reported in [40] to build more complete explanatory models that can complement the quantitative anal-ysis. We also will investigate General Linear Models to further understand the impact of code smells on different kinds of activities. Other (quasi-)replications with different developers and systems are necessary to further confirm our results.
REFERENCES
[1] M. Abbes, F. Khomh, Y.-G. Gueheneuc, and G. Antoniol, “An Empirical Study of the Impact of Two Antipatterns, Blob and Spaghetti Code, on Program Comprehension,” in15th European Conf. Softw. Maintenance and ReEng. IEEE, 2011, pp. 181–190.
[2] D. I. Sjoberg, A. Yamashita, B. C. Anda, A. Mockus, and T. Dyba, “Quantifying the Effect of Code Smells on Maintenance Effort,”IEEE Transactions on Software Engineering, vol. 39, no. 8, pp. 1144–1156, 2013.
[3] F. Khomh, M. D. Penta, Y.-G. Gu´eh´eneuc, and G. Antoniol, “An exploratory study of the impact of antipatterns on class change- and fault-proneness,”Empirical Softw. Engg., vol. 17, no. 3, pp. 243–275, Jun. 2012. [Online]. Available: http://dx.doi.org/10.1007/s10664-011-9171-y
[4] M. Fowler, Refactoring: Improving the Design of Existing Code. Addison-Wesley, 1999.
[5] F. Khomh, M. Di Penta, and Y.-G. Gu´eh´eneuc, “An Exploratory Study of the Impact of Code Smells on Software Change-proneness,” inWorking Conf. Reverse Eng. IEEE, 2009, pp. 75–84.
[6] S. E. S. Taba, F. Khomh, Y. Zou, A. E. Hassan, and M. Nagappan, “Predicting bugs using antipatterns,” inProc. of the 29th Int’l Conference on Software Maintenance, 2013, pp. 270–279.
[7] M. D’Ambros, A. Bacchelli, and M. Lanza, “On the impact of design flaws on software defects,” inQuality Software (QSIC), 2010 10th Int’l Conf. on. IEEE, 2010, pp. 23–31.
[8] N. Moha, Y.-G. Gu´eh´eneuc, L. Duchien, and A.-F. Le Meur, “DECOR: A Method for the Specification and Detection of Code and Design Smells,”IEEE Transactions on Software Engineering, vol. 36, no. 1, pp. 20–36, 2010.
[9] F. Khomh, S. Vaucher, Y.-G. Gu´eh´eneuc, and H. Sahraoui, “BDTEX: A GQM-based Bayesian approach for the detection of antipatterns,” Journal of Systems and Software, vol. 84, no. 4, pp. 559–572, 2011. [10] A. Chatzigeorgiou and A. Manakos, “Investigating the Evolution of Bad
Smells in Object-Oriented Code,” in2010 Seventh Int’l Conf. the Quality of Information and Communications Technology. IEEE, 2010, pp. 106– 115.
[11] S. M. Olbrich, D. S. Cruzes, and D. I. K. Sjøberg, “Are all code smells harmful? A study of God Classes and Brain Classes in the evolution of three open source systems,” inIEEE Int’l Conf. Softw. Maintenance, 2010, pp. 1–10.
[12] R. Peters and A. Zaidman, “Evaluating the Lifespan of Code Smells using Software Repository Mining,” in2012 16th European Conf. Softw. Maintenance and ReEng. IEEE, 2012, pp. 411–416.
[13] R. Shatnawi and W. Li, “An investigation of bad smells in object-oriented design,” inInformation Technology: New Generations, 2006. ITNG 2006. 3rd Int’l Conf. on. IEEE, 2006, pp. 161–165.
[14] I. Deligiannis, M. Shepperd, M. Roumeliotis, and I. Stamelos, “An empirical investigation of an object-oriented design heuristic for main-tainability,”Journal of Systems and Software, vol. 65, no. 2, pp. 127–139, 2003.
[15] A. Lozano and M. Wermelinger, “Assessing the effect of clones on changeability,” inIEEE Int’l Conf. Softw. Maintenance, 2008, pp. 227– 236.
[16] B. C. D. Anda, D. I. K. Sjøberg, and A. Mockus, “Variability and Reproducibility in Software Engineering : A Study of Four Companies that Developed the Same System,” IEEE Transactions on Software Engineering, vol. 35, no. 3, pp. 407–429, 2009.
[17] Plone Foundation, “Plone CMS: Open Source Content Management. http://plone.org. Accessed 10 May 2012,” 2012.
[18] A. Yamashita, “Assessing the Capability of Code Smells to Support Software Maintainability Assessments: Empirical Inquiry and Method-ological Approach,” Doctoral Thesis, University of Oslo, 2012. [19] G. R. Bergersen and J.-E. Gustafsson, “Programming Skill, Knowledge,
and Working Memory Among Professional Software Developers from an Investment Theory Perspective,”Journal of Individual Differences, vol. 32, no. 4, pp. 201–209, 2011.
[20] Genuitec, “My Eclipse. http://www.myeclipseide.com. Accessed 10 May 2012,” 2012.
[21] Borland, “Borland Together. http://www.borland.com/us/products/together. Accessed 10 May 2012,” 2012.
[22] Intooitus, “InCode. http://www.intooitus.com/inCode.html. Accessed 10 May 2012,” 2012.
[23] R. C. Martin, Agile Software Development, Principles, Patterns and Practice. Prentice Hall, 2002.
[24] R. Marinescu, “Assessing technical debt by identifying design flaws in software systems,”IBM Journal of Research and Development, vol. 56, no. 5, pp. 9:1–9:13, 2012.
[25] E. Khaled El, “A methodology for validating software product metrics,” Nat’l Research Council of Canada, Tech. Rep. NRC 44142, 2000. [26] TMate-Sofware, “SVNKit - Subversioning for Java. http://svnkit.com.
Accessed 10 May 2012,” 2010.
[27] L. M. Layman, L. A. Williams, and R. St. Amant, “MimEc,” inInt’l Ws. Cooperative and Human Aspects of Softw. Eng. (CHASE). New York, New York, USA: ACM Press, 2008, pp. 73–76.
[28] L. M. Layman, “Information Needs of Developers for Program Com-prehension during Software Maintenance Tasks,” Doctoral Thesis, North Carolina State University, 2009.
[29] A. Ko, B. Myers, M. Coblenz, and H. Aung, “An Exploratory Study of How Developers Seek, Relate, and Collect Relevant Information during Software Maintenance Tasks,” IEEE Transactions on Software Engineering, vol. 32, no. 12, pp. 971–987, 2006.
[30] A. Field and J. Miles,Discovering Statistics Using SAS. SAGE, 2011. [31] T. W. Anderson, K. T. Fang, and I. Olkin,Multivariate analysis and its applications. Hayward, CA: Institute of Mathematical Statistics, 1994. [32] M. P. Robillard, W. Coelho, and G. C. Murphy, “How effective develop-ers investigate source code: An exploratory study,”IEEE Transactions on Software Engineering, vol. 30, no. 12, pp. 899–903, December 2004. [33] Z. Soh, F. Khomh, Y.-G. Gu´eh´eneuc, G. Antoniol, and B. Adams, “On the effect of program exploration on maintenance tasks,” in Reverse Engineering (WCRE), 2013 20th Working Conference on, Oct 2013, pp. 391–400.
[34] J. Cohen,Statistical power analysis for the behavioural sciences, 2nd ed. New York: Academic Press, 1988.
[35] ——, “A power primer,” Psychological Bulletin, vol. 112, no. 1, pp. 155–159, 1992.
[36] A. Yamashita, “Assessing the capability of code smells to explain maintenance problems: an empirical study combining quantitative and qualitative data,”Empirical Software Engineering, vol. 19, no. 4, pp. 1111–1143, 2013.
[37] R. Yin, Case Study Research : Design and Methods (Applied Social Research Methods). SAGE, 2002.
[38] F. E. Harrell Jr.,Regression Modeling Strategies: With Applications to Linear Models, Logistic Regression, and Survival Analysis. Springer Series in Statistics, 2001.
[39] T. Menzies, J. Greenwald, and A. Frank, “Data mining static code attributes to learn defect predictors,”Software Engineering, IEEE Trans-actions on, vol. 33, no. 1, pp. 2–13, Jan 2007.
[40] A. Yamashita and L. Moonen, “Towards a taxonomy of programming-related difficulties during maintenance,” in Software Maintenance (ICSM), 2013 29th IEEE International Conference on, Sept 2013, pp. 424–427.
The author has requested enhancement of the downloaded file. All in-text references underlined in blue are linked to publications on ResearchGate. The author has requested enhancement of the downloaded file. All in-text references underlined in blue are linked to publications on ResearchGate.