1
DCF Please! Evidence from a
Content Analysis of Analyst Reports
Hongping Tan, McGill University Changqiu Yu, York University
July 2018
Abstract Using textual analysis for a large sample of analyst reports, we find that analysts are more likely to use DCF model than PE model and engage in more cash flow and discount rate discussions when investors have a stronger demand for value-relevant information. The market reactions to analyst investment opinions based on DCF model are stronger than those based on PE model, especially when the DCF model is accompanied by more cash flow and discount rate discussions. These results indicate that analysts’ valuation process reflects investor demand for value-relevant information and has a bearing on the quality of their research.
Keywords: Analysts; Valuation; Discounted cash flow (DCF); Cash flow; Discount rate; Content analysis
2
1. IntroductionDespite a large literature on sell-side analyst forecasts, little is known about the valuation process through which analysts convert their earnings and various other accounting item forecasts into target prices and stock recommendations. Since analysts’ valuation process is not directly observable, a few studies attempt to infer how analysts covert their earnings forecasts into investment opinions by correlating recommendations and target prices with the implied estimates from some predefined valuation models.1 Bradshaw (2004) pioneered this line of research by showing that analysts give up using their earnings forecasts in developing stock recommendations, even though recommendations based on earnings forecast valuations relate positively to future stock returns. We use textual analysis for a large sample of analyst reports — the footprint of analyst research — to examine the determinants and the informativeness of analyst valuation models.
We explore three closely related questions. We first examine whether investor demand for value-relevant information drives analysts’ use of discounted cash flow (DCF) model instead of price-to-earnings (PE) model2. We then examine whether analysts respond to investor demand for more value-relevant information by providing more cash flow and discount rate analysis, the two major inputs into the DCF valuation. Finally, we examine whether investors react differently to analyst investment opinions based on different valuation models.
Our research is important as existing studies on analyst valuation process are subject to a few limitations. First, valuation models identified through model-based inference may deviate from the ones actually used by analysts, as a minor change in model assumptions may cause a large difference in the value estimates (Lundholm and O'keefe 2001). Second, the literature mainly examines earnings-based valuation models such as price-earnings-to-growth (PEG) and
1 See, for example, Bradshaw (2004); Barniv et al. (2009), and Gleason et al. (2013). 2
We define PE model loosely which includes all the earnings multiples such as P/E, PEG, P/EBITDA, EV/EBITDA, EV/EBIT, EV/EBITA, EBITDA/MV, and EV/EBIAT.
3
residual income valuation model (RIM) but neglect cash flow models, ranked as the second most important model used by analysts (Brown et al. 2015). Third, the context for the analysts’ choice of specific valuation models is still unclear. Theoretic models indicate that different valuation models lead to the same valuation if properly implemented. Thus, it is crucial to identify the context and the limitation for the use of a specific model. Finally, due to the lack of data, previous studies provide limited evidence on analyst assessment of valuation details. Asquith, Mikhail, and Au (2005) and Huang, Zang, and Zheng(2014) are among the very few examining the textual information discussed in analyst reports. They find that textual discussionsprovide incremental information to investors. They, however, do not consider analyst discussions of valuation details, the cash flow and discount rate information in particular.
Based on a textual analysis for a sample of 527,883 financial analyst reports during 1997 to 2015 on 4,957 U.S. firms by 3,196 analysts, we identify the dominant valuation models used by analysts to justify their stock recommendations and target prices. We examine whether investor demand for the underlying firms’ value-relevant information affects analysts’ use of valuation models. Chen et al. (2013) decompose stock price movement into two components: the change due to cash flow news revisions and the change due to discount rate news revisions. They conclude that both cash flow news and discount rate news contribute to stock price movement. Following this decomposition of stock returns, we expect that the processing of cash flow information and discount rate information be crucial for analysts’ valuation process.
Compared with PE model that assumes earnings is proportional to firm value and implies risk assessment in the estimate of P/E ratio, DCF model speaks directly into multi-period cash flow forecasts and the discount rate estimate. Since it is more difficult for investors to interpret, evaluate, and verify less precise information, specific information is more valuable to investors’ decisions makings (See Heinle and Smith 2017; Hope et al. 2016). Therefore, we expect investors to value the specific cash flow and discount rate information conveyed through DCF valuation process, especially when they have a stronger demand for such information. As Brown et al.
4
(2015) find that client demand for information is the most important determinant of analysts’ coverage decisions, investor demand for cash flow and discount rate information about the underlying firms has a bearing on analysts’ valuation process through their application of DCF model.
We use earnings quality and firm risks to capture the extent of investor demand for cash flow and discount rate information, respectively. We find that analysts are more likely to use DCF model than PE model to value firms with lower earnings quality measured by earnings management and total accrual, and firms with higher risks measured by operational cash flow volatility, negative earnings, and stock return volatility. To further examine the impact of investor demand for discount rate information on analysts’ valuation model choice, we attempt to control for investor demand for cash flow information by comparing DCF with price-to-cash flows (PCF) models. Both models rely on the input of cash flow forecasts. DCF model entails, however, an additional input of discount rate which largely reflects the underlying firm risks. We find that the likelihood for analysts to use DCF over P/CF model is not related to earnings quality, but is positively associated with firm risks. Overall, we find that the investor demand for cash flow and discount rate information influence analysts’ valuation model decisions.
We then examine whether investor demand for value-relevant information relates to analyst processing of such information. While investor demand for cash flow and discount rate
information may motivate analysts to use DCF model to value the underlying firms, the actual processing of such information may be subject to various constraints, such as the ease with which to collect the information, resources available to the analyst, and the cost-benefit analysis of such information collection. To rule out the possibility that DCF analysis is just a label, we resort to textual analysis of analyst reports to capture analysts’ processing of cash flow and discount rate information. To the extent that analysts use DCF model in response to investor demand for cash flow and discount rate information, we expect to find analysts make more cash flow and discount rate discussions in their research reports when investors have stronger demand for such
5
information. Consistent with our predictions, we find strong support that analysts indeed make more cash flow analysis for firms with lower earnings quality, and more discount rate analysis for firms with higher risks.
Finally, we examine whether the informativeness of analyst investment opinions varies with the underlying valuation models. We use market adjusted cumulative abnormal returns within 3 days, 30 days, half a year and one year after the forecast date to capture the
informativeness of analyst research. We find that market reactions to the analyst buy
recommendations and target price changes based on DCF model are stronger than those based on PE model. Further analysis indicates that the differences in market reactions are more pronounced when analysts engage in more cash flow and discount rate discussions.
In further analysis, we find that the impact of investor demand on the use of DCF model and the discussions of valuation inputs is strengthened when the economic policy uncertain is high and is attenuated when the market sentiment is high. Our main findings remain qualitatively unchanged when we replace DCF model with absolute models which include DCF and other discount-rate based intrinsic valuation models, and replace PE model with multiple-based relative models using various accounting items. Our findings are robust to alternative proxies for analyst valuation details and alternative subsample.
Our paper is most closely related to Asquith et al. (2005) and Demirakos, Strong, and Walker (2010). Asquith et al. (2005) catalog the content of 1,126 reports by 56 star analysts from 1997 to 1999. Their sample shows that almost all reports use an earnings multiple, while only 9.5% of the reports use DCF model. They find that short-term market reaction is related to target prices and analyst’s textual justifications, but not to valuation methodology. Demirakos et al. (2010) examine 490 equity research reports for 94 UK-listed firms from 2002 to 2004. They find weak evidence that DCF model outperforms PE model in target price accuracy. Our sample covers a much longer period with a larger sample: there are 527,883 reports on 4,957 U.S. firms during 1997 to 2015 issued by 3,196 analysts. The larger sample size contributes to the power of tests
6
and the generalizability of our results. More importantly, based on the theoretical motivation for the value drivers, we find consistent evidence that investor demand for cash flow and discount rate information contributes to analysts’ supply of such value-relevant information, which facilitates their use of DCF model. Our study contributes to a better understanding of the valuation “black box” called for by Bradshaw (2009).
Our study also extends the study by DeFond and Hung (2003, 2007) who find that analysts tend to make cash flow forecasts when investors demand cash flows to interpret earnings
information. Since both cash flow and discount rate information drive the stock price movement, following the logic of DeFond and Hung (2003, 2007), we expect and find that investor demand for value-relevant information motivate analysts to provide more cash flow and discount rate information in their valuation process.
Our study adds to the literature on analysts’ assessment of firm risks. Lui et al. (2007) is the first to examine analysts’ risk assessment by using analyst risk ratings from Salomon Smith Barney and Citigroup during 1997-2003. They find that analysts’ risk ratings are largely explained by firm traits such as size, book-to-market, leverage, earnings quality, losses and idiosyncratic risks. A follow up study by Joos et al. (2016) uses the spread in Morgan Stanley analysts’ scenario-based (bull and bear scenarios) valuations to capture analysts’ attitude towards firm risks and find that the spread relates positively to firm riskiness such as beta, small size, financial distress, losses and idiosyncratic risk. Our study extends analysts’ risk assessment to their valuation process. We find that analysts engage in more discount rate analysis, an overall assessment of firm risks by analysts, for firms with higher risks, especially during high uncertainty period when investors find discount rate information valuable to their decision-makings.
The remainder of the paper is as follows. Section 2 discusses the theoretical framework and our hypotheses. Section 3 describes data and model specifications. Section 4 conducts empirical analysis, and Section 5 concludes.
7
2. Theoretical Framework and Hypotheses Development
2.1 Theoretical Framework for Firm Valuation
Our research question is centered on what drives analysts’ use of different models in firm valuation. To answer this question, we need to establish 1) what drives the stock price movement and 2) the relationship between valuation models and the value drivers. Chen et al. (2013)
theorize that stock prices move because of the revisions in expected cash flows and discount rates. They decompose stock returns into “Cash Flow News” due to cash flow information change and “Discount Rate News” due to discount rates change, and find that both components contribute to stock returns. 3 A major task for financial analysts is to provide target price forecasts and stock recommendations that reflect their expectations of the underlying firms’ future stock prices, usually during a horizon of six to 12 months.
Theoretically, both PE and DCF model incorporate analysts’ expectations of the underlying firm’s cash flows and discount rates. In the PE model valuation process, the firm value is
estimated by multiplying the earnings forecasts of the underlying firm with the P/E ratio of the comparable firms or the firm’s own historical value. PE model implicitly conveys analysts’ expected cash flows and discount rates assessment as follows. First, since stock prices respond to analyst earnings forecast revisions (Griffin 1976; Francis and Soffer 1997; Park and Stice 2000), earnings forecasts capture the marginal investors’ expectation of future cash flows. Chen et al. (2013) use analyst earnings forecasts to capture cash flows news in stock return decomposition. Second, the choice of comparable firms and the use of P/E ratios reflect analysts’ implicit risk assessment of the underlying firms. Comparable firms are chosen because they have future cash flow expectations proportional and risks similar to the underlying firms. In contrast, DCF model
3 The decomposition of stock returns into cash flow news and discount rate news is well documented in the finance literature, such as Campbell and Ammer (1993), Campbell and Shiller (1988), Campbell and Vuolteenaho (2004), Chen and Zhao (2009), and Bansal and Yaron (2004).
8
relies explicitly on multi-period cash flow forecasts and specific discount rates estimates for the underlying firms.
In practice, the efficiency of PE and DCF models in firm valuation depends on the appropriateness of the underlying assumptions. PE model valuation relies on two major assumptions: earnings are proportional to the firm value, and comparable firms are properly selected. In contrast, the usefulness of DCF model valuation depends on the assumptions that cash flows are proportional to the firm value, and discount rates are reliably estimated. Overall, both PE and DCF models have inherent limitations. Thus it is important to identify the contexts in which DCF model outperforms PE model, or vice versa, in analysts’ firm valuation.
Based on the decomposition of stock returns in Chen et al. (2013), we explore whether analysts’ tendency to use DCF model over PE model varies with investor demand for cash flow and discount rate information. Compared with PE model, DCF model provides direct cash flow forecasts and explicitly assesses firm risks through the discount rate estimates. We thus expect to find analysts more likely to use DCF than PE model when investors have stronger demand for cash flow and discount rate information. It is possible that analysts respond to investor demand by simply adopting the label of DCF model without providing any incremental valuation information in the report. To address this concern, we investigate whether analysts engage in more cash flow and discount rate discussions (the two major valuation inputs into DCF model) in their research report when investors have stronger demand for such information. Finally, we examine whether investors respond differently to analysts’ investment opinions justified by different valuation models. Our ultimate goal is to investigate the impact of investor demand for value-relevant information on the analyst valuation process.
9
2.2 Hypotheses Development2.2.1 Investor demand for cash flow and discount rate information and analysts’ use of DCF model
Our discussion in Section 2.1 suggests that analysts’ tendency to use DCF over PE model may vary with investor demand for cash flow and discount rate information. We elaborate how earnings quality affects investor demand for cash flow information, and firm risks for discount rate information, and how such investor demand for value-relevant information facilitates analysts’ use of DCF model.
While some studies find that earnings are superior to cash flows in firm valuation (Dechow 1994; Dechow et al. 1998; Liu et al 2002; Penman and Yehuda 2009), other studies show that cash flows provide incremental information relative to that contained in earnings, especially when earnings quality is low (Bowen et al. 1987; DeFond and Hung 2007). Defond and Hung (2003) find that investor demand for cash flow information increases for firms whose earnings are likely to contain material misstatements, which are less likely to reflect the
underlying economic activities. To the extent that low earnings quality adversely impacts the usefulness of PE model, we expect to find that investor demand for cash flow information would motivate analysts to use DCF model which relies crucially on thorough cash flow analysis. When analysts provide cash flow information, they implicitly provide investors their interpretation of the total operating accruals, which help investors to sort out the inferior part of earnings (McInnis and Collins 2011).
We expect investor demand for discount rate information to be stronger for firms with higher risks. This is because possible outcomes are more extreme and consequently have
potentially greater impact on stock price for riskier firms. While PE model implies analysts’ risk assessment and discount rate estimate through the selection of comparable firms and the use of
10
P/E ratios, analysts usually conduct thorough risk analysis to derive specific discount rate estimates in the DCF analysis.
Existing studies show that specific information is more valuable to investors, as less precise information is likely more difficult for investors to interpret, evaluate and verify (Bozanic et al. 2013). Heinle and Smith (2017) present a model of risk disclosures and conclude that more precise disclosures imply greater information content and investor attention. Hope et al. (2016) quantify the level of specificity of risk disclosures in the 10-K fillings and find it increases the market reaction to the 10-k fillings. In addition, they find that specific risk disclosures enhance analysts’ reliability in assessing firm risks. Therefore, we predict that investor demand for discount rate information for riskier firms motivate analysts to incorporate their discount rate assessment into the valuation process by using DCF model.
We note that the relation between analysts’ tendency to use DCF model and firms’ earnings quality and riskiness is not warranted for at least two reasons. First, analyst cash flow forecasts used in DCF model may not be informative to investors, which will reduce the usefulness of DCF model. Although research on analyst cash flow forecasts generally suggests cash flow forecasts provide incremental information to investors (DeFond and Hung 2003, 2007; Call et al. 2013), Givoly et al. (2009) claim that analyst cash flow forecasts are naïve extension of earnings forecasts by simply adding depreciation and amortization expenses back to earnings forecasts. If analyst cash flow forecasts do not provide additional information to earnings, the argument that investor demand for cash flow information from analysts for low earnings quality firms will not hold. Second, an increase in risk and uncertainty makes it tougher to implement the DCF valuation. Analysts need to spend extra efforts to forecast the valuation inputs into DCF model for riskier firms. The increased complexity and uncertainty may weaken analysts’ incentives to respond to investor demand by using DCF model.
11
Ultimately, it is an empirical question whether analysts are more likely to use DCF model for firms with lower earnings quality and higher risks. Our first hypothesis in an alternative form is as follows.
Hypothesis 1: Analysts are more likely to use DCF model than PE model to value firms with lower earnings quality and higher risks.
2.2.2 Investor demand and analysts’ assessment of cash flow and discount rate information While we expect investor demand for value-relevant information motivates analysts to use DCF model, the actual processing of cash flow and discount rate information may be subject to various constraints, such as the ease with which to collect the information, resources available to the analyst for information collection, and the cost-benefit analysis of such information collection. Opportunistic analysts might respond to investor demand by simply mentioning the application of DCF model or using DCF model but without much analysis into underlying cash flows and discount rates. To rule out the possibility that DCF is a label or cheap talk, we further examine whether investor demand for value-relevant information motivates analysts’ actual processing of DCF valuation inputs: the cash flow and the discount rate assessment.
DeFond and Hung (2003, 2007) find that analysts are more likely to provide cash flow forecasts for firms whose earnings are likely to be subject to misstatement. Lui et al. (2007) and Joos et al. (2016) show that analysts’ risk assessment largely reflect firm characteristics. To the extent that analysts are more likely to use DCF model to satisfy investor demand for value-relevant information and to the extent that the application of DCF model is justified by thorough cash flow and discount rate analysis, we predict that analysts make more cash flow and discount rate discussions for firms with lower earnings quality and higher risks respectively.
Taken together, we expect that investor demand for cash flow and discount rate information motivates analysts to engage in more such information analysis, which finally facilitates analysts’ use of DCF valuation model. Our second hypothesis is stated in an alternative form as follows.
12
Hypothesis 2: Analysts engage in more cash flow discussions for firms with lower earnings quality, and more discount rate discussions for firms with higher risks.
2.2.3 The informativeness of using DCF model
We expect that investors will find analyst investment opinions justified by DCF model more informative relative to those based on PE model. First of all, as stated in H1 and H2, DCF model incorporates additional insights into cash flow and discount rate information which are valuable to investors. In addition, DeFranco et al. (2015) find that analysts tend to choose firms with high valuations as peer companies when using relative valuation models. This suggests that the estimate of P/E ratio used in PE model is subject to bias, making PE model less informative compared with DCF model. We investigate the informativeness of analyst investment opinions by examining the market reactions differences to analyst recommendations and target price changes based on DCF model and PE model.
Given the concern that analysts’ application of DCF valuation models could be only a label, and do not incorporate much analysis into the underlying firms’ cash flows and discount rates. We predict that DCF models accompanied with more cash flows and discount rates discussions are more informative to investors. In other words, the differences in market reactions to analyst investment opinions justified by DCF model and PE model are more pronounced when analysts engage in more cash flows and discount rates discussions.
The above discussion leads to our last hypothesis on the informativeness of valuation models as follows.
Hypothesis 3: The market reactions to analyst investment opinions based on DCF model are stronger than those based on PE model, especially when DCF model is accompanied by more cash flows and discount rates discussions.
13
3. Data and Model Specifications3.1 Sample Selection
We retrieve sell-side analyst reports from eight of the top 15 banks in terms of the number of analyst reports available from Investext during 1997 to 2015. We develop a Java program to parse each analyst report to extract the following information: report number, name of the analyst and the brokerage firm, name and trading symbol of the covered company, analyst CFA
designation, and stock recommendations, target price forecasts, textual description on valuation process including models, cash flow, discount rate and risk, and total number of words.
We have 676,651 analyst reports from Investext matched to the I/B/E/S, CRSP and
Compustat. We delete reports without the disclosure of valuation models and with missing values of variables used in our study. Finally, we restrict our sample to analyst reports which include either DCF or PE as the dominant valuation model. To obtain analyst traits such as their working experience and coverage portfolio, we match Investext reports to the I/B/E/S U.S. database by brokerage firm names, analyst names and the underlying company identifiers that include trading symbols and company names. To ensure matching accuracy, we require the forecast dates in the Investext reports fall between the recommendation forecast announcement dates and review dates from the I/B/E/S. We obtain daily stock prices and returns from CRSP, and financial data from Compustat. We adjust for the discrepancies in the underlying currency among CRSP, the I/B/E/S and Investext by using daily exchange rates from Compustat. Our final sample consists of 527,883 reports on 4,957 U.S. firms from Investext from 1997 to 2015 issued by 3,196 analysts. Appendix A describes our sample selection process.
3.2 Procedures to Identify Valuation Models
We apply the following procedures to identify the dominant valuation models in analyst reports. We first randomly select 20,000 sentences from more than 10 million sentences extracted
14
from the cover pages of nearly half a million of analyst reports from the eight banks. We then assign each sentence to at least two research assistants to detect whether a valuation model is explicitly or implicitly used. We end up with around 1,700 sentences that indicate the use of a valuation model. From these sentences, we parse the text of a report to identify the use of a valuation model. We use a keyword search for those sentences that include the use of a valuation model to detect which model is used. The keywords include accounting items that we extract from the sentences that our RAs have flagged for the use of a valuation model and are
supplemented with terms from previous studies that indicate the use of a valuation model, such as Gordon Growth model and Enterprise Value Multiple.
Analysts usually mention multiple valuation models in a given report. To identify the dominant models in a report, we search for two sets of keywords that suggest the analyst is relying on a specific model to justify the stock recommendation and/or the target price. The first set of keywords relates to the research outputs of target price and recommendation, which includes the following keywords: price target, target price, PT, recommend, and
recommendation. The second set of keywords relates to an analyst’s action of applying a specific
valuation model to justify target price and recommendation, including use, using, based, basing, derive, derived, rating, and rate. In the same sentence that contains a valuation model pattern, if it also contains any of the research output or action keywords listed above, then the valuation model is regarded as the dominant model. If the scheme based on the above two sets of keywords does not reveal any dominant models in a report, then valuation models with a frequency of at least 3/4 of the most frequently used models in the report are considered as dominant models. We describe the procedure of defining dominant methods in Appendix C in detail.
Following Gleason et al. (2013) we classify the valuation models into two broad categories:
relative valuation models such as price-to-earnings (PE), price-to-book value (PB), price-to-sales (PSAL), and price-to-cash flows (PCF) that are compared with comparable peers to develop a relative value of the underlying company; and absolute valuation models such as DCF and RIM
15
that combine future cash flow forecasts or earnings forecasts with estimated discount rates. Based on the frequency distribution of valuation models from the reports and prior studies, we classify five models under the relative valuation category, including multiples based on earnings, sales, book value, cash flow, and others. Under the absolute valuation category, we include models that are cash flow-based, accrual-based and other types. Please refer to Appendix B for these
valuation model classifications and the major accounting items that we use to identify each model. Our focus is on the comparison between PE model and DCF model as they are
representative of relative and absolute models, respectively. In addition, PE model and DCF model are the most frequently used valuation models by analysts (Imam et al. 2013; Brown et al. 2015).
3.3 Model Specifications
We test H1 on the determinants of using DCF model by estimating the following logistic regression model:
𝐷𝐶𝐹 = 𝜕1+ 𝜕2𝐸𝑄 + 𝜕3𝑅𝑖𝑠𝑘 + 𝜕4∑ 𝐶𝑜𝑛𝑡𝑟𝑜𝑙𝑠 + 𝜕5𝑌𝑒𝑎𝑟 + 𝜕6𝐵𝑎𝑛𝑘 + 𝜕7𝐼𝑛𝑑𝑢𝑠𝑡𝑟𝑦 + 𝜀 (1)
Where DCF is a dummy equal to one if the dominant valuation model is DCF model, and zero if the dominant model is PE model. EQ denotes proxies for the demand for cash flow information. We use the abnormal accruals based on Modified Jones Model (Earnmgmt) and the absolute difference between net income before extraordinary items and operating cash flows divided by total assets (Accrual) to capture investor demand for cash flow information. Risk
denotes proxies for investor demand for discount rate information, measured with the following three firm risk traits: the standard deviation of quarterly operating cash flows during the past five years (CF_std), Loss, an indicator of negative earnings and Retstd12, 12 months Standard deviation of daily stock return before analyst report date.
16
We test H2 on the impact of investor demand on analyst cash flow and discount rate discussions by estimating the following OLS regression models.
𝑅𝑒𝑝𝐶𝐹 = 𝛼1+ 𝛼2𝐸𝑄 + 𝛼3∑ 𝐶𝑜𝑛𝑡𝑟𝑜𝑙𝑠 + 𝛼4𝑌𝑒𝑎𝑟 + 𝛼5𝐵𝑎𝑛𝑘 + 𝛼6𝐼𝑛𝑑𝑢𝑠𝑡𝑟𝑦 + 𝜀 (2𝑎) 𝑅𝑒𝑝𝐷𝑅 = 𝛽1+ 𝛽2𝑅𝑖𝑠𝑘 + 𝛽3∑ 𝐶𝑜𝑛𝑡𝑟𝑜𝑙𝑠 + 𝛽4𝑌𝑒𝑎𝑟 + 𝛽5𝐵𝑎𝑛𝑘 + 𝛽6𝐼𝑛𝑑𝑢𝑠𝑡𝑟𝑦 + 𝜀 (2𝑏)
We measure analyst cash flow discussions in their reports with the number of cash flow keywords (RepCF), and analyst discount rate discussions with the number of discount rate keywords (RepDR).
We test H3 on the informativeness of valuation models by estimating the following OLS regression models.
𝐶𝐴𝑅𝑡 = 𝛾1+ 𝛾2𝑆𝑖𝑔𝑛𝑎𝑙 + 𝛾3𝐷𝐶𝐹 + 𝛾4𝑆𝑖𝑔𝑛𝑎𝑙 ∗ 𝐷𝐶𝐹 + 𝛾5∑ 𝐶𝑜𝑛𝑡𝑟𝑜𝑙𝑠 + 𝛾6𝑌𝑒𝑎𝑟 + 𝛾7𝐵𝑎𝑛𝑘 + 𝛾8𝐼𝑛𝑑𝑢𝑠𝑡𝑟𝑦 + 𝜀 (3)
Where 𝐶𝐴𝑅𝑡 is market-adjusted cumulative abnormal return starting one day before to t
days after the issuance of an analyst report. Signal indicates analyst investment opinions. We use
Buy and Sell, the indicators of analyst recommendation types to measure the recommendation opinions and use TPchg, the change of analyst target price forecast scaled by the stock price at the beginning of the year, to measure the target price opinions. We test whether the informativeness of DCF model varies with the extent of analyst cash flow and discount rate discussions by partitioning the sample into high and low subsamples according to the yearly median values of
RepCF and RepDR. We then test whether there is a difference in 𝛾4 between the high and low subsamples.
Controls refer toa vector of firm,analyst and report characteristics. The firm characteristics include firm size (Logmv), sales growth (Salesgrowth), systematic risk (Beta), and stock return (Arpre12). The analyst and report characteristics include the total number of an analyst report words (Repword), industry expertise (Indexport), firm experience (Firmex), recommendation type
17
(Buy), and CFA designation (CFA). We also control for year, bank, and industry fixed effects. Appendix D shows the variable definitions in detail. The standard errors areadjusted for firm and year clustering.
3.4 Descriptive Statistics
Table 1 Panel A shows the yearly distribution of the key variables. We find that on average 19% of the analyst reports use DCF as the dominant valuation models to justify
recommendations and/or target prices4. The popularity of DCF model has increased over years, with an increase from 3% in 1997 to more than 21% in recent years5. Given the variations of DCF model over years, we include year fixed effects in all estimations. In addition, we show that on average each analyst report has three words on cash flow analysis and one word on discount rate analysis.
Panel B of Table 1 presents the total number of analyst reports, firms and analysts by Fama-French 12 digit sectors, along with the proportion of using DCF model. Panel B indicates that there is a considerable variation in the proportions of analyst reports using DCF model across industries. For example, while analysts use DCF model for 43 % of their reports to evaluate firms from Telephone and Television Transmission industry, they only use DCF model for 9% of their reports to evaluate firms from the Manufacturing industry. In addition, Panel B shows that the proportion of firms being valued with DCF model and the proportion of analysts using DCF model are the highest in Utilities and Telephone and Television Transmission. Given the variation, we include industry fixed effects in all estimations.
[Insert Table 1 Here]
4
In unreported table, we find that 54% of analysts and 55% of firms have ever used DCF model as the dominant model during the sample period
5 We observe a similar increasing trend of firms valued with (an increase from 6 % in 1997 to 52% in 2015) and analysts using DCF model (an increase from 11% in 1997 to 58% in 2015).
18
Table 2 Panel A describes the summary statistics of key variables used in our study. The average earnings management is 0.062, and the total accrual is 0.071. For firm risks, it shows that firm operation cash flow volatility is 0.058, and 18% firms experience negative earnings. In
addition, the average stock return standard deviation 12 months before the report date is 2.39. 63% of analyst reports include cash flow keywords, and 49% of analyst reports include discount rate keywords.
Table 2 Panel B presents the Pearson correlation analysis of our key variables. The table shows that DCF indicator is positively associated with poor earnings quality and high firm risks (except for Retstd12). Moreover, it suggests that analyst cash flow and discount rate discussions are positively related to their tendency to use DCF model. We note that the variables within earnings quality and firm risk categories are highly correlated. For example, the correlation between Earnmgmt and Accrual is 0.644, and the correlations among CF_std, Loss, and Retstd12
are between 0.353 and 0.420. The high correlations suggest that there might be multicollinearity issues when we pool these variables into one regression.
[Insert Table 2 Here]
4. Empirical Analyses
4.1 Investor Demand for Cash Flow and Discount Rate Information and the Use of DCF Model
Table 3 reports the logistic regressions on the determinants of using DCF model. The dependent variable is DCF equal to one if the dominant valuation model in a report is DCF model, and zero otherwise. Column (1) to (2) tests the impact of investor demand for cash flow
information on analyst tendency to use DCF model. We find significantly positive coefficients on
Earnmgmt and Accrual , indicating that analysts are more likely to use DCF model for firms with lower earnings quality.
19
Column (3) to (5) tests the impact of investor demand for discount rate information on analyst tendency to use DCF model. We find significantly positive coefficients on CF_std, Loss,
and Retstd12. The findings indicate that analysts are more likely to use DCF model to value firms with higher risks. In column (6), we pool all the earnings quality and firm risks variables in a regress and the results are qualitatively unchanged. Taken together, we show that analysts tend to use DCF model in response to investor demand for firm’s cash flow and discount rate information.
For control variables, we find that analysts tend to use DCF model to value growth firms as proxied by Salesgrowth, consistent with the findings in Demirakos et al. (2010). The significant and positive coefficients on analyst report length (Repwords) suggest that DCF analysis involves more detailed information provided by analysts. We also find some evidence that analysts tend to use DCF model to justify their buy recommendations. This may be because investors think analysts’ buy recommendations are subject to optimistic bias, analysts thus use DCF model to increase the credibility of their favorable recommendations. In addition, we find that the tendency to use DCF model is negatively associated with beta. We also find that analysts with more industry and firm coverage experience are less likely to use DCF model. This is because rich experiences could aid analysts to make efficient judgments in the PE valuation process, such as choosing appropriate peer firms and estimating P/E ratios, which will reduce the usefulness of DCF model over PE model. We find insignificant coefficients on Arpre12 and CFA, suggesting that the likelihood of using DCF model is not associated with the underlying firm’s past
performance and the analyst CFA designation.
[Insert Table 3 here]
4.2 Investor Demand and Analysts’ Discussions on Cash Flow and Discount Rate Information
Table 4 reports regression results on the impact of investor demand for value-relevant information on analysts processing of cash flow and discount rate information. Column (1) to (2)
20
tests the impact of firm earnings quality on the number of analyst cash flow discussions in their reports. We document significantly positive coefficients on Earnmgmt and Accrual, suggesting that analysts engage in more cash flow discussions for firms with lower earnings quality.
Column (3) to (5) tests the impact of firm risks on the number of analyst discount rate discussions in their reports. The coefficients on three risk variables: CF_std, Loss, and Retstd12
are significantly positive, indicating that analysts engage in more discount rate discussions for firms with higher risks. Taken together, Table 4 suggests that analysts’ use of DCF model is not a label, but incorporating detailed cash flow and discount rate discussions when investors have stronger demand for such information. Our H2 is supported.
For control variables, we find that analyst processing of cash flow and discount rates is positively associated with firm growth rate (Salesgrowth), past abnormal return (Arpre12), the length of analyst reports (Repwords), and the issuance of buy recommendations (Buy). We also document that analysts make fewer cash flow and discount rate discussions for firms with larger size (Logmv) and higher beta (Beta) and when analysts have richer industry (Indexpert) and firm coverage experiences (Firmexp). We find no significant evidence that analysts’ CFA designation has an effect on their processing of value-relevant information.
[Insert Table 4 here]
4.3 Robustness Tests
4.3.1 Cross-sectional analysis on investor demand for DCF model
Table 5 Panel A reports the impact of economic policy uncertainty on investor demand for DCF valuation model. Loh and Stulz (2018) find that analyst research is more valuable in bad times since investors rely more on analysts in bad times. Similarly, we expect that investor demand for analyst using DCF model is stronger when the economic policy uncertainty is higher. Using the data from Baker, Bloom, and Davis (2016), we use EPU to proxy for the economic policy uncertainty.
21
Column (1) to (5) tests the impact of EPU on the positive relation between investor demand for value-relevant information and analyst tendency to use DCF model. To test the incremental effect under high EPU, we interact EPU with investor demand for cash flow and risk variables. For simplicity, we put investor demand variables on the top of regressions and use the label Trait
to stand for Earnmgmt, Accrual, CF_std, Loss, and Retstd12respectively from column (1) to (5). We find significantly positive coefficients on the interaction item EPU*Trait, suggesting that high economic policy uncertainty strengthens the effect of investor demand for cash flow and discount rate information on analysts’ tendency to use DCF model.
Column (6) to (10) tests the impact of EPU on the positive relation between investor demand for value-relevant information and analyst processing of such information. The
independent variables are the same as in column (1) to (5). The dependent variable is RepCF in column (6) to (7), and RepDR in column (8) to (10). The coefficients on the interactions of
EPU*Trait are significantly positive, suggesting that analysts engage in more cash flow discussions and discount rate discussions in response to investor demand for such information when the economic policy uncertainty is high. The results in Panel A Table 5 provide
corroborating evidence that investor demand for value-relevant information has an impact on analyst valuation process.
Table 5 Panel B reports the impact of market sentiment on investor demand for DCF model. As PE model incorporates the market sentiment in the estimate of P/E ratio, we expect that
investor demand for DCF model is weakened when the market is hot. We use Sentiment, the University of Michigan consumer sentiment index, to capture the market sentiment. We then repeat the analyses in Panel A by replacing EPU with Sentiment. The results are reported in Panel B. We find significantly negative coefficients on Sentiment*Trait (8 out of the10 regressions), suggesting that investor demand for analysts using DCF model and discussing cash flow and discount rate information is attenuated when the market sentiment is high.
22
4.3.2 Compare absolute model with relative modelIn the discussion above, we only consider and compare analysts’ use of DCF model and PE model. Table 6 considers all the valuation models used by analysts in their reports. Following Gleason et al. (2013), we classify valuation models into absolute and relative valuation models6. As we include all the valuation models, the sample size used in this section is larger than that used in the main analyses. The sample consists of 577,772 analyst reports with 122,647 reports using absolute valuation models and 457,934 reports using relative valuation models7.
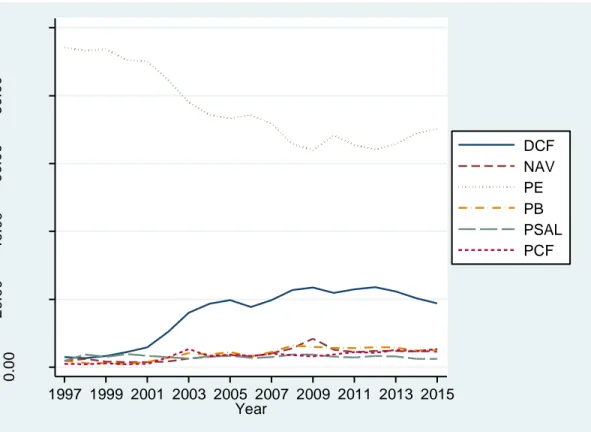
Panel A in Table 6 reports the distribution of the major valuation models with an average of at least 3% used by analysts in their reports. We observe that DCF model and PE model are the most frequently used models under the absolute and relative model category, one of the reasons why we focus on the comparison between DCF and PE model. Except for DCF model, another frequently used absolute model is NAV model with an average of 4% analyst reports usage. We find that the use of RIM model is almost zero in our sample (not reported in the table), suggesting that prior studies assuming RIM model to be the legitimate way that analysts use their earnings forecasts for recommendations did not capture the actual use of valuation models by analysts. In addition, the small proportion of RIM used by analysts is consistent with Hand et al. (2017) who document that the use of RIM models is only 5% of the use of DCF models. Under the relative model category, we show that PB, PSAL, and PCF models are used by analysts with an average ratio of 4%, 3%, and 3%. Figure 1 shows the distributions of valuation models over years.
Panel B in Table 6 shows the determinants of using absolute over relative models. The dependent variable Absolute is an indicator, which equals to one if the dominant valuation model is absolute model and zero if the dominant model is relative model. Investor demand for cash flow and discount rate information variables are the same as in Table 3. Consistent with the
6 Please refer to appendix B for the specific valuation models under the absolute and relative model categories.
7 The reason that the sum of absolute and relative valuation models is larger than the full sample size is because analysts might use both absolute and relative models in one report to justify their recommendations and target prices.
23
findings in Table 3, we show that analysts are more likely to use absolute models to value firms with lower earnings quality and higher risks.
[Insert Table 6 here] 4.3.3 Compare DCF with PCF model
To further examine the impact of investor demand for discount rate information on analysts’ valuation model choice, we control for investor demand for cash flow information bycomparing DCF with price-to-cash flows (PCF) models. While both DCF and PCF models rely on the input of cash flow forecasts, DCF entails an additional input of discount rates which largely reflects the underlying firm’s risks. Given the major difference between DCF and PCF model lies in discount rate assessment, we expect that analysts’ tendency to use DCF over PCF model is positively related to investor demand for discount rate information, but not related to investor demand for cash flow information.
Panel C in Table 6 reports the logit regressions on the likelihood of using DCF over PCF model. We have observations of 122,610 analyst reports, including 101,809reportsusing DCF model and 20,801 reportsusing PCF model. The dependent variable DCF_PCF equals to one if the dominant valuation model is DCF and zero if the dominant model is PCF. Column (1) to (2) shows that the coefficients on Earnmgmt and Accrual are not significant, suggesting that analysts’ tendency to use DCF over PCF model is not related to earnings quality. Both DCF and PCF models could satisfy investor demand for cash flow information for firms with lower earnings quality.
Columns (3) to (5) show that DCF_PCF indicator is significantly positively associated with the three firm risk variables (CF_std, Loss, and Retstd12), suggesting that investor demand for discount rate information influence analysts’ choice between DCF and PCF model. The comparison between DCF and PCF model lends further support to our investor demand hypotheses on analysts’ choice of valuation models.
24
4.3.4 Compare pure DCF and pure PE modelTo eliminate the effect of the hybrid models for which an analyst report uses both DCF and
PE as the dominant models, we construct a new variable PureDCF which equals one if an analyst report only uses DCF as the dominant model, and zero if it only uses PE as dominant model. After excluding analyst reports that use both DCF and PE model as the dominant models, we are left with 475,977 analyst reports, including 49,903 reports only using DCF as the dominant valuation model. In unreported tests, we find that analysts are more likely to use pure DCF model than pure PE model for firms with poorer earnings quality and higher risks.
4.3.5 Alternative measurement of analyst cash flow and discount rate discussions
Analysts from different banks may have the boilerplates to write their research reports. As a result, analysts from certain banks may randomly mention cash flows and discount rates in their reports rather than intentionally discuss the information in response to investor demand. We control for bank fixed effect to address this concern in the previous analyses. In this section, we further address this concern by ranking analyst cash flow and discount rate discussions for each bank-year in quintiles. We thus have two new measurements: RepCF5d, the rank of RepCF by bank year, range from 1 to 5, and RepDR5d, the rank of RepDR by bank year, range from 1 to 5. We use tobit regression to repeat the analyses in Table 4. Table 7 reports the results. Consistent with the findings documented in Table 4, we find that the quintile ranks of RepCF and
RepDR are also significantly positively related to poor earnings quality variables and high firm risk variables (except for Retstd12) respectively. Overall, our main findings are qualitatively unchanged.
[Insert Table 7 here] 4.3.6 Alternative subsamples
We perform two robustness tests using alternative subsamples. First, we conduct our analysis in the subsample that each analyst follows at least two firms and uses both DCF and PE models in a given year. Second, analysts usually issue multiple reports for a given firm-year. To
25
reduce the impact of repeated observations, we restrict our sample to one observation per analyst-firm-year. In unreported tests, we show that our main findings are qualitatively unchanged.
4.4. The Informativeness of Analyst Valuation Model
We predict that investors demand analysts to use DCF model in settings where cash flow information and discount rate information are likely to be more useful in assessing firm value. While the results of our hypotheses tests are consistent with this prediction, this section seeks corroborating evidence by examining whether the market reaction to analyst investment opinions justified by DCF model is stronger than that justified by PE model. Furthermore, we examine whether the market reaction differences are more pronounced when analysts make more cash flow and discount rate discussions.
4.4.1 Stock recommendations
Table 8 tests the informativeness of analyst valuation model by using recommendations as the investment opinions. Panel A in Table 8 reports the baseline analysis. The dependent variable
CARt is the market-adjusted cumulative abnormal return starting from one day before to t days after the report date. We examine 3 days, 30 days, half a year, and one-year horizons. In Column (1) to (4), we interact both Buy and Sell indicators with DCF in the regressions, but focus on the coefficients of Buy*DCF. This is because sell-side analysts have long been criticized to be optimistic for their earnings forecasts and stock recommendations (Easterwood and Nutt, 1999; Bradshaw et al., 2003). We expect to find that the use of DCF model increases the credibility of the buy recommendation. The coefficients of Buy*DCF are positive in all the four regressions, with a significance level at 5% in Column (1) and (2). Overall, investors react more strongly to the buy recommendations when they are justified by DCF model than those justified by PE model.
The effect of valuation models on analysts’ sell stock recommendations can be mixed. If DCF model increases the quality and credibility of analysts’ pessimistic forecasts, then the market reactions would be more negative to sell recommendations based on DCF model compared with
26
those based on PE model. However, if DCF model mitigates the extent to which analysts shy away from pessimistic forecasts and thus leads to more forthcoming releases of pessimistic recommendations, then we expect sell recommendations based on DCF model elicit less negative market reaction compared with those based on PE model. Therefore, the net effect of valuation models on sell stock recommendations is an empirical question. In Column (1) to (2), the coefficients on Sell*DCF are positive, and significantly positive in 3 days horizon, suggesting that the use of DCF model attenuating the negative market reaction to analyst Sell
recommendations. However, the coefficients of Sell*DCF turn to be negative with no significance in half a year and one year horizons as shown in Column (3) and (4).
In Column (5) to (8), we interact both Buy and Sell indicators with RepCF to test whether investors value the stock recommendations more when they are accompanied with more cash flow discussions. The coefficients of Buy*RepCF are significantly positive in 3 days and 30 days horizons. We do not find such significance in the half a year and one-year horizons. Overall, it suggests that the market reactions to the analyst buy recommendations are stronger when the recommendations are accompanied with more cash flow discussions.
In column (9) to (11), we test whether investors value the stock recommendations more when they are accompanied with more discount rate discussions. We find that the interaction of
Buy*RepDR is positively related to the cumulated abnormal return in 3 days horizon at 1% significance level and 30 days horizon at 10% significance level, and with no significance in half a year and one-year horizons. Overall, we find some evidence that market reactions to the analyst buy recommendations are stronger when they are accompanied with more discount rate
discussions.
We also find that firm size and growth rate are significantly negatively related to the market-adjusted abnormal return. We have weak evidence that Beta is negatively associated with the CARt. This finding is consistent with the mixed findings on market beta and stock returns. For example, Kothari et al. (1995) find that beta is positively related to stock returns, while Fama and
27
French (1992) find no relation between beta and stock returns, and Easley et al. (2002) find a negative association between the two. The coefficient on Apre12 is significantly positive because of the price momentum.
Panel B in Table 8 examines whether the market reactions differences observed in Panel A column (1) to (4) are more pronounced when the DCF model is accompanied with more cash flow and discount rate discussions. To test this, we partition the sample into two subsamples according to the yearly median value of RepCF and RepDR and then redo the analyses in column (1) to (4). For simplicity, we only report the abnormal return in 3 days and one-year horizons. The results in other horizons are qualitatively unchanged. We find that the coefficients on Buy*DCF
are significantly positive in the groups with high cash flow and discount rate discussions, and not significant in the low groups. This suggests that DCF model accompanied with more cash flow and discount rate analysis are more valuable to investors.
[Insert Table 8 here] 4.4.2 Target prices
In addition to recommendations, we also test the informativeness of analyst valuation model by using target price changes as the investment opinions in Table 9. Given the missing value of target price and its changes, our sample tested in Table 9 is reduced to 447,940 analyst reports. Panel A in Table 9 reports the baseline analysis. Except in 3 days horizons, the
coefficients on Tpchg*DCF are significantly positive, suggesting that market reactions to target price changes justified by DCF model are stronger than those justified by PE model. We also find that the coefficient on TPchg*RepCF and TPchg*RepDR aresignificantly positively in short horizons, consistent with the evidence that analyst investment opinions accompanied with more cash flow and discount rate analysis cause stronger investors’ reactions.
In Table 9 Panel B, we partition the sample into two subsamples according to the yearly median value of RepCF and RepDR. We find that the stronger market reactions to target price changes riding on DCF model are mainly restricted in groups with high cash flow and discount
28
rate discussions. The findings further demonstrate that the mere mention of DCF model is not useful to investors. DCF model is valuable unless it is accompanied with detailed valuation inputs analysis.
[Insert Table 9 here]
5. Conclusions
This study examines whether investor demand for value-relevant information plays a role in the analyst valuation process. Our study responds to the call from Bradshaw (2011) for more research into how analysts perform their tasks, specifically how analysts process the information to justify their recommendations and target prices.
Our analyses are based on the theoretical framework by Chen et al. (2013) who find that stock price moves because of the change in cash flow and discount rate news. Compared with PE model, DCF model incorporates explicitly cash flow and discount rate estimates. We expect that investor demand for value-relevant information will motivate analysts to use DCF model rather than PE model to value the underlying firms. In addition, we investigate whether analysts indeed engage in more qualitative cash flow and discount rate discussions with the increase of investor demand for such information. We capture investor demand for cash flow and discount rate information with firm earnings quality and risks respectively.
Using a content analysis for a large sample of analyst reports, we find that analysts are more likely to use DCF model for firms with lower earnings quality and higher risks in response to investors’ stronger demand for cash flow and discount rate information for these firms. In addition, we find that analysts make more qualitative cash flow and discount rate discussions when investor demand for such information increases, indicating that analysts actually spend extra efforts in preparing the use of DCF model. Finally, we find that investors react more strongly to analyst investment opinions justified by DCF model compared with PE model.
29
Additional evidence suggests that the differences are mainly observed in the groups with high analyst cash flow and discount rate discussions.
We acknowledge that this study is essentially exploratory in nature, and has its limitations. In particular, we do not explain the increasing trend of using DCF. In addition, there could be other factors that affect analysts’ choice among valuation models but are not identified in our studies. We leave these for future studies.
30
Appendix A: Sample selectionNumber of Reports Number of Firms Number of analysts
Analysts' reports from Investext 676,651
Less: Analysts' reports without disclosure of valuation models 39,639
less: Missing value of variables 59,428
Less: If the dominant valuation models are not DCF or PE 49,699
31
Appendix B: Classification of valuation methods Valuation Model Key itemsRelative models
Earnings multiples (PE) P/E, PEG, P/EBITDA, EV/EBITDA, EV/EBIT, EV/EBITA, EBITDA/MV, EV/EBIAT
Sales multiples (PSAL) P/S, EV/Sale, MV/sale, Revenue Book value multiples (PB) P/B, EV/B, MV/B
Cash flow multiples (PCF) CF/EV, P/CF, DY
Other relative models MV/NI, NIBE/MV, RPE, DFE, EV/OIBDA, P/A,Gross Operating Margin, REP, NOA/EV, EV/R&D, Embedded value multiple, ROEg/COEg
Absolute models
Cash flow based (DCF) DCF, DDM, GGM, CRR, CFROI, Real Options
Accrual based NAV, RIM, EVA
Other absolute models Continuing value, Technology value, Warranted equity model, ARR, Return on embedded value, Return on Capital Employed, Residual Earnings
Appendix C: Algorithms to identify valuation models from analyst reports
We notice that analyst usually mention multiple valuation models in each of their research reports. To identify the dominant models in a report, within the sentences that contain the key valuation items as defined in Appendix B, we search for two sets of keywords that suggest the analyst is relying on a specific model to justify the stock recommendation and the target price:
A. The first set of keywords relates to the research outputs of target price and recommendation which includes the following keywords: price target, target price, PT, recommend, and recommendation.
B. The second set of keywords relates to an analyst’s action of applying a specific valuation model to justify target price and recommendation, including use, using, based, basing, derive, derived, rating, and rate.
If a report satisfies either Algorithm A or B above, the valuation models mentioned in these sentences would be classified as dominant models. In cases where the above coding scheme does not reveal any dominant model, we examine the frequency of valuation model occurrence in the reports. The valuation models with frequency of at least 3/4 of the most frequently used models in the report are defined as dominant models.
We set the distance between the accounting terms (such as P/E, EPS) and the keyword lists (such as target price, base, using) in Algorithm A and B to be within 30 words. For example, there are 9 words between the keyword list "target price" and the accounting term "BPS" below.
“Our target price through April 2007 is ¥3,155, based on our average BPS estimate for FY2006 and FY2007, and a multiple of 1.4x, the sector average.”
Appendix D: Variable definitions
Variable Definition and data source Valuation models
DCF Dummy equals to one if analysts use DCF model as the dominant valuation model, and
zero if the dominant valuation model is PE only.
PureDCF Dummy equals to one if analysts only use DCF model as the dominant valuation model,
and zero if the dominant valuation model is PE only.
DCF_PCF Dummy equals to one if the dominant valuation model is DCF and zero if the dominant
32
Absolute Dummy equals to one if the dominant valuation model is absolute model and zero if the
dominant model is relative model. Demand for cash flow information
Earnmgmt Abnormal accruals based on Modified Jones Model in year t-1
Accrual Absolute difference between net income before extraordinary items and operating cash
flows divided by total assets in year t-1 Demand for risk information
CF_std Five years standard deviation of quarterly operating cash flows scaled by total assets
before analyst report date
Loss An indicator of negative earnings.
Retstd12 12 months Standard deviation of daily stock return before analyst report date. Analyst cash flow and discount rate Discussion
RepCFdum Dummy equals to one if analysts make cash flow keywords discussions and zero if
analysts do not mention any cash flow keywords
RepCF The number of cash flow keywords discussed by analysts in their reports
RepDRdum Dummy equals to one if analysts make discount rate keywords discussions and zero if
analysts do not mention any discount rate keywords
RepDR The number of discount rate keywords discussed by analysts in their reports Analyst investment opinions and market reactions
CARt Market-adjusted cumulative abnormal return starting one day before to 3 days, 30 days,
183 days and 365 days after the issuance of an analyst report
Buy Dummy equals to one if analyst issue an buy recommendation and zero otherwise
Sell Dummy equals to one if analyst issue an sell recommendation and zero otherwise
TPchg change of analyst target price forecast scaled by the stock price at the beginning of the
year Control variables
EPU Theproxy for economic policy uncertainty from Baker, Bloom, and Davis (2016).
Sentiment the University of Michigan consumer sentiment index
Logmv The logarithm of firm market value in year t-1.
Salesgrowth Year t - 1 revenues less year t - 2 revenues scaled by year t - 2 revenues
Beta Market beta calculated from CAPM model
Arpre12 12-month abnormal return before the issue of an analyst’ report.
Repwords The logarithm of the total number of analyst report words.
Indexpert The logarithm of the number of firms in a two-digit SIC industry covered by the analyst
in year t
Firmex The number of years an analyst has been following a firm
33
ReferenceAsquith, P., M. B. Mikhail, and A. S. Au. 2005. Information content of equity analyst reports.
Journal of Financial Economics 75 (2):245-282.
Baker, S. R., N. Bloom, and S. J. Davis. 2016. Measuring economic policy uncertainty. The Quarterly Journal of Economics 131 (4):1593-1636.
Bansal, R., and A. Yaron. 2004. Risks for the long run: A potential resolution of asset pricing puzzles. The Journal of Finance 59 (4):1481-1509.
Barniv, R., O. K. Hope, M. J. Myring, and W. B. Thomas. 2009. Do Analysts Practice What They Preach and Should Investors Listen? Effects of Recent Regulations. The Accounting Review 84 (4):1015-1039.
Bowen, R. M., D. Burgstahler, and L. A. Daley. 1987. The incremental information content of accrual versus cash flows. Accounting Review:723-747.
Bozanic, Z., D. Roulstone, and A. Van Buskirk. 2013. Management earnings forecasts and forward-looking statements. SSRN eLibrary.
Bradshaw, M. T. 2004. How do analysts use their earnings forecasts in generating stock recommendations? The Accounting Review 79 (1):25-50.
———. 2009. Analyst information processing, financial regulation, and academic research. The Accounting Review 84 (4):1073-1083.
Bradshaw, M. T. 2011. Analysts’ forecasts: what do we know after decades of work? Available at SSRN 1880339.
Bradshaw, M. T., S. A. Richardson, and R. G. Sloan. 2003. Pump and dump: An empirical analysis of the relation between corporate financing activities and sell-side analyst research.
Brown, L. D., A. C. Call, M. B. Clement, and N. Y. Sharp. 2015. Inside the “Black Box” of Sell-Side Financial Analysts. Journal of accounting research 53 (1):1-47.
Call, A. C., S. Chen, and Y. H. Tong. 2013. Are analysts' cash flow forecasts naïve extensions of their own earnings forecasts? Contemporary Accounting Research 30 (2):438-465. Campbell, J. Y., and J. Ammer. 1993. What moves the stock and bond markets? A variance
decomposition for long‐term asset returns. The Journal of Finance 48 (1):3-37. Campbell, J. Y., and R. J. Shiller. 1988. The dividend-price ratio and expectations of future
dividends and discount factors. The Review of Financial Studies 1 (3):195-228.
Campbell, J. Y., and T. Vuolteenaho. 2004. Bad beta, good beta. American Economic Review 94 (5):1249-1275.
Chen, L., Z. Da, and X. Zhao. 2013. What Drives Stock Price Movements? Review of financial studies 26 (4):841-876.
Chen, L., and X. Zhao. 2009. Return decomposition. The Review of Financial Studies 22 (12):5213-5249.
Da, Z., K. P. Hong, and S. Lee. 2016. What Drives Target Price Forecasts and Their Investment Value? Journal of Business Finance & Accounting 43 (3-4):487-510.
De Franco, G., O.-K. Hope, and S. Larocque. 2014. Analysts’ choice of peer companies. Review of Accounting Studies 20 (1):82-109.
Dechow, P. M. 1994. Accounting earnings and cash flows as measures of firm performance: The role of accounting accruals. Journal of Accounting and Economics 18 (1):3-42.
Dechow, P. M., S. P. Kothari, and R. L. Watts. 1998. The relation between earnings and cash flows. Journal of Accounting and Economics 25 (2):133-168.
DeFond, M. L., and M. Hung. 2003. An empirical analysis of analysts’ cash flow forecasts.
Journal of Accounting and Economics 35 (1):73-100.
———. 2007. Investor protection and analysts’ cash flow forecasts around the world. Review of Accounting Studies 12 (2-3):377-419.
Demirakos, E. G., N. C. Strong, and M. Walker. 2010. Does Valuation Model Choice Affect Target Price Accuracy? European Accounting Review 19 (1):35-72.