Munich Personal RePEc Archive
The Invisible Collateral
Muduli, Silu and Dash, Shridhar Kumar
Reserve Bank of India, Xavier Institute of Management,
Bhubaneswar, India
7 December 2019
Online at
https://mpra.ub.uni-muenchen.de/103687/
The Invisible Collateral
Silu Muduli*Reserve Bank of India
Shridhar Kumar Dash†
Xavier Institute of Management
Abstract
A borrower may hesitate to borrow from her close relatives and family members as it costs them in terms of reduction in social insurance in the case of default. This invisible cost reduces credit risk. India’s household indebtedness survey shows some evidence on these borrowing preferences. This perspective on borrowing decisions derived from the community can be used as one of the dimensions in credit risk evaluation and in policy formulation.
Keywords:Network, Trust, Credit Risk.
JEL Classification:G21, D82, C92.
1
Introduction
In a society, reciprocity behaviour among members help individuals achieve social and economic objectives. Rational individuals in communities strategically become part of social network to reap the benefits by being a part of it (Jackson & Watts,2002). Inside the network, when individuals cooperate with each other, they could act collectively to gain economic values. The level of cooperation will depend on the level of trust among individuals inside the network. This kind of trust in a network acts as a lubricant in economic transactions among the members of the network (Arrow,1974). Thus, we can argue that an individual’s pay-off to participate in the network will be a function of an ex ante assigned belief or trust by the individual on certain actions of others inside the network. Therefore, individuals in the network is likely to build trust over time to enjoy the benefits of being trustworthy (Coleman,1988;Granovetter,1985). Any loss of trustworthiness in the network will bring disutility for the individual, as others may not cooperate with her as before.
Inside a social network, loss of trustworthiness is most likely to be reflected in frequency, and amount of financial transactions among members of the network. In informal credit market, pledged collaterals in case of secured credit acts as a deterrent for borrowers to default. However, in case of unsecured credit, borrower is likely to lose non-monetary collateral in the form of social trust in the network (Karlan et al.,2009). We call this as invisible collateral, because the trustworthiness is invisible to public in general. However, this invisible collateral can be a deterrent for the borrower to default.
The problem with invisible collateral is that it cannot be estimated directly by the lender. Besides, existence of invisible collateral affects the risk associated with both secured and unsecured credit. Nevertheless, invisible collateral enables lenders to engage with borrowers because in case the borrower defaults, the loss in social trust inside the network will result in reducing social benefits arising out of accessing credit in future (Guiso et al., 2004). Therefore, for an individual there will be a cost of default, which can be termed as social cost of default, which is directly proportional to loss in invisible collateral. In case social cost of default for an individual in a
The views expressed in the paper are those of the author(s) and not necessarily those of the institution to which they belong.
*Manager, Reserve Bank of India, India.E-mail:[email protected]
network is high then the invisible collateral for the same individual is high, hence the individual is less likely to default and vice-versa.
In this article we provide a perspective on individuals’ social behaviour inside the network and its implications on credit risk evaluation by the lender. We use India’s household indebtedness survey data, to argue for the existence of invisible collateral and its linkages with social cost of default for both rural and urban areas.
2
Social Cost of Default
Social cost of default is the dis-utility of reduction of social trust for an individual in the network when the individual defaults on a credit.Lee & Persson(2016) call this as shadow cost, which discourages credit default. This is different from peer pressure in case of joint liability lending program. In case of joint liability lending design, members pressurise the individual to repay back the credit, and this pressure is external in nature. In this case the individual is paying not out of own choice, but due to peer pressure. Whereas social cost of default is completely internal to individual, and the individual will pay back the credit even without any peer pressure when social cost of default of the individual is very high. At the same time, an individual having very low social cost of default (who does not care about her social reputation) will have less incentive to repay the loan.
We can argue that the social cost of default arises from two components - the stand-alone cost of default to the individual and cost of default due to imitation effect from other members of her network. Standalone cost is the core component, which is a function of self-respect, social prestige and this part of the cost is independent of how other’s act in the network. Suppose an individual is endowed with high level of self-respect, then she is less likely to default. On the other hand, social cost of default due to imitation effect will depend on action of others’ in the network. For example, if everyone in the network is defaulting on a specific credit, then it might be less costly for any individual to default in that network. Similarly, if others in the same network does not default, then social cost of default for any individual would be higher in that network. Therefore, while evaluating credit risk of an individual it will be prudent to also evaluate the behaviour of the community to which the individual belongs.
Thus, if the social cost of default is visible, then a lender would use it for credit risk evaluation as well as credit allocation. However, this cost is completely invisible, but sometimes borrower can signal it through their actions like lender selection. For example, when an individual plan to invest in a risky project, she will prefer to borrow from a lender who is relatively separated from her network (Bygrave & Hunt,2005). Similarly,Galland(2006) finds, borrowing from family and close relatives becomes last resort despite zero cost of borrowing.Gu´erin et al. (2012) finds, discomfort of Indians’ while borrowing from family members and close relatives, because they feel they may lose social insurance in case of default. In next section we provide some evidence from India on how individuals incorporate their social cost of default while borrowing by using the “National Sample Survey (NSS) 70th Round Households Indebtedness Survey” data (released in 2013 by Ministry of Statistics and Programme Implementation).
3
Evidence from India’s Household Indebtedness Survey
The “NSS 70th Round Households Indebtedness Survey data” consists of data from both rural and urban areas of India that covers both institutional and non-institutional lenders. Institutional lenders consist of banks, insurance companies, provident fund houses, financial institutions (including financial corporations and companies), SHG-bank linked banks and NBFCs, and other institutional agencies. On the other hand, non-institutional lenders consist of landlords, agricultural and professional money lenders, input suppliers, doctors, lawyers, other professionals, and relatives and friends. For our purpose, we have reported number of individuals out of 1000
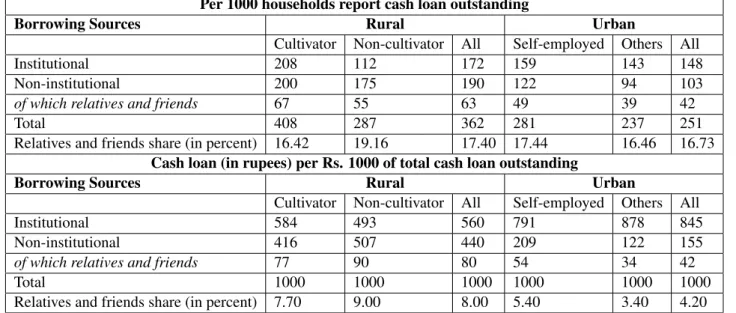
Table 1: Borrowing from Relatives and Friends - Profession Wise
Per 1000 households report cash loan outstanding
Borrowing Sources Rural Urban
Cultivator Non-cultivator All Self-employed Others All
Institutional 208 112 172 159 143 148
Non-institutional 200 175 190 122 94 103
of which relatives and friends 67 55 63 49 39 42
Total 408 287 362 281 237 251
Relatives and friends share (in percent) 16.42 19.16 17.40 17.44 16.46 16.73
Cash loan (in rupees) per Rs. 1000 of total cash loan outstanding
Borrowing Sources Rural Urban
Cultivator Non-cultivator All Self-employed Others All
Institutional 584 493 560 791 878 845
Non-institutional 416 507 440 209 122 155
of which relatives and friends 77 90 80 54 34 42
Total 1000 1000 1000 1000 1000 1000
Relatives and friends share (in percent) 7.70 9.00 8.00 5.40 3.40 4.20
Source: All-India Debt and Investment Surveys (AlDIS) of the National Sample Survey (NSS).
households (as reported in survey) who borrow from different sources. Our focus on how individuals do financial transactions with families and friends.
TheTable 1reports the data for our argument. It is observed that, in rural areas, on an average 362 (out of 1000) are indebted, and 17.4 percent of those depends on friends and relatives for their funding need. Similarly, in urban areas 251 (out of 1000) are indebted and 16.73 percent of them borrowed from relatives and friends. Cultivators rely less on friends and relatives than non-cultivators in rural areas. On the other hand, self-employed rely more on relatives and friends in comparison to others in urban areas. In terms of amount of borrowing 8 percentage point of the credit need is met from relative and friends in rural areas, and the same is 4.2 percentage point in case of urban areas. Non-cultivators borrow relatively higher amounts from relatives and friends in rural areas, while the same is true for self-employed in urban areas. One can argue that amount borrowed from relatives and friends depends upon the availability of funds with them. Therefore, the number of cases borrowing from relatives and friends will be a better indicator of financial dependency on relatives and friends than the amount of borrowing. At the same time, availability financial institutions will also affect the amount of borrowing from relative and friends, which explains the significant differences between urban and rural areas with respect to the amount of borrowing from relatives and friends.
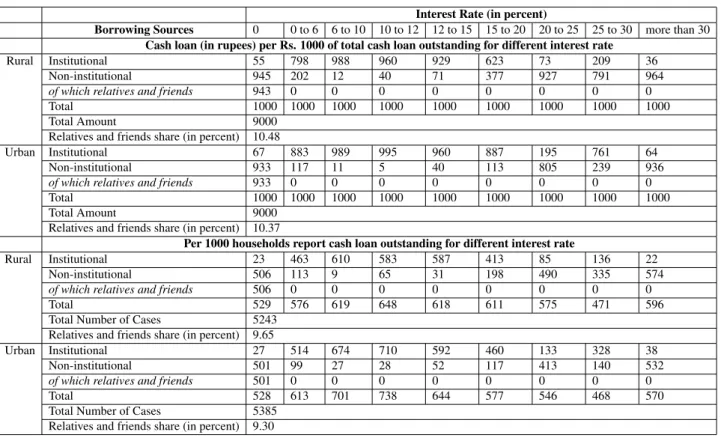
Dependency of cultivators and self-employed on relatives and friends for their credit needs is significantly low (Table 1). These livelihood activities are risky in nature, which is known to the individual borrower. Therefore, when an individual is knowingly borrowing for risky project, she would not like to spoil her reputation in the network because the social cost of default in the network is high. Hence, it can be argued that when an individual needs credit to invest in risky activities, it is prudent to look outside the network. This argument is even clearer when we look at the data (Table 2). The table represent the loan numbers as well as loan amount by ranges of interest rates1. We can see that borrowing from relatives and friends happen at zero cost. Despite the cost of borrowing being zero, only 10.48 (9.65 percentage point of number of loans) percentage point of loan amount is availed from relatives and friends in rural areas. The percentage points are similar for urban areas as well. This evidence supports the argument found in the literature, namely that, individuals keep family members, relatives, and close friends as lenders of last resort (Galland,2006;Gu´erin et al.,2012). We are attributing these Indian
1In each interest rate range, the distribution of loans are given out of Rs. 1000. For nine interest rate ranges, total amount of loan in all
Table 2: Borrowing from Relatives and Friends over Interest Rate Ranges Interest Rate (in percent)
Borrowing Sources 0 0 to 6 6 to 10 10 to 12 12 to 15 15 to 20 20 to 25 25 to 30 more than 30 Cash loan (in rupees) per Rs. 1000 of total cash loan outstanding for different interest rate
Rural Institutional 55 798 988 960 929 623 73 209 36
Non-institutional 945 202 12 40 71 377 927 791 964
of which relatives and friends 943 0 0 0 0 0 0 0 0
Total 1000 1000 1000 1000 1000 1000 1000 1000 1000
Total Amount 9000
Relatives and friends share (in percent) 10.48
Urban Institutional 67 883 989 995 960 887 195 761 64
Non-institutional 933 117 11 5 40 113 805 239 936
of which relatives and friends 933 0 0 0 0 0 0 0 0
Total 1000 1000 1000 1000 1000 1000 1000 1000 1000
Total Amount 9000
Relatives and friends share (in percent) 10.37
Per 1000 households report cash loan outstanding for different interest rate
Rural Institutional 23 463 610 583 587 413 85 136 22
Non-institutional 506 113 9 65 31 198 490 335 574
of which relatives and friends 506 0 0 0 0 0 0 0 0
Total 529 576 619 648 618 611 575 471 596
Total Number of Cases 5243 Relatives and friends share (in percent) 9.65
Urban Institutional 27 514 674 710 592 460 133 328 38
Non-institutional 501 99 27 28 52 117 413 140 532
of which relatives and friends 501 0 0 0 0 0 0 0 0
Total 528 613 701 738 644 577 546 468 570
Total Number of Cases 5385 Relatives and friends share (in percent) 9.30
Source: All-India Debt and Investment Surveys (AlDIS) of the National Sample Survey (NSS).
borrowers’ behaviour to existence of invisible collateral in the network in the form of social cost of default.
4
Role of Invisible Collateral – Benefits to the Lenders
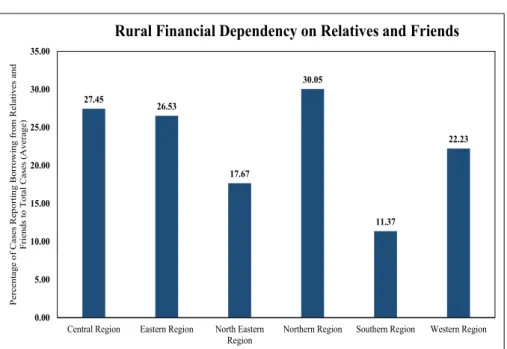
As discussed earlier, imitation effect has an impact on social cost of default. Higher the imitation effect for default, lesser the social cost of default, hence higher the credit risk. Therefore, if lenders can observe the prevalence of higher default rate for a group of borrowers, then an individual in that group is more likely to have less social cost of default and higher credit risk. Therefore, it is beneficial for the lenders to take this behavioural phenomenon into account while providing credit. In this way, this invisible collateral can be helpful for lenders. This kind of strategic credit allocation is visible in bank lending to self-help groups. To see these linkages, we divided the NSS data into six different regions (central, northern, north eastern, eastern, western, southern) as prescribed by “Status of Microfinance in India 2017-18, NABARD” report. The rationale behind this classification is to make it compatible with the non-performing assets (NPAs) of self-help groups for different regions as reported in the “Status of Microfinance in India 2017-18, NABARD”. If we assume that SHGs are like network of borrowers with in a cluster (regions), we can infer some linkages between social cost of default (existence of invisible collateral) and default rate. Our hypothesis is that we should see different level of dependency on relatives and friends on credit needs across these clusters (regions) and higher the dependency on relatives and friends, higher will be the default rate. The cluster (regions) wise data is reported inFigure 1. It can be observed that, individuals in southern region has the least dependence on relatives and friends for their credit need. At the same time, individuals in northern region has the highest dependence on relatives and friends for their credit need. According to literature and our arguments above, individuals in southern regions are expected to have higher social cost of default relative to other regions.
Figure 1: Borrowing from Relatives and Friends 27.45 26.53 17.67 30.05 11.37 22.23 0.00 5.00 10.00 15.00 20.00 25.00 30.00 35.00
Central Region Eastern Region North Eastern Region
Northern Region Southern Region Western Region
P e rc e nt a ge of C a se s R e por ti ng B or row ing fr om R e la ti v e s a nd F ri e nds t o T ot a l C a se s (A v e ra ge )
Rural Financial Dependency on Relatives and Friends
Note:Graph plots average number of cases that report the borrowing from relatives and friends to total number of cases of states in in each region.
Source:All-India Debt and Investment Surveys (AlDIS) of the National Sample Survey (NSS).
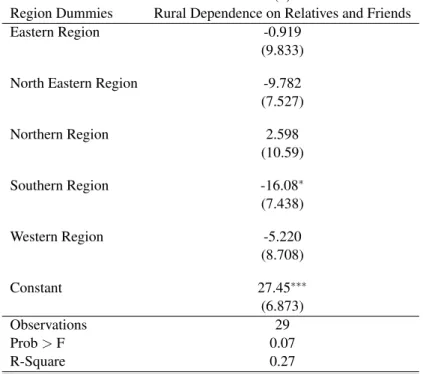
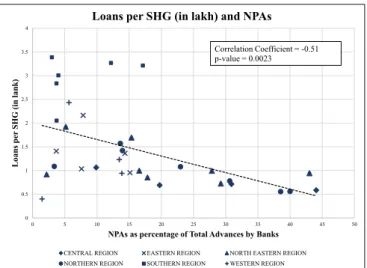
dummies to examine the statistical difference across regions in India.Table 3reports the results of this regression showing southern region has significantly lower dependency on relatives and friends compared to other regions. Also, the F-test of the overall regression is significant and confirms to regional variations of financial dependency on relatives and friends in India. Evidence of lower dependency on relatives and friends in the southern region may be due to higher penetration of self-help groups (SHGs) in the region. Therefore it might be difficult to separate out the impacts of social cost of default and SHGs penetrations. However, if social cost of default is higher in southern region, then expected credit default is relatively likely to be lower in southern regions. To see this, we present a scatter plot of percentage point of non-performing assets (NPAs) of self-help groups (SHGs) and loans per SHG (in lakhs) sourced from Status of Microfinance in India 2017 – 2018 (Published by National Bank for Agricultural and Rural Development (NABARD)) inFigure 2. It can be observed that there exists a clustering among different regions. For example, southern region shows low NPAs and high loans per SHG, while the inverse is true for central, northern, and north eastern regions. This clear negative linear association between these variables is suggestive of the credit allocation strategy by banks.
SHGs are mostly based in rural areas and are highly immobile, and the members with in a SHG possess high social connectivity with each other. Besides, majority of members interact on daily basis which leads to high degree of information spill over. Therefore, social cost of default (existence of invisible collateral) for individuals are expected to be high. Thus, our argument, higher social cost of default leading to both low dependence on close relatives and friends, as well as low credit risk is supported by this evidence presented above. Therefore, banks should consider evaluating the presence of invisible collateral to make better credit decision. However, gathering this soft information is costly, but it is useful in evaluating credit risk from the context of borrower’s community.
Table 3: Regression Results
(1)
Region Dummies Rural Dependence on Relatives and Friends Eastern Region -0.919
(9.833)
North Eastern Region -9.782 (7.527) Northern Region 2.598 (10.59) Southern Region -16.08∗ (7.438) Western Region -5.220 (8.708) Constant 27.45∗∗∗ (6.873) Observations 29 Prob>F 0.07 R-Square 0.27
Robust standard errors in parentheses ∗p<0.05,∗∗p<0.01,∗∗∗p<0.001
5
Conclusion
Fear of losing social trust incentivises borrowers to repay the credit irrespective of whether it is secured or unsecured. This invisible collateral for an individual can be used to reduce credit risk for the lender. Our analysis of existing Indian data shows some evidence of individuals signalling through not being dependent on individuals from their close network for funds despite the cost of borrowing being zero. The invisible collateral being a non-monetary cost derived from community can be helpful in designing policies like credit guarantee schemes. Moreover, imitation effect among individuals to default jointly affects this cost, leading to higher credit risk or NPAs. This information from the network should be considered while allocating credit. Therefore, borrower’s social status such as strong ties, interconnectedness, network she belongs to etc. are important dimensions that should be used while individuals are involved in informal credit contracts.
References
Arrow, K. J. (1974).The limits of organization. WW Norton & Company.
Bygrave, W. D., & Hunt, S. A. (2005). GEM 2004 Financing report. Babson College, MA, US, and London Business School, London, UK.
Coleman, J. S. (1988). Social capital in the creation of human capital. American Journal of Sociology,94, S95–S120. Galland, Z. (2006, April 20).Think Twice Before Borrowing from Family.Retrieved fromhttps://www.bloomberg.com/
news/articles/2006-04-19/think-twice-before-borrowing-from-familybusinessweek-business -news-stock-market-and-financial-advice
Granovetter, M. (1985). Economic action and social structure: The problem of embeddedness. American Journal of Sociology,91(3), 481–510.
Figure 2: NPAs and Loans 0 0.5 1 1.5 2 2.5 3 3.5 4 0 5 10 15 20 25 30 35 40 45 50 L o a ns pe r SH G (i n la nk )
NPAs as percentage of Total Advances by Banks
Loans per SHG (in lakh) and NPAs
CENTRAL REGION EASTERN REGION NORTH EASTERN REGION NORTHERN REGION SOUTHERN REGION WESTERN REGION
Correlation Coefficient = -0.51 p-value = 0.0023
Note:Graph plots the states based on NPAs during 2017-18 and loans per self help group. Each point refers to a state and the label represents the region in which it belongs to.
Source:Status of Microfinance in India 2017-18, NABARD.
Gu´erin, I., Roesch, M., Venkatasubramanian, G., & D’espallier, B. (2012). Credit from whom and for what? the diversity of borrowing sources and uses in rural southern india. Journal of International Development,24, S122–S137.
Guiso, L., Sapienza, P., & Zingales, L. (2004). The role of social capital in financial development. American economic review,94(3), 526–556.
Jackson, M. O., & Watts, A. (2002). The evolution of social and economic networks.Journal of Economic Theory,106(2), 265–295.
Karlan, D., Mobius, M., Rosenblat, T., & Szeidl, A. (2009). Trust and social collateral.The Quarterly Journal of Economics,
124(3), 1307–1361.