Working Paper/Document de travail
2009-12
Complex Ownership and Capital Structure
Bank of Canada Working Paper 2009-12
April 2009
Complex Ownership and Capital Structure
by
Teodora Paligorova and Zhaoxia Xu
Financial Markets Department Bank of Canada
Ottawa, Ontario, Canada K1A 0G9 [email protected]
Bank of Canada working papers are theoretical or empirical works-in-progress on subjects in economics and finance. The views expressed in this paper are those of the authors.
Acknowledgements
We would like to thank Greg Bauer, Jean-Sébastien Fontaine, Toni Gravelle, Scott Hendry, Jonathan Witmer, and seminar participants at the Bank of Canada for their helpful comments.
Abstract
This paper investigates the impact of pyramid ownership structure and multiple controlling shareholders on firm leverage. Pyramids, having at least one controlling shareholder and a subsidiary, rely significantly more on debt financing than non-pyramid firms. Moreover, higher leverage is observed in pyramids where the second controlling shareholders have more voting rights. We also find that the disparity between the voting rights of the first two controlling shareholders is negatively related to firm leverage. Interestingly, the influence of the second controlling shareholder is only present in non-family controlled pyramids. Overall, the results are consistent with the view that controlling shareholders in pyramids use debt to secure their private benefits.
JEL classification: G31, G32
Bank classification: Financial markets; International topics
Résumé
Les auteures étudient l’incidence de la structure de propriété pyramidale et de la présence de plusieurs actionnaires dominants sur le levier financier des sociétés. Les pyramides, qui comptent au moins un actionnaire dominant et une filiale, se financent beaucoup plus par emprunt que les autres types de société. Le recours au levier financier est encore plus marqué lorsque les deuxièmes actionnaires en importance ont davantage de droits de vote que les premiers. Les auteures constatent aussi que l’écart entre les droits de vote des deux principaux actionnaires est inversement lié au levier financier des sociétés. Fait intéressant, les deuxièmes actionnaires n’ont d’influence que dans les pyramides qui ne sont pas contrôlées par une famille. Dans l’ensemble, les résultats sont conformes au point de vue selon lequel les actionnaires dominants au sein des pyramides utilisent l’emprunt pour servir leurs intérêts privés.
Classification JEL : G31, G32
1
Introduction
There is a substantial literature examining the disciplinary role of debt in widely held firms (for example, Berger et al. (1997), Lang et al. (1991), Gul and Tsui (1998), Maloney et al. (1993)).1 However, there are a few studies on the role of debt in pyramid firms where ultimate owners (controlling shareholders) have direct or indirect ownership in a large number of companies (Manos et al. (2007) and Bianco and Nicodano (2006)).2 Debt may not be an effective disciplinary device in pyramid firms as it is in stand-alone firms due to the complexity of the ownership structure and the risk of expropriation of outsiders by controlling shareholders in pyramids. The wedge between control and cash flow rights of controlling shareholders in pyramid firms may create severe risk of expropriation (Bertrand and Mullainathan (2003)).3
This paper investigates how pyramid ownership structure and the presence of multi-ple controlling shareholders affect firms’ choices about capital structure. Pyramid firms are pervasive. In a sample of publicly listed companies in G7 countries, 35% of the firms are in pyramids controlled by ultimate owners with more than 20% voting rights.
Isolat-1High debt levels may be used to constrain managers from diverting free cash flow to pursue personal
goals at the expense of value maximization (Jensen (1986)).
2In this paper pyramid firm is defined as a firm having a controlling shareholder with direct or indirect
control over a chain of companies at the 20% level. We use ultimate owners, controlling shareholders, and large shareholders interchangeably.
3Pyramids differ from stand-alone firms in two important ways. First, unlike stand-alone firms with
dispersed ownership in which the main agency problem is between managers and shareholders, the main agency problem in pyramid firms is between controlling shareholders and non-controlling shareholders, and various stakeholders (La Porta et al. (1999), Faccio and Lang (2002), and Claessens et al. (2006)). Second, the unique and complex control chain of pyramid structure allows controlling shareholders to tunnel (expropriate) resources among affiliated firms to extract private benefits. Bertrand and Mullainathan (2003) describe several forms of tunneling. For example, it may occur through differential interest rates, non-efficient transfer pricing and/or leasing of assets. See Bertrand et al. (2002), Morck et al. (2005), Johnson et al. (2000), and Faccio et al. (2003) for details on this practice.
ing the effect of typical factors that explain cross-sectional variation in capital structures, pyramid firms have significantly higher leverage ratio than non-pyramid firms. Higher debt ratios in pyramid firms could be potentially consistent with several explanations. Our results suggest that debt is used by controlling shareholders to facilitate expropri-ation, rather than to enhance control, signal avoidance of empire building, or reduce taxes. Particularly, pyramid firms have lower leverage in countries with stronger pro-tection of creditor rights, where expropriation by using debt is expected to be more costly. In addition, pyramids with higher asymmetric information, where expropriation is harder to be discovered, use more debt. Moreover, pyramid firms have higher leverage than stand-alone firms when controlled by the same ultimate owners.
Controlling shareholders in pyramids may use debt to facilitate expropriation by forcing their subsidiaries to raise a large fraction of external debt, reshuffling it through intercompany transactions without being easily detected by outsiders and finally de-ploying the resources for their own preferred projects.4 Furthermore, the expected disci-plinary effect of bankruptcy threat associated with excess leverage is weakened because of controlling shareholders’ limited liability for insolvency of their subsidiaries in ad-verse contingencies and smaller reputation losses due to the difficulty to pin down the accountability in the complex opaque control web.
The presence of a second large shareholder might alleviate the power of the ultimate owner. The literature on multiple large shareholders suggests that they either form
4Atanasov et al. (2009) provide several cases of expropriation of subsidiaries by parent companies.
For example, Enron was indebted to its subsidiary Enron Pipeline for $7.25 million at zero interest rate in 1997, while Enron Pipeline had to pay interest rate between 9-12% on a loan to Enron.
a coalition or cross-monitor each other.5 Conditional on the view that higher debt is related to expropriation, the voting rights of the second largest shareholder will be positively associated with leverage if the two largest shareholders collude, while the relation will be negative if the second shareholder plays a monitoring role. Consistently with Laeven and Levine (2008), multiple large shareholders are prevalent in our sample: almost a half of the pyramids have second largest owner at the 10% ownership. We find a positive relation between the percentage of voting rights of the second largest shareholder and leverage of pyramid firms. When taking account of the voting rights of the largest shareholder, leverage is negatively associated with a measure of “equality” of the two largest shareholders. Small difference in ownership stakes of the first two largest shareholders is associated with higher leverage. Overall, the evidence indicates that the second largest shareholders with relatively larger voting power are more likely to collude with the first controlling shareholders on capital structure decisions.
To test whether controlling shareholders prefer debt over equity in order to avoid control dilution (Stulz (1988), Harris and Raviv (1988)), we examine family-controlled pyramids where control is supposed to be valued most (Ellul (2008)). We find that leverage ratios are lower in non-controlled pyramids compared to those of family-controlled pyramids, which contradicts the control-enhancing mechanism story.6 Next, higher debt might be a signal for avoidance of empire building by controlling shareholders
5Bennedsen and Wolfenzon (2000) suggest that large shareholders compete to form controlling
coali-tion which will secure their private benefits of control. Pagano and Roell (1998) focus on the possibility that large shareholders cross-monitor each other, and Bloch and Hege (2001) argue that when ownership is unevenly distributed monitoring is less likely.
6Ellul (2008) argue that family-controlled pyramids use less debt because pyramid structure and
debt are substitutable control enhancing mechanisms. The fact that in our sample pyramid firms have higher debt is inconsistent with the above argument.
as suggested by Zwiebel (1996). The signalling hypothesis suggests that higher leverage in pyramid firms, compared to non-pyramid, can be attributed to their efforts to reduce free cash flow problem using debt. Our results, however, show that pyramid firms with high free cash flow do not use more debt than non-pyramid counterparts. Finally, pyramids might maintain higher debt ratios for the purpose of tax reduction. Using non-debt tax shield as a proxy for non-debt tax benefits, we find that higher leverage ratios in pyramids cannot be explained by tax considerations.7
Our study makes several contributions to the literature. First, our study contributes to the capital structure literature by showing that higher levels of debt in pyramid firms do not play a disciplinary role as they do in stand-alone firms with dispersed ownership structure (Berger et al. (1997)). The main reason is that pyramids, through their complex control web, facilitate the transfer of resources among affiliated firms. The only related study is Faccio et al. (2003) who examine 14 European and East Asian companies and suggest that controlling shareholders of group-affiliated firms may use debt to expropriate subsidiary shareholders by imposing higher leverage in firms where their cash flow rights are low. Distinct from their work, our paper examines pyramid firms in G7 economies considered to have equally developed market institutions. These firms presumably do not highly rely on internal capital markets for financing as opposed to firms in underdeveloped economies, where external capital markets are incomplete and suffer from informational problems and thus makes the use of internal capital markets relatively more efficient (Khanna and Yafeh (2007)). We also investigate alternative
7Following the literature, we assume that firms treat interest expenses of debt that are tax deductable
explanations of higher debt in pyramids, other than the expropriation hypothesis. In particular, we offer a richer set of tests of the signalling, the control enhancing, and the tax reduction hypotheses.
Second, our work contributes to the empirical literature on multiple large sharehold-ers. Only a handful of theoretical models study multiple large owners and corporate valuations (Zwiebel (1995), Burkart et al. (1997), Gomes and Novaes (2005), Pagano and Roell (1998)). Examining empirically the role of multiple large shareholders on corporate valuation, Laeven and Levine (2008) find that there is a negative relationship between the dispersion of cash-flow rights across large owners and corporate valuations. Similarly, Maury and Pajuste (2005) show that corporate valuation depends on the rel-ative size of the large shareholders using a sample of Finnish firms. We instead examine the relationship between leverage and ownership structure in publicly traded firms across G7. To our knowledge, this is the first empirical study on the impact of multiple large owners on capital structure decisions in pyramid firms. Consistently with a theoretical argument proposed by Zwiebel (1995), we find that the relationship between capital structure and multiple large owners depends on the relative size of the voting rights of the largest shareholders.
The rest of paper is organized as follows. Section 2 describes the data and document the ownership patterns and firm characteristics in the sample. Section 3 tests the rela-tionship between complex ownership structure and capital structure. Section 4 presents results of test of the expropriation hypothesis and Section 5 discusses the role of the second largest owner. The alternative hypotheses can be found in Section. 6Section 7
addresses endogeneity issues. Section 8 concludes.
2
Data and Sample
To examine the relationship between ownership structure and leverage, we use firm-level ownership data from the OSIRIS database provided by Bureau Van Dijk. The initial sources of information are from World’Vest Base, Fitch, Thomson Financial, Reuters, and Moody’s. We retrieve the name of shareholders, their type and the percentage of shareholdings reported once during the period 2003 to 2006 for listed firms in G7 countries (Canada, Germany, France, United Kingdom, Italy, Japan, and USA).8
In the analysis we consider only firms with consolidated balance sheets to ensure consistency in the reporting of debt across countries (Faccio et al. (2003)).9 The US firms comprise 43% of the whole sample, followed by the Japanese (20%) and the British firms (16%). We exclude 1,737 firms in the financial sector (SIC 6000-6999) and 277 firms in the utility sector (SIC 4900-4999). Firms with total assets less than US$ 10 million are omitted. As a result of this screening, our final sample consists of 20,072 firm-years and 12,167 firms.
8We focus on G7 countries because these countries share similar level of development of capital
markets. In emerging markets, groups are found to play an important role in firm financing by providing funds to financially constrained and distressed firms with high growth opportunities (Claessens et al. (2006)). To isolate the effect of internal markets on debt financing, we study only a sample of countries where groups are less likely to play the role of an internal market.
9Consolidated balance sheets exclude inter-group loans. The debt ratio represents the external debt
2.1
Ownership Patterns
The OSIRIS data reports the percentage of ownership for each shareholder only once for the period 2003-2006. Based on shareholders’ voting rights, we distinguish among several ownership structures presented in Table 1. An ultimate owner is defined as a shareholder owning more than 20% direct or indirect voting rights (La Porta et al. (1999); Faccio and Lang (2002)).10 If a firm has such an ultimate owner, we classify it as ultimately owned firm. In our sample, 42.94% of the firms are classified as ultimately owned. France and Germany are the countries with the highest percentage of ultimately owned firms, 93.72% and 92.71% respectively. Faccio and Lang (2002) also document that the highest incidence of controlled ownership in their European sample is in Germany and France. The lowest percentage of ultimately owned firms is in Japan (16.20%). Examining a sample of East Asian countries, Claessens et al. (2006) find that the average ownership in Japan is 5.13% and the control share is 10.05% over the period 1994-1996.
Widely held firms are classified as firms with no shareholders holding more than 20% equity ownership. These firms comprise 57.06% of our sample. The lowest percentages of widely held firms are in France (6.28%), Germany (7.29%), and Italy (15.46%). For a sample of Western European corporations, Faccio and Lang (2002) also document that the lowest percentages of widely held firms are in Germany and Italy.
We define a pyramid firm as an ultimately owned firm at the 20% (or 10%) threshold that also directly or indirect own one or more subsidiary companies. At the 20% thresh-old, 35.01% of all firms are in a pyramid structure. Pyramid distribution varies across
10The cutoff point of 10% and 20% are conventionally used in the literature because, they provide a
countries. In Canada, for example, pyramids comprise 31.27% of the listed companies, which is comparable to the percentage of pyramids reported by Gadhoum (2006). The highest percentage of pyramids is in Italy (81.16%) and the lowest percentage is in Japan (6.56%).
Lowering the cutoff level of control from 20% to 10% increases the fraction of pyra-mids to 47.57%. The most dramatic increase in the fraction of pyrapyra-mids is in UK where 43.67% of all firms are associated with pyramid structure at the 20% threshold and the fraction goes up to 65.35% at the 10% threshold. The patterns of various ownership structures across countries in our data are generally consistent with previous studies. Enriques and Volpin (2007), analyzing concentrated ownership in Europe, conclude that pyramids are typical mechanisms of control in France, Germany and Italy. Overall, the controlled ownership via pyramid in our sample is concentrated in European companies and to a smaller extent it is observed in Canada and the US.
Depending on the type of the ultimate owner at the 20% threshold, we identify five types of pyramids. We rely on the OSIRIS definitions of shareholder type, according to which there are family (including individuals), industrial company, financial company (including banks and insurance companies), mutual fund (including pension funds, trust and private equity), and miscellaneous (state-owned, undisclosed) types of controlling owners.11 The most prevalent types of ultimate owners in pyramids are an “industrial company” (37.66%), “family” (36.05%) and “financial firm” (6.53%). The highest per-centage of family control is concentrated in Italy (44.05%), while family pyramids are
the least prevalent in Japan (5.70%).12
Similar to Laeven and Levine (2008), we identify pyramids with second largest owner at 10% and 20% level of control. Table 1 indicates that 48.92% of all pyramids have a second largest owner at the 10% level. Increasing the cutoff point for the second largest owner to 20% decreases the share of pyramids with such type of shareholders to 25.8%. Germany, Italy and France have the highest fraction of pyramids with second largest shareholders.
2.2
Firm Characteristics
Leverage is affected by profitability, asset tangibility, market-to-book ratio, and firm size (Rajan and Zingales (1995); Booth et al. (2001)). Table 2 summarizes descriptive statistics of these financial characteristics across countries over the period 2003-2006. Book leverage ratio is defined as the ratio of long-term and short term debt to the book value of equity and debt, and market leverage use market equity instead of book equity. On average book leverage is 33.64% and market leverage is 24.06% over the period 2003-2006. In our sample, Italian firms are the most levered (42.53%) and the US firms have the lowest level of leverage (31.74%). Rajan and Zingales (1995) conduct a study on leverage across G7 countries in which the level of leverage in the US in 1991 is similar to the level reported in our sample over the period 2003-2006. The Canadian firms have decreased slightly their book leverage levels from 36% in 1991 (Rajan and Zingales
12Faccio and Lang (2002) define a family controlled firm to be “a family or a firm that is unlisted on
any stock exchange.” Unlike them, we consider only families that hold shares in listed companies, which potentially explains the lower percentage of family-controlled firms in our sample. Faccio and Lang (2002) document that 64.82% of their ultimately owned firms are family owned at the 20% threshold, while 32.36% of all firms in our sample are ultimately owned by a family at this threshold.
(1995)) to almost 33% for the 2003-2006 period.
Market-to-book ratio is the market value of equity divided by the book value of equity. The average value of market-to-book ratios hides a significant variation across countries. Japanese firms have the lowest market-to-book ratio (1.79) and the US firms have the highest one (3.04). Operating profitability is defined as the ratio of earnings before interest, taxes, depreciation, and amortization to total assets. The average French firm is the most profitable (9.81%) and the US one is the least profitable (4.19%). Tangibility is the ratio of fixed assets to total assets. On average the level of tangibility is 26.41%, with Canadian firms exhibiting the highest level of “tangibility” (40.87%) and French firms exhibiting the lowest level (18.30%).
Table 3 provides firm level mean statistics for pyramid and non-pyramid firm. On average pyramids have 7.65% more leverage than pyramids. Compared to non-pyramid firms, non-pyramids have significantly lower market-to-book ratio, more operating profitability, less tangible assets. In terms of debt and equity issuance, pyramids firms issue relatively more debt and less equity than non-pyramids.
3
Regression Results
3.1
Baseline Regression
We first test the impact of firm characteristics on capital structure across the G7 coun-tries. Following Rajan and Zingales (1995), we estimate the following regression model:
Leverageit = α+β1P rof itabilityit−1+β2T angibilityt−1 (1) +β3M/Bit−1+β4log(Sales)it−1+²it.
where leverage is book (market) leverage and profitability, tangibility,M/B, log(Sales)
are firm characteristic variables defined in the previous section.
The model controls for industry, year and country fixed effect to capture heterogene-ity across industry, year and country. Table 4 reports the OLS estimates with standard errors adjusted for possible dependence at the firm level and heteroskedasticity. These estimations allow for the correlation within firms, but require independence across firms. Petersen (2008) shows that the standard errors clustered at the firm level are unbiased in presence of correlation within firms.
Overall, the estimates of firm characteristics are consistent with previous research such as Rajan and Zingales (1995), and Booth et al. (2001). The negative coefficient on profitability is consistent with the hypothesis that more profitable firms have larger amount of internal funds and thus demand less debt. The tangibility of assets has a positive coefficient, which is consistent with the view that firms with more tangible assets have more debt because tangible assets can serve as collateral. Market-to-book has a negative effect on capital structure. The negative coefficient on the market-to-book ratio is consistent with Myers (1977) that firms with high future growth opportunities use less debt. Logarithm of net sales, a proxy for size, is positively related to leverage because larger firms are less likely to go bankrupt and have more debt capacity.
The pooled regression assumes common coefficients across all countries. Although G7 countries have developed markets, they also experience large institutional differences which might be responsible for differences in capital structure and its determinants. Another reason for accounting for cross-country variation is that the U.S. firms comprise
43% of our sample, which might dominate the results in the pooled specification. Table 4 shows the results from the estimation of the leverage regression for each country. The effects of firm characteristics on leverage are similar across the seven countries. More profitable firms have lower leverage. Firms with more tangible assets borrow more. High growth firms use less debt than low growth firms, and large firms use more debt than small firms.
3.2
The Impact of Pyramid Structure on Leverage
To examine capital structures of pyramid and non-pyramid firms, we estimate the fol-lowing model:
Leverageit = α+P yramidi+Controlsit−1+²it. (2)
whereP yramidis a dummy which equals to one if a firm is affiliated to a pyramidal group
and zero otherwise; Controls include P rof itability, T angibility, M/B, Log(Sales),
country, industry, and time dummies. The tests are based on the assumption that pyra-mid affiliation is exogeneous in the relatively short period. This assumption is reasonable given that the literature agrees that ownership formation is historically determined to a large extent (La Porta et al. (1999)). To address a potential critique that capital structure choice by pyramids may be endogenous, as a robustness check we employ a nonparametric matching approach which compares leverage ratios of pyramid and non-pyramid firms without imposing a linear functional form of the conditional leverage expectations.13
4
Expropriation Hypothesis
Controlling shareholders in a pyramidal group have high voting power but low cash flow rights in affiliates located at the bottom of the pyramid structure. This wedge creates incentives to shift resources from the bottom to the top where controlling shareholders have more cash flow rights. This resource shifting activity, called tunneling (Johnson et al. (2000)), includes a wealth transfer among affiliated firms via transfer pricing, usage of assets of one group member as collateral for another, inflated payments for intangibles such as patents, brand names and insurance. Bertrand et al. (2002), Bae et al. (2002), Joh (2003), and Baek et al. (2006) provide evidence of expropriation of minority shareholders by ultimate owners within groups.
Controlling shareholders, who do not bear the full cost of financial distress of their affiliates because of the low cash flow rights and the limited liabilities, have incentives to exercise discretion over substantial pool of resources. They may expropriate by imposing higher debt levels in firms where their cash flow rights are low and roll it over to affiliates where they can have the resources on their disposal (Faccio et al. (2003)). They may deploy the borrowed funds to their own preferred projects without being detected by outsiders due to the complex control web in pyramids. We hypothesize that pyramid firms use debt to secure private benefits (expropriation hypothesis). In particular, under this hypothesis we expect pyramids to have higher leverage compared to non-pyramids. Table 5 reports results of book and market leverage regressions for firms affiliated to a pyramidal group at the 20% level of control. Column (1) shows that the pyramid dummy has a significant positive coefficient of 5.64 percentage points. Pyramid firms
use more debt than non-pyramids. The regression using market leverage ratio yields a similar result (column 4). We conduct a number of tests to examine whether higher debt levels in pyramids are explained by the expropriation hypothesis. In particular, we investigate whether pyramid firms have lower leverage in countries; where it is harder to expropriate and whether pyramid firms with higher level of asymmetric information use more debt; and whether ultimate owners impose more debt on pyramid firms than stand-aline firms under their control.
4.1
Creditor Rights Protection
La Porta et al. (2000) argue that it is harder for controlling shareholders to expropriate outside creditors in countries with stronger creditor rights protection. If debt facilitates expropriation in pyramid firms, lower leverage is expected for pyramids in countries with better protection of creditor rights. We classify the countries into stronger and weaker creditor rights countries based on the creditor rights index developed by La Porta et al. (1998). Stronger creditor protection countries include UK, Germany, Italy, and Japan, while the weaker creditor protection countries are Canada, U.S., and France.14 A creditor rights dummy, that is one for stronger protection countries and zero for weaker protection countries, an interactive term between the creditor rights dummy, and the pyramid dummy are added to the baseline regression.
Table 5 columns (2) and (5) show a positive coefficient on the pyramid dummy,
14The reorganization and liquidation rules in Canada, USA, and France offer more protection to
management against secured creditors. For example, the automatic stay on the assets of the firm in the reorganization procedure prevent secured creditors from possessing loan collateral. Canada, USA, and France have weaker protection of creditor rights.
indicating that pyramid firms generally use more debt than non-pyramid firms after controlling for differences in legal environments. The positive coefficient on creditor rights dummy suggests a higher debt ratio in countries with better creditor rights pro-tections. The negative coefficient on the interactive term of creditor protection and the pyramid dummy suggests that pyramid firms in better creditor rights protection coun-tries use less debt. This result is consistent with the expropriation hypothesis because it is harder for controlling shareholders to extract private benefits using debt in countries with better protections to creditor rights.
4.2
Asymmetric Information
The risk of expropriation may be more pronounced when the asymmetric information between corporate insiders and outsiders is severe. It is more likely for controlling shareholders in opaque firms to extract private benefits without being easily detected by outsiders. Small firms generally face higher degree of information asymmetry than large firms because of less available public information. Small pyramid firms, therefore, are expected to have higher leverage if debt is used by controlling shareholders to facilitate expropriation.
We add firm size as a proxy for asymmetric information and include a pyramid dummy, a size dummy and also the interaction term of the two dummies to the speci-fication. Large F irms takes the value of one if a firm’s size is higher than the sample
median and zero otherwise. Table 5 columns (3) and (6) show that the coefficient on size dummy is 1.507 and the coefficient on the interaction term,Large F irms×P yramid, is
leverage relative to large pyramids as predicted by the expropriation hypothesis. Higher level of asymmetric information allows controlling shareholders of small pyramid firms to make decisions for their own benefits and increases the risk of expropriation.
4.3
Pyramid and Controlled Stand-Alone Firms
Our analysis so far does not take into consideration that ultimate owner may directly control more than one firm. For example, an ultimate owner may control more than one pyramid as shown in Figure 1 or an ultimate owner may directly control only stand-alone firms, i.e., firms that do not have subsidiaries (Figure 2). Equally plausible, an ultimate owner may control both stand alone and group-affiliated firms as depicted in Figure 3.
Comparing capital structures of stand-alone and pyramid firms controlled by the same ultimate owners provides an additional test of the expropriation hypothesis. Ulti-mate owners capture all benefits and bear full costs of the controlled stand-alone firms based on their ownership stakes, and therefore have relatively lower incentives and abil-ity to use debt to secure their private benefits in these firms. However, expropriation by using higher debt is more obtainable in firms having subsidiaries because of the ability of ultimate owners to tunnel resources along the control chains. Hence, if debt facilitates extraction of private benefits, pyramid firms are expected to have higher leverage ratios than stand-alone firms controlled by the same ultimate owner.15 To test this conjecture, we focus only on the subset of firms exhibiting ownership structure as shown in Figure 3.
15Note that the fully consolidated financial statement includes the external debt borrowed by
In the G7 sample, 211 of the ultimate owners exhibit control simultaneously over 1860 pyramid and stand-alone firms. We estimate regressions similar to those presented in Table 5. The main focus from this exercise is on the estimate on the dummy variable
Conduit, that is one for pyramid firms and zero for stand-alone firms both controlled by
the same ultimate owner. The results in Table 6 show a positive and significant coefficient on theConduitdummy. Pyramid firms have higher leverage ratio than stand-alone firms
controlled by the same ultimate owners, which supports the expropriation hypothesis, i.e., controlling shareholders appear to impose more debt on pyramid firms rather than on stand-alone firms.
5
The Role of the Second Largest Shareholder
Our results suggest that higher debt ratios in pyramid firms is consistent with the expropriation motive explanation. A significant fraction of firms in the sample have a second large shareholder owning more than 10% voting rights. Previous research suggests that the presence of a second large shareholder could affect the firm’s investment and valuation. In this section, we examine whether the second largest shareholder affects a firm’s debt policy.
Theory offers at least two views on the role of second largest shareholders. On the one hand, Winton (1993) and Bolton and Thaden (1998) posit that shareholders with significant stakes have incentives to monitor controlling shareholders to avoid profit di-version. Burkart et al. (1997) argue that a reduction in the ownership stake of controlling shareholders weakens their incentives to monitor. Gomes and Novaes (2005) also show
that bargaining problems among multiple controlling shareholders prevent decisions that may harm small shareholders.
On the other hand, the second largest owner may have incentives to collude with the largest shareholder to share private benefits. Zwiebel (1995) assumes that the control benefits will be divided among different controlling shareholders depending on the rela-tive size of their respecrela-tive blocks. Therefore, if one block is much smaller than the rest, then the probability that the small blockholders can share private benefits is reduced.
Maury and Pajuste (2005) develop a theoretical model which considers not only the presence of multiple blockholders but also their relative size and identity. The model predicts that high voting power increases private benefit extraction, while low cash flow ownership reduces the incentive effect. Hence, whether the second controlling shareholders will monitor or collude with the largest shareholders on debt financing is an empirical question.
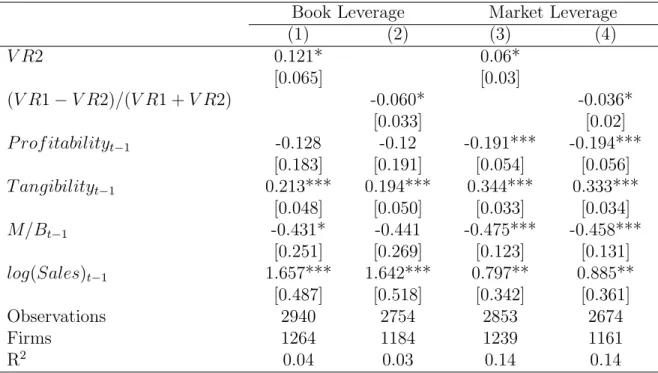
In Table 7, we analyze the role of the second largest owner in a pyramid. Column (1) shows that voting rights of the second largest owner are positively related to the leverage of pyramid firms.16 Increasing the second largest shareholder’s voting rights by one standard deviation increases the leverage ratios by 1.88 percent of its mean. This finding suggests that second largest owner with more voting rights is less likely to monitor the ultimate owner in their debt financing choices. One potential explanation is that these second largest owners can share relatively larger portion of the private benefits from exercising control over debt resources.
16In all specifications in Table 7 we focus on firms having second largest shareholders with voting
To further test the role of the voting rights of shareholders, we use the ratio of the difference in voting rights of the first and the second largest shareholders to the sum of the voting rights of the first two shareholders ((V R1−V R2)/(V R1 +V R2)) to
measure the distribution of power. A small value of (V R1−V R2)/(V R1+V R2) signifies
more equal distribution of the voting power between the two largest shareholders. The negative sign on the coefficient of this variable suggests that greater equality in terms of voting rights is associated with higher leverage (column (2)). As robustness checks, we estimate all specifications using market leverage as a dependent variable (columns (3)-(4)) and the results are similar to those using book leverage. The second largest shareholder with relatively more voting rights is more likely to form a coalition with the first owner because having high voting rights ensures a large share of private benefits.
In addition, we examine the effect of the second largest shareholders in family and non-family pyramid firms. Table 8, columns (1) and (3) show that the second largest shareholder does not have a significant impact on the capital structure decisions when the largest owner is a family. The coefficients on the voting rights of the second owner and on the measure of similarity between voting rights of the first two shareholders are insignificant in the regressions for family-controlled pyramids. The influence of the second largest shareholder in capital structure decisions is only observed in non-family firms (columns (2) and (4)).
To sum up, we find that the role of the second largest owner in capital structure decisions depends not only on their voting rights, but on the voting rights and the type of the largest owner as well. Large voting rights of the second largest owner do not
necessarily guarantee that they will play an active role in financial policy. Interestingly, we find that when the ultimate owner is a family, the second largest shareholder does not affect debt financing decisions.
6
Alternative Explanations
There may be other possible explanations for higher leverage in pyramid. In this section, we examine whether our results can be explained by the control-enhancing hypothesis, the signalling hypothesis, or the tax-deducting hypothesis.
6.1
Control-Enhancing
Previous theoretical literature indicates that managers may choose such capital structure that enhances their control (Harris and Raviv (1988), Stulz (1988), and Israel (1991)). Using debt rather than equity allows controlling shareholders to keep their control ben-efits without share dilution. Ellul (2008) suggests that family controlling shareholders value control most and use leverage strategically to enhance their voting power.
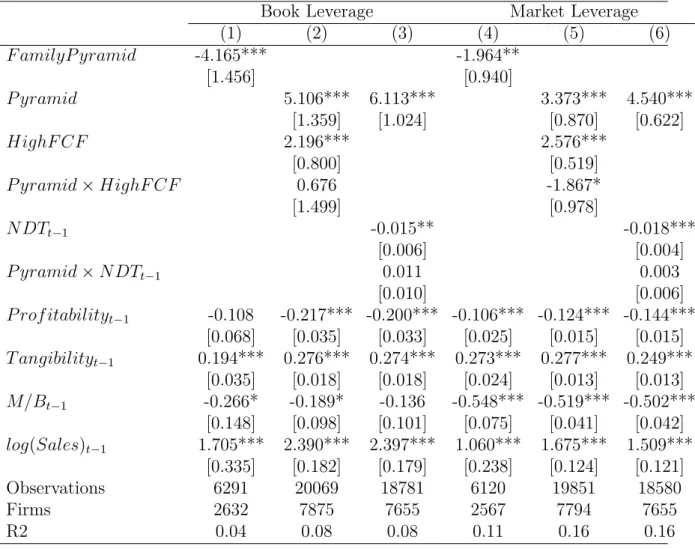
To test the control-enhancing hypothesis in our context, we examine capital structure decisions of pyramid firms controlled by families and non-families. We add to our baseline regression a dummy variable that is one if a pyramid firm is controlled by a family and zero otherwise. Column (1) in Table 9 shows that the family pyramid dummy has a negative coefficient, indicating less debt is used in pyramid firms controlled by families. Ellul (2008) also finds that family controlled pyramid firms use less leverage under pyramid structure. His interpretation, however, is that the pyramid structure is a substitute for leverage as a control-enhancing mechanism. On the contrary, our
finding that pyramid firms use more debt than non-pyramid firms does not support the hypothesis that pyramid and leverage are substitutes (Table 5, column (1)).
As a further investigation, we find that family controlling shareholders in our sample have lower voting rights than non-family owners. If debt is used for the purpose of secur-ing control, pyramid firms controlled by families with smaller stakes should have higher leverage. In addition, the result that families, as the largest shareholders, do not use significantly more debt in the presence of a second large shareholder (Table 8) is also inconsistent with the control-enhancing hypothesis, because family controlling share-holders are expected to use more debt to enhance control when there is a competition for voting rights from second large shareholders.
Overall, the evidence of family-controlled pyramids using less debt is consistent with the expropriation hypothesis. Family owners have weaker incentive to expropriate other shareholders because they have a long-term commitment to the firm and often want to pass the firm to next generations (Anderson et al. (2003)). The lower risk of ex-propriation in family pyramid firms explains their lower leverage ratios. Hence, the expropriation hypothesis rather than the control-enhancing hypothesis better explains the debt usage in pyramids.
6.2
Signaling
Zwiebel (1996) posits that managers of firms with high free cash flow can use debt as a signal for their avoidance of empire building. If higher leverage in pyramid firms can be explained by the signalling hypothesis, we would expect more debt in pyramid firms with high free cash flow than non-pyramids. A dummy variable,High F CF, that is one
for a value higher than the sample median of free cash flow and zero otherwise, and its interaction with pyramid dummy are included in the regression.
The positive coefficients on the High F CF dummy in Table 9 column (2) and (5)
suggest that on average firms use more debt when facing more severe free cash flow problem. However, the coefficient on the interactive term between the pyramid dummy and the high free cash flow dummy is insignificant using book leverage ratio and is negative at the 10% level of significance when using market leverage. These results indicate that free cash flow does not explain higher leverage in pyramid than non-pyramid firms. There is no evidence that pyramids use more debt to signal reducing the risk of free cash flow.
6.3
Tax Reduction
The trade-off theory of capital structure suggests that debt has tax benefits because of tax deductability of interest expenses. More profitable firms may use more debt to reduce their tax burden. To examine whether tax-deduction motive can explain the higher leverage in pyramid firms, we include non-debt tax shields and its interaction with the pyramid dummy. DeAngelo and Masulis (1980) argue that the value of this tax shield depends on corporate tax, the level of taxable profits, and on non-debt tax shields such as capital allowances, tax credits and tax losses carried forward. Non-debt tax shield is a proxy for corporate tax benefit if we assume that depreciation is a substitute for interest payment. If incentives to reduce taxes drives capital structure decisions of pyramid firms, pyramids with higher non-debt tax shield are expected to use more debt than non-pyramid counterparts.
The negative coefficients on the non-debt tax shields (Table 9 column (3) and (6)) suggest that on average firms have lower leverage when they have other ways to reduce taxes. However, the coefficients on the interaction term of the non-debt tax shields and the pyramid dummy are insignificantly positive, indicating that pyramid firms’ debt financing policies are not mainly driven by tax consideration.
7
Endogeneity
One issue that arises from using simple OLS estimation of the leverage regression in Table 5 is potential endogeneity of the pyramid indicator variable. Our results might be driven by non-random sorting of pyramids across industries and/or countries. As shown by the results in Table 3, pyramids differ significantly from non-pyramids in terms of their firm characteristics, which confirms their non-random distribution in the sample. In this section we perform non-parametric matching which accounts for endogeneity.
Non-parametric matching compares only pyramid and non-pyramid firms with sim-ilar observable characteristics.17 The advantage of non-parametric matching is that it relaxes the assumption about the functional form of the leverage distribution.
We use propensity score matching models to estimate “the average treatment on the treated” (ATT). The last is defined as the difference between leverage ratios of firms that have “chosen” to be pyramids to leverage ratios of the same firms if they would not have chosen this “treatment.” As the counterfactual mean leverage ratio for those being treated is not observed, one has to choose a proper substitute for it in order to estimate
17For an application of matching technique in corporate finance, see Li and Zhao (2006) who examine
the ATT. The matching approach aims at estimating the missing counterfactual of what a pyramid’s leverage would be if it were not pyramid. The answer is given by the leverage of non-pyramid firms with the same set of firm characteristics.
There are several frequently used algorithms for matching “comparable” firms.18 Traditional methods find matching firms by each individual characteristic. To overcome the curse of dimensionality that arises if the match has to consider a great number of characteristics, we base our results on propensity score matching. It is the conditional probability of being a pyramid that is estimated from a probability model (Rosenbaum and Rubin (1983), Rosenbaum and Rubin (1985)).
To estimate the ATT, we apply the most popular propensity score matching pro-cedures, kernel, nearest neighborhood, and Mahalanobis-metric matching with replace-ment.19 Kernel matching is based on the estimated propensity scores and takes local averages of the untreated observations near each treated observation. Nearest borhood compares leverage of firms with close propensity scores as defined by a neigh-borhood metric. Mahalanobis matching consists of matching on specific variables in addition to the propensity score; it may decrease selection bias and may also serve as an additional protection against any impact due to inconsistent estimation of the propensity score.
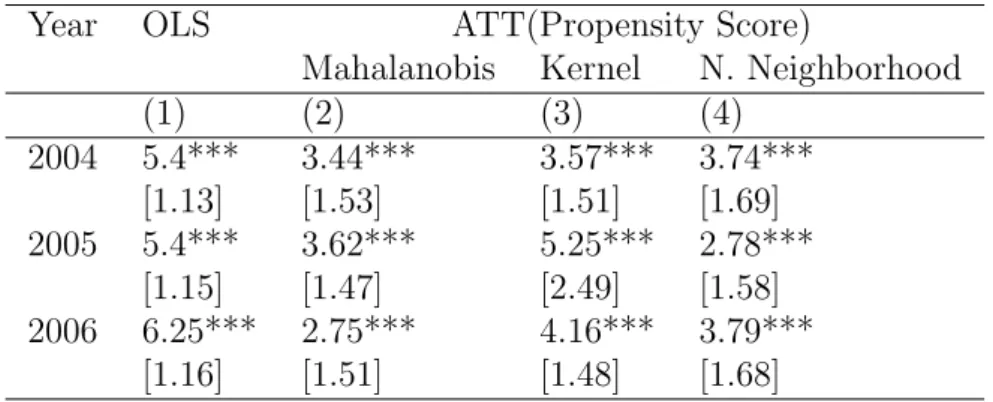
Table 10 presents OLS estimates of a pyramid dummy in column (1) together with estimated ATT from three types of matching. Bootstrapped standard errors are reported
18See Caliendo and Kopeinig (2008) for detailed practical guidance on propensity score matching. 19To overcome the potential lack of overlap of propensity score between the pyramids and
non-pyramids (common support problem), we apply trimming constraint (5% trimming rule) as suggested by Smith and Todd (2005).
below the average treatment effects. The ATT estimates for each year are smaller than the OLS-based pyramid estimates but remain large and are above zero with high levels of statistical significance. These results confirm that even after comparing pyramids to non-pyramids with similar characteristics the leverage differences still remain.20
8
Conclusions
This paper studies the influence of pyramid structure and multiple controlling share-holders on corporate capital structure decisions. We document that over one-third of the listed firms in G7 countries are in pyramid ownership structures. Half of the pyra-mid firms have more than one large controlling shareholders. Pyrapyra-mid firms use more debt than non-pyramid firms. Our main explanation is that controlling shareholders in pyramids use debt as a facilitating device to expropriate outsiders.
The finding of higher leverage ratios in pyramid firms is consistent with the expro-priation hypothesis because: (i) pyramid firms use less debt in countries with strong protection of creditor rights compared to pyramids in countries with weak protection of creditor rights, (ii) pyramids that are subject to more severe asymmetric information problems have higher debt, (iii) pyramid firms have more debt than stand-alone firms controlled by the same ultimate owners. The results from tests on other competing
ex-20We conduct diagnostic tests to assess the quality of the matching procedure. It has to be checked
whether the matching procedure is able to balance the distribution of the relevant variables in both the control and the treatment group. As suggested by Rosenbaum and Rubin (1985), we rely on t-tests to compare differences in means for both treatment and control groups. It is expected that after matching there will be no significant differences. In all cases the results confirm that there are no statistical differences after the matching is applied. An alternative way to assess the matching quality is to evaluate pseudo-R2statistics before and after matching. In all cases there are no systematic differences
in the distribution of covariates after matching and the pseudo-R2 is close to zero (0.02, down from 0.2
before matching). Similar conclusions come from F-tests on the joint significance of all regressors. The results are available upon request from the authors.
planations indicate that debt is not used by pyramid firms for the purposes of enhancing control, signalling of restricting empire building or reducing taxes.
Voting rights of the second shareholders are positively related to debt ratios. The more equally distributed the voting rights between the two largest shareholders, the higher are the leverage ratios. This evidence suggests that second largest owners who can obtain a greater portion of the private benefits increase the usage of debt, which is in favor of the expropriation story.
References
Anderson, R. C., Mansi, S. A., and Reeb, D. (2003). Founding family ownership and the agency cost of debt. Journal of Financial Economics, 68:263–285.
Atanasov, V., Boone, A., and Haushalter, D. (2009). Is there shareholder expropriation in the U.S.? An analysis of publicly-traded subsidiaries. forthcoming Jouranl of Financial and Quantitative Analysis.
Bae, K. H., Kang, J. K., and Kim, J. M. (2002). Tunneling or value added? Evidence from mergers by Korean business groups. Journal of Finance, 57:2695–2740.
Baek, J. S., Kang, J. K., and Lee, I. (2006). Business groups and tunneling: Evidence from private securities offerings by Korean chaebols. Journal of Finance, 61:2415– 2449.
Bennedsen, M. and Wolfenzon, D. (2000). The balance of power in closely held corpo-rations. Journal of Financial Economics, 58:113–139.
Berger, P., Ofek, E., and Yermack, D. (1997). Managerial entrenchment and capital structure decisions. Journal of Finance, 52:1411–1438.
Bertrand, M., Mehta, P., and Mullainathan, S. (2002). Ferreting out tunneling: An application to Indian business groups. Quarterly Journal of Economics, 118:121–148. Bertrand, M. and Mullainathan, S. (2003). Pyramids.Journal of the European Economic
Association, 1:478–483.
Bianco, M. and Nicodano, G. (2006). Pyramidal groups and debt. European Economic Review, 50:927–967.
Bloch, F. and Hege, U. (2001). Multiple shareholders and control contests. mimeo. Bolton, P. and Thaden, E. L. V. (1998). Blocks, liquidity and corporate control: An
analysis of German takeovers. Journal of Finance, 53:1–25.
Booth, L., Aivazian, V., Demirguc-kunt, A., and Maksimovic, V. (2001). Capital struc-tures in developing countries. Journal of Finance, 56:87–130.
Burkart, M., Gromb, D., and Panunzi, F. (1997). Large shareholders, monitoring, and the value of the firm. Quarterly Journal of Economics, 112:693–728.
Caliendo, M. and Kopeinig, S. (2008). Some practical guidance for the implementation of propensity score matching. Journal of Economic Surveys, 22:31–72.
Claessens, S., Fan, J., and Lang, L. (2006). The benefits and costs of group affiliation: Evidence from East Asia. Emerging Markets Review, 7:1–26.
DeAngelo, H. and Masulis, R. (1980). Optimal capital strucutre under corporate and personal taxation. Journal of Financial Economcis, 8:5–29.
Ellul, A. (2008). Control motives and capital structure decisions. Working paper, SSRN: http://ssrn.com/abstract=1094997.
Enriques, L. and Volpin, P. (2007). Corporate governance reforms in continental Europe. Journal of Economic Perspectives, 1:117–140.
Faccio, M. and Lang, L. (2002). The ultimate ownership of Western European corpora-tions. Journal of Financial Economics, 65:365–395.
Faccio, M., Lang, L. H. P., and Young, L. (2003). Debt and expropriation. Working paper.
Gadhoum, Y. (2006). Power of ultimate controlling owners: A survey of Canadian landscape. Journal of Management Governance, 10:179–204.
Gomes, A. R. and Novaes, W. (2005). Sharing of control as a corporate governance mechanism. PIER Working Paper No. 01-029.
Gul, F. and Tsui, J. (1998). A test of the free cash flow and debt monitoring hypotheses: Evidence from audit pricing. Journal of Accounting and Economics, 24:219–237. Harris, M. and Raviv, A. (1988). Corporate control contests and capital structure.
Journal of Financial Economics, 20:55–86.
Israel, R. (1991). Capital structure and the market for capital control: The defensive role of debt financing. Journal of Finance, 46:1391–1409.
Jensen, M. C. (1986). Agency costs of free cash flow, corporate finance, and takeovers. American Economic Review, 76:323–329.
Joh, S. W. (2003). Corporate governance and firm profitability: Evidence from Korea before the economic crisis. Journal of Financial Economics, 68:287–322.
Johnson, S., La Porta, R., Lopez-de-Silanes, F., and Shleifer, A. (2000). Tunneling. American Economics Review, 90:22–27.
Khanna, T. and Yafeh, Y. (2007). Business groups in emerging markets: Paragons or parasites? Journal of Economic Literature, 65:331–372.
La Porta, R., Lopez-de-Silanes, F., and Shleifer, A. (1999). Corporate ownership around the world. Journal of Finance, 54:471–518.
La Porta, R., Lopez-de-Silanes, F., Shleifer, A., and Vishny, R. (1998). Law and finance. Journal of Political Economy, 106:1113–1155.
La Porta, R., Lopez-de-Silanes, F., Shleifer, A., and Vishny, R. (2000). Agency problems and dividend policies around the world. Journal of Finance, 55:1–33.
Laeven, L. and Levine, R. (2008). Complex ownership structures and corporate valua-tions. Review of Financial Studies, 21:579–604.
Lang, L., Stulz, R., and Walking, R. (1991). A test of the free cash flow hypothesis. Journal of Financial Economics, 29:315–335.
Li, X. and Zhao, X. (2006). Propensity score matching and abnormal performance after seasoned equity offerings. Journal of Empirical Finance, 13:351–370.
Maloney, M., McCormick, R., and Mitchell, M. L. (1993). Managerial decision making and capital structure. The Journal of Business, 66:189–217.
Manos, R., Murinde, V., and Green, C. J. (2007). Leverage and business groups: Evi-dence from indian firms. Journal of Economics and Business, 59:443–465.
Maury, B. and Pajuste, A. (2005). Multiple controlling shareholders and firm value. Journal of Banking and Finance, 29:1813–1834.
Morck, R., Wolfenzon, D., and Yeung, B. (2005). Corporate governance, economic entrenchemnt, and growth. Journal of Economic Literature, 63:655–720.
Myers, S. (1977). Determinants of corporate borrowing. Journal of Financial Economics, 5:147–175.
Pagano, M. and Roell, A. (1998). The choice of stock ownershp structure: Agency costs, monitoring, and the decision to go public. Quarterly Journal of Economics, 113:187–226.
Petersen, M. (2008). Estimating standard errors in finance panel data sets: Comparing approaches. Review of Financial Studies, forthcoming.
Rajan, R. G. and Zingales, L. (1995). What do we know about capital structure? Some evidence from international data. Journal of Finance, 50:1421–1460.
Rosenbaum, P. and Rubin, D. (1983). The central role of propensity score in observable studies for causal effects. Biometrica, 70:41–55.
Rosenbaum, P. and Rubin, D. (1985). Constructing a control group using multivariate matched sampling methods that incorporate the propensity score. The American Statistician, 39:33–38.
Smith, J. and Todd, P. (2005). Does matching overcome LaLonde’s critique of nonex-perimental estimators? Journal of Econometrics, 125:305–353.
Stulz, R. (1988). Managerial control of voting rights: Financing policies and the market for corporate control. Journal of Financial Economics, 20:25–54.
Winton, A. (1993). Limitation of liability and the ownership structure of the firm. Journal of Finance, 48:487–512.
Zwiebel, J. (1995). Block investment and partial benefits of corporate control. Review of Economic Studies, 62:191–185.
Zwiebel, J. (1996). Dynamic capital strucutre under managerial entrenchment.American Economic Review, 86:1197–1215.
T able 1:
Ownership
P
atterns
Across
Coun
tries
This table presen ts the ownership structure (in p ercen tages) of publicly traded companies across G7 coun tries ov er 2003-2006. An ultimately owned (widely held) firm has con trolling shareholder (ultimate owner) who owns directly and/or indirectly at least 20% (b elo w 20%) of the votes. Pyramid is defined as a compan y con trolled b y an ultimate owner and ha ving subsidiaries. Ownership Structure Canada German y F rance UK Italy Japan USA T otal Num b er of Firms 1,020 672 653 1,949 207 2,407 5,259 12,167 Ultimately Owned 42.25 92.71 93.72 48.85 84.54 16.2 38.83 42.94 Widely Held 57.75 7.29 6.28 51.15 15.46 83.8 61.17 57.06 Pyr amid Structur es Pyramid (at 20%) 31.27 85.71 88.51 43.67 81.16 6.56 30.6 35.01 Pyramid (at 10%) 42.55 84.97 83 65.35 87.44 8.18 49.23 47.57 Identity of the Ultimate Owner in Pyr amids F amily 15.19 35.26 44 33.18 44.05 5.7 41.6 36.05 Industrial Compan y 55.06 33.82 31.28 39.55 40.48 75.95 32.6 37.66 Financial Compan y 4.11 4.16 6.89 8.62 2.98 5.7 7.06 6.53 Ownership Structur e in Pyr amids Pyramid with Second Largest Owner at 10% 43.26 63.72 70.07 45.19 64.88 18.35 40.46 48.92 Pyramid with Second Largest Owner at 20% 21.63 43.75 41.87 18.43 50 12.03 17.15 25.8T able 2:
Summary
Statistics
for
Firm
Characteristics
in
G7
Coun
tries
The table rep orts the means (in p ercen ts) and standard deviations of firm variables for G7 coun tries ov er the p erio d 2003-2006. Financial firms (SIC 6000-6999) are excluded. Bo ok lev erage is the b o ok value of debt to b o ok value of equit y and debt. Mark et lev erage is the b o ok value of debt to the sum of b o ok value of debt and mark et equit y. Bo ok debt is long-term debt and short-term debt. Mark et-to-b o ok (M/B) is mark et value of equit y divided b y b o ok value of equit y. Profitabilit y is defined as earnings b efore in terest, taxes, depreciation, and amortization divided b y total assets. Log sales is logarithm of net sales. T angibilit y is defined as fixed assets to total assets. Debt Issues is yearly change in b o ok debt ov er total assets. Bo ok Lev. Mark et Lev. M/B Profit. Log(Sales) T angibilit y Canada Mean 32.99 23.03 2.50 4.65 4.59 40.87 Std. Dev. 32.17 23.64 4.24 21.15 2.38 29.17 German y Mean 37.91 31.28 2.04 8.53 5.41 23.80 Std. Dev. 29.65 28.23 4.81 14.97 2.25 19.78 F rance Mean 39.87 28.12 2.47 9.81 5.30 18.30 Std. Dev. 33.35 25.15 6.00 10.36 2.14 17.47 UK Mean 37.17 23.27 2.57 7.23 4.95 26.62 Std. Dev. 39.03 22.18 5.55 17.81 2.43 25.69 Italy Mean 42.53 32.36 1.97 8.78 5.78 25.08 Std. Dev. 28.46 24.21 3.90 16.06 1.77 20.34 Japan Mean 32.86 29.98 1.79 8.78 6.07 29.58 Std. Dev. 26.58 25.41 2.71 6.83 1.50 18.06 US Mean 31.74 19.18 3.04 4.19 5.40 23.34 Std. Dev. 39.32 22.84 5.37 23.37 2.30 22.21 T otal Mean 33.64 24.06 2.52 6.36 5.47 26.41 Std. Dev. 34.98 24.53 4.76 18.56 2.16 22.47T able 3:
Comparison
of
Mean
Firm
Characteristics
b
et
w
een
Pyramids
and
Non-Pyramids
This table rep orts means of firm characteristics for p yramid and non-p yramid firms. Pyramid indicates if a firm is affiliated to a p yramidal group via direct and/or indirect chain of con trol at the 20% cut off p oin t. Bo ok lev erage is the b o ok value of debt to b o ok value of equit y and debt. Bo ok debt is long-term debt and short-term debt. Mark et-to-b o ok (M/B) is mark et value of equit y divided b y b o ok value equit y. Profitabilit y is earnings b efore in terest, taxes, depreciation, and amortization divided b y total assets. Log sales is logarithm of net sales. T angibilit y is fixed assets to total assets. Debt Issues is the yearly change in b o ok debt ov er total assets. Equit y Issues is the difference in yearly changes of b o ok equit y and retained earnings scaled b y total assets. Standard errors are rep orted in brac kets. *** indicates significance at the 1% lev el. Bo ok Lev erage M/B Profit. Log(Sales) T angib. Debt Issues Equit y Issues Pyramid 37.93 2.32 7.79 5.38 24.84 1.09 6.25 Non-Pyramid 30.27 2.57 5.46 5.48 26.72 0.44 8.76 Mean Difference 7.65*** -0.25*** 2.33*** -0.01*** -1.87*** 0.65*** 2.51*** [0.42] [0.06] [0.21] [0.03] [0.25] [0.17] [0.34]T able 4:
Lev
erage
and
Firm
Characteristics
Across
Coun
tries
This table rep orts results of regressions of b o ok lev erage on firm characteristic variables. Lev er ag eit = α + β1 P rof itabil ity it − 1 + β2 T ang ibil ity it − 1 + β3 M /B it − 1 + β4 Log ( S al es )it− 1 + ²it Bo ok lev erage is the b o ok value of debt to b o ok value of equit y and debt. Bo ok debt is long-term debt and short-term debt. Mark et-to-b o ok ratio (M/B) is defined as mark et equit y divided b y b o ok equit y. P rof itabil ity is earnings b efore in terest, taxes, and depreciation divided b y total assets. log ( S al es ) is logarithm of net sales. T ang ibil ity denotes net prop ert y, plan t and equipmen t divided b y total assets. Robust standard errors (clustered at the firm lev el) are rep orted in brac kets. *** denotes 1% significan t lev el, ** denotes 5% significan t lev el, and * denotes 10% significan t lev el. ALL US Canada United Kingdom F rance German y Italy Japan P rof itabil ity t − 1 -0.195*** -0.134*** -0.287* -0.133 -0.506** -0.327** 0.022 -1.128*** [0.032] [0.038] [0.160] [0.116] [0.207] [0.142] [0.136] [0.086] T ang ibil ity t − 1 0.290*** 0.298*** 0.170*** 0.153*** 0.378*** 0.371*** -0.033 0.553*** [0.018] [0.030] [0.054] [0.043] [0.077] [0.053] [0.122] [0.030] M /B t − 1 -0.16 -0.312** -0.139 0.053 -0.127 -0.345 -1.431** 1.910*** [0.099] [0.136] [0.355] [0.271] [0.260] [0.385] [0.566] [0.265] log ( S al es )t− 1 2.479*** 2.305*** 1.933*** 3.785*** 1.514** 0.662 4.185*** 2.790*** [0.180] [0.268] [0.660] [0.620] [0.619] [0.583] [1.202] [0.337] Observ ations 20072 9291 1021 1688 1133 959 371 5609 Firms 7877 3614 461 757 457 395 148 2045 R 2 0.07 0.06 0.09 0.08 0.08 0.08 0.13 0.23T able 5:
T
ests
of
the
Expropriation
Hyp
othesis
This table rep orts the estimates from OLS regressions where the dep enden t variables are b o ok and mark et lev erage of firms affiliated with p yramids. Bo ok lev erage is the b o ok value of debt to b o ok value of equit y and debt. Bo ok lev erage is long-term debt and short-term debt. Mark et lev erage is defined in a similar w ay; instead of b o ok equit y, mark et equit y is included. P y ramid is a dumm y whic h equals to 1 if a firm is affiliated to a p yramidal group at the 20% cutoff p oin t and 0 otherwise. H ig hC reditR ig hts , and Lar ge F ir ms are dumm y variables taking the value of one for values higher than resp ectiv e sample medians. P rof itabil ity is earnings b efore in terest, taxes, and depreciation divided b y total assets. log ( S al es ) is logarithm of net sales. T ang ibil ity denotes net prop ert y, plan t and equipmen t divided b y total assets. Mark et-to-b o ok ratio ( M /B ) is defined as mark et equit y divided b y b o ok equit y. The estimates of constan t, industry , coun try and time dummies are not rep orted. Robust standard errors (clustered at the firm lev el) are rep orted in brac kets. *** denotes 1% significan t lev el, ** denotes 5% significan t lev el, and * denotes 10% significan t lev el. Bo ok Lev erage Mark et Lev erage (1) (2) (3) (4) (5) (6) P yr amid 5.642*** 9.731*** 8.109*** 4.415*** 8.221*** 6.595*** [0.984] [1.065] [1.386] [0.604] [0.651] [0.844] H ig hC reditR ig hts 1.823** 7.006*** [0.782] [0.541] P yr amid × H ig hC reditR ig hts -3.941** -5.695*** [1.551] [1.087] Lar geF ir ms 1.507 1.523** [1.034] [0.715] P yr amid × Lar geF ir ms -4.195*** -3.707*** [1.601] [1.025] P rof itabil ity t − 1 -0.199*** -0.192*** -0.199*** -0.144*** -0.142*** -0.144*** [0.032] [0.032] [0.033] [0.015] [0.015] [0.015] T ang ibil ity t − 1 0.289*** 0.276*** 0.288*** 0.260*** 0.252*** 0.260*** [0.018] [0.017] [0.018] [0.012] [0.012] [0.012] M /B t − 1 -0.145 -0.13 -0.139 -0.531*** -0.547*** -0.525*** [0.099] [0.099] [0.099] [0.043] [0.043] [0.043] log ( S al es )t− 1 2.478*** 2.397*** 2.460*** 1.575*** 1.589*** 1.524*** [0.180] [0.178] [0.243] [0.121] [0.122] [0.169] Observ ations 20072 20072 20072 19862 19862 19862 Firms 7,877 7,877 7877 7798 7798 7798 R 2 0.08 0.07 0.08 0.16 0.15 0.16Table 6:
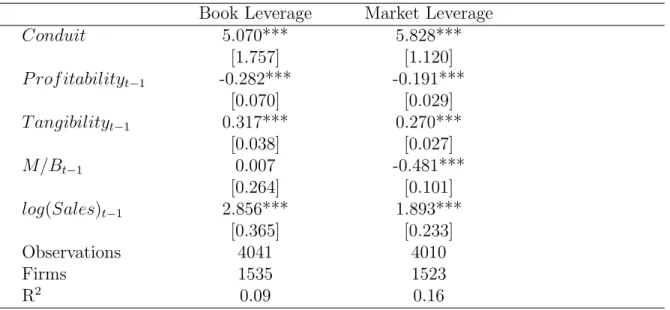
Comparison of Pyramid and Controlled Stand-alone Firms
This table reports the estimates from OLS regressions where the dependent variables are book and market leverage of firms affiliated with pyramids. Book leverage is the book value of debt to book value of equity and debt. Book leverage is long-term debt and short-term debt. Market leverage is defined in a similar way; instead of book equity, market equity is included. The sample is restricted only to those ultimate owners that control simultaneously stand-alone (no subsidiaries) and pyramids firms at the 20% level. Conduit is defined for each ultimate owner. It is a dummy variable, which equals to 1 if firms are affiliated to a pyramidal group controlled by the same ultimate owner at the 20% cutoff point and 0 if they are stand-alone firms. is otherwise. P rof itability is earnings before interest, taxes, and depreciation divided by total assets. log(Sales) is logarithm of net sales. T angibilitydenotes net property, plant and equipment divided by total assets. Market-to-book ratio (M/B) is defined as market equity divided by book equity. The estimates of constant, industry, and time dummies are not reported. Robust standard errors (clustered at the firm level) are reported in brackets. *** denotes 1% significant level, ** denotes 5% significant level, and * denotes 10% significant level.Book Leverage Market Leverage
Conduit 5.070*** 5.828*** [1.757] [1.120] P rof itabilityt−1 -0.282*** -0.191*** [0.070] [0.029] T angibilityt−1 0.317*** 0.270*** [0.038] [0.027] M/Bt−1 0.007 -0.481*** [0.264] [0.101] log(Sales)t−1 2.856*** 1.893*** [0.365] [0.233] Observations 4041 4010 Firms 1535 1523 R2 0.09 0.16
Table 7:
Leverage and the Second Largest Owner
This table reports the estimates from OLS regressions where the dependent variables are book and market leverage of firms affiliated with pyramids. Book leverage is the book value of debt to book value of equity and debt. Book leverage is long-term debt and short-term debt. Market leverage is defined in a similar way; instead of book equity, market equity is included. V R1 (V R2) is the percentage shareholdings of the largest (second largest) owner. P rof itability is earnings before interest, taxes, and depreciation divided by total assets. log(Sales) is logarithm of net sales.
T angibilitydenotes net property, plant and equipment divided by total assets. Market-to-book ratio (M/B) is defined as market equity divided by book equity. The estimates of constant, industry, country and time dummies are not reported. Robust standard errors (clustered at the firm level) are reported in brackets. *** denotes 1% significant level, ** denotes 5% significant level, and * denotes 10% significant level.
Book Leverage Market Leverage
(1) (2) (3) (4) V R2 0.121* 0.06* [0.065] [0.03] (V R1−V R2)/(V R1 +V R2) -0.060* -0.036* [0.033] [0.02] P rof itabilityt−1 -0.128 -0.12 -0.191*** -0.194*** [0.183] [0.191] [0.054] [0.056] T angibilityt−1 0.213*** 0.194*** 0.344*** 0.333*** [0.048] [0.050] [0.033] [0.034] M/Bt−1 -0.431* -0.441 -0.475*** -0.458*** [0.251] [0.269] [0.123] [0.131] log(Sales)t−1 1.657*** 1.642*** 0.797** 0.885** [0.487] [0.518] [0.342] [0.361] Observations 2940 2754 2853 2674 Firms 1264 1184 1239 1161 R2 0.04 0.03 0.14 0.14
Table 8:
Leverage of Family and non-Family Pyramids
This table reports the estimates from OLS regressions where the dependent variable is book leverage. Book leverage is the book value of debt to book value of equity and debt. Book debt is long-term debt and short-term debt. V R1(V R2) is the percentage holdings of the largest (second largest) owner.P rof itability is earnings before interest, taxes, and depreciation divided by total assets.
log(Sales) is logarithm of net sales. T angibilitydenotes net property, plant and equipment divided by total assets. Market-to-book ratio (M/B) is defined as market equity divided by book equity. The estimates of constant, industry, country and time dummies are not reported. Robust standard errors (clustered at the firm level) are reported in brackets. *** denotes 1% significant level, ** denotes 5% significant level, and * denotes 10% significant level.
Family Non-Family Family Non-Family
Pyramid Pyramid Pyramid Pyramid
(1) (2) (3) (4) V R2 0.066 0.206** [0.097] [0.086] (V R1−V R2)/(V R1 +V R2) -0.029 -0.143** [0.043] [0.056] P rof itabilityt−1 -0.126 -0.083 -0.107 -0.093 [0.306] [0.098] [0.304] [0.108] T angibilityt−1 0.225*** 0.199*** 0.181** 0.192*** [0.086] [0.053] [0.086] [0.056] M/Bt−1 -0.338 -0.498* -0.254 -0.621* [0.407] [0.300] [0.418] [0.342] log(Sales)t−1 1.085 1.955*** 0.99 2.091*** [0.742] [0.575] [0.762] [0.628] Observations 1379 1561 1324 1430 Firms 584 680 559 625 R2 0.03 0.07 0.03 0.07
Table 9:
Regressions: Alternative Explanations
This table reports the estimates from OLS regressions of book leverage on pyramid dummy, variables that might affect leverage, and the interactive terms. Book leverage is the book value of debt to book value of equity and debt. Book debt is long-term debt and short-term debt. P yramidis a dummy which equals to 1 if a firm is affiliated to a pyramidal group at the 20% cutoff point and 0 otherwise. F amilyP yramid is a dummy which equals to 1 if a pyramid firm is controlled by a family and 0 otherwise. HighF CF is a dummy variables taking the value of one for values higher than the sample median, and zero otherwise. F CF is operating income before depreciation minus interest expense, taxes, preferred dividends, and common dividends divided by total assets. Log sales is the logarithm of net sales. N DT is non-debt tax shield defined as the ratio of depreciation to profit before depreciation, interest and taxes. The estimates of profitability, tangibility, market-to-book, sales, constant, industry, country and time dummies are not reported. Robust standard errors (clustered at the firm level) are reported in brackets. *** denotes 1% significant level, ** denotes 5% significant level, and * denotes 10% significant level.
Book Leverage Market Leverage
(1) (2) (3) (4) (5) (6) F amilyP yramid -4.165*** -1.964** [1.456] [0.940] P yramid 5.106*** 6.113*** 3.373*** 4.540*** [1.359] [1.024] [0.870] [0.622] HighF CF 2.196*** 2.576*** [0.800] [0.519] P yramid×HighF CF 0.676 -1.867* [1.499] [0.978] NDTt−1 -0.015** -0.018*** [0.006] [0.004] P yramid×NDTt−1 0.