Maispion: A Tool for Analysing and Visualising
Open Source Software Developer Communities
Franc¸ois Stephany
Universit´e de Mons & agilitic
Tom Mens
Universit´e de Mons [email protected]Tudor Gˆırba
University of Berne [email protected]Abstract
We presentMaispion, a tool for analysing software devel-oper communities. The tool, developed in Smalltalk, mines mailing list and version repositories, and provides visualisa-tions to provide insights into the ecosystem of open source software (OSS) development. We show how Maispion can analyse the history of medium to large OSS communities, by applying our tool to three well-known open source projects: Moose, Drupal and Python.
Keywords software evolution, mining software reposito-ries, software visualisation, Smalltalk, open source
1.
Introduction
Communication is crucial for the long term success of soft-ware projects [Brooks 1975, DeMarco and Lister 1987]. De-velopers need to communicate with their peers and to share information within their team in order to get the most ef-ficient coordination. This is especially true in open source software projects, that have a flexible and volatile social structure and are often managed in a less strict way. How-ever, the larger the team, the more difficult communication is.
Numerous researchers explored the ecosystem of open source software development [Madey et al. 2002, Mockus et al. 2002, Nakakoji et al. 2002]. Nevertheless, dedicated tool support for analysing and visualising the social structure of open source software development, and how it evolves, is largely inexistent. To fill this gap, we implemented a Smalltalk tool, calledMaispion. In this article, we illustrate how this tool can be used to analyse and visualise mailing lists and source code version repositories of open source projects. We validate our tool by applying it on three
well-Permission to make digital or hard copies of all or part of this work for personal or classroom use is granted without fee provided that copies are not made or distributed for profit or commercial advantage and that copies bear this notice and the full citation on the first page. To copy otherwise, to republish, to post on servers or to redistribute to lists, requires prior specific permission and/or a fee.
IWST 2009 31 August 2009, Brest, France. Copyright c2009 ACM [to be supplied]. . . $10.00
known open source projects (Moose, Drupal and Python) for which we aim to understand how their developer community behaves.
The paper is organized as follows. Section 2 explains the various visualisations provided byMaispion. Section 3 shows the internals of our tool. In Section 4 we discuss the results obtained from applying our tool to the case studies. In Section 5 we conclude and provide an outlook of the future work.
2.
Visualising communication with Maispion
Analysing mailing lists used by a community of software developers provides insights in how developers work and what are the most important persons involved in the project. Open-source projects typically have a mailing list that channels the communication in the project. Mailman1is one of the most most used infrastructures for handling mailing lists. While these infrastructures do offer a robust service for handling and dispatching mails, they provide only a rudimentary overview of the discussions that already took place.In this section we explain the different visualisations of mailing list data and versioning data thatMaispionprovides. 2.1 Tree view
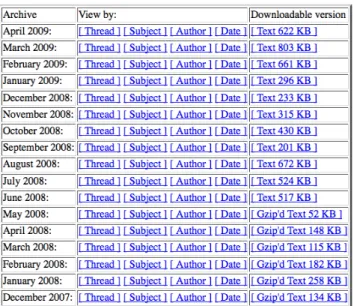
First of all, a mailing list can be seen as a tree, in which each mail either starts a new thread or is a response to another mail from an existing thread. Browsing the Mailman archives online with a web browser does not help much: We can only browse the mailing list on a monthly basis and we cannot easily see who are the persons that are the most active or which threads are particularly long (see Figure 1).
Maispioncan provide a digest of the mailing list by showing all the e-mail threads as trees.
For example, Figure 2 shows a number of threads in the Moose mailing list. In this visualisation, each e-mail is represented by a square. A tree of e-mails is actually a thread, where the top square is the first e-mail of this thread. The distance between an e-mail and a reply maps the time between the two; the longer the time, the longer the edge.
Figure 1. A sample of Mailman web archives from the Drupal mailing list
We took the ten persons that have sent the most e-mails and assigned a colour to each of them. The white colour is assigned to the other individuals. As with all the other diagrams and visualisations, this view is interactive. It is possible to right-click on any entity and open an inspector on it or launch another visualisation (the menu will show any action that is relevant for the selected entity).
Figure 2. E-mail threads in the Moose mailing list
2.2 Activity distribution over time
In order to detect whether or not a project is developed by professional developers, it is important to know when they
are working. While professional programmers are paid to work on the project during office hours from Monday to Fri-day2, non-professionals are more likely to develop during the evening. To verify this hypothesis,Maispion can gen-erate diagrams that show when developers are committing code or when they are sending e-mails. For example, Fig-ure 3 shows that most of the commits in the Drupal version repository happen between 9AM and 7PM, followed by a peak in activity until midnight. As such, Drupal developers appear to continue to work after office hours.
Figure 3. Hourly activity of commits in the Drupal repos-itory. Thex-axis shows the hour of the day and they-axis maps the average number of commits made during the given hour.
2.3 Evolution of the activity
We assess the activity in the mailing list by the number of e-mails that are sent. In a version repository, an activity is basically a commit. By analysing the evolution of the activity we know if the project is growing, stable or even abandoned. The level of activity is a good indicator of the health of a project.Maispiongives a monthly view of the activity. This view is available for the repository and for the mailing list. The two can be combined within the same diagram (see Figure 4).
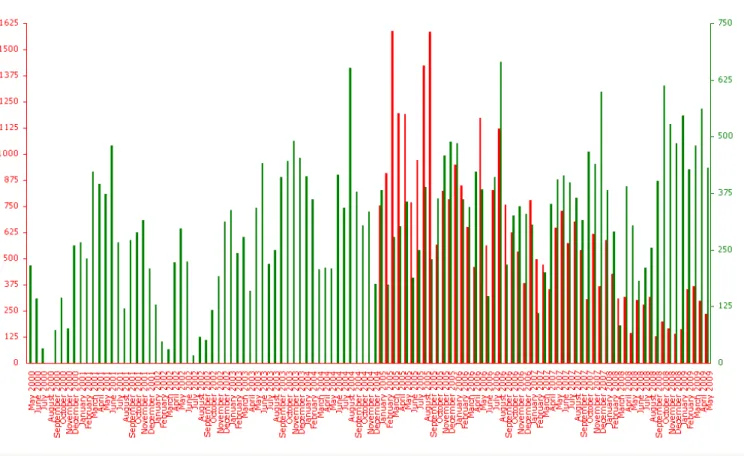
In software development, a sprint is a short amount of time (maximum several days) dedicated to work on a project. The developers meet in real life and stay together during the sprint. If we want to analyse a posteriori what happened during such a code sprint, it is possible to show the activity on a daily basis. Figure 5 shows the daily activity of the Python project. Each point of the horizontal axis represent one day. The bar that goes up maps the number of e-mails
2This does not exclude, of course, that they may and often will continue to
Figure 4. Drupal monthly evolution of activity (red bars represent the e-mail volume, green bars represent the commit volume)
Figure 5. Daily activity for the Python project
that were sent that day while the bar that goes down maps the number of commits that were pushed in the repository that day.
2.4 Committers period of activity
Despite major differences, open source developers have a common point with developers employed to work on a pro-prietary project: they come and go. Open source developers are free to leave a project or to join an existing one.
Mais-pionproposes a visualisation to spot this behaviour. Figure 6 shows the activity period of the Drupal-core committers.
Figure 6. Drupal committers period of activity. Each hor-izontal line represents the commit activity period of a de-veloper. Only the first individual, which happens to be the founder of Drupal, was active over the entire studied period.
2.5 E-mail addresses and repository logins usage It is not uncommon for people to use multiple e-mail dresses. For example, they sometimes start using a new ad-dress when they change their job or when they leave uni-versity. To visualise this behaviour, we developed a diagram showing how an individual uses his e-mail addresses over time when contributing to a mailing list. For example, Fig-ure 7 shows that a particular Moose developer has used 5 different e-mail addresses during the time period studied: 2 private e-mail addresses, and 3 different university ad-dresses. The latter reflects the fact that this particular person has moved twice to a different university. We also observe a clear overlap of his e-mail address usage.
Figure 7. Email addresses usage of a specific developer on the Moose mailing list. Each horizontal bar represents a different e-mail address of this developer.
This view is also available for the repository logins. Be-cause a repository account is set up once, a developer will not change his repository login as often as his e-mail address but it sometimes happens.
2.6 Interlocutors and collaborators
The purpose of a (developer) mailing list is to communi-cate with other individuals participating in the project. To know who are the primary interlocutors of someone, Mais-pionshows with whom someone is communicating the most frequently. We consider two persons to be communicating with each other if they are active in the same thread. Mais-pioncan display the interlocutors of a particular individual. Figure 8 illustrates this for the most active commiter of Dru-pal. He appears to be communicating a lot with (i.e., partic-ipating in the same e-mail threas as) only a few developers, and only occasionally with the majority of the other devel-opers.
A similar view is proposed to see the collaborators of an individual in the version repository. For a Store repository, we say that two persons are collaborators if they have com-mitted code to the same project [Lungu et al. 2007]. For a CVS or SVN repository, we say that two persons are col-laborators if they have worked on the same file [Gˆırba et al. 2005].
Figure 8. Communication frequency of one of the key de-velopers of Drupal with other dede-velopers (in the mailing list).
2.7 Distribution of commit volume
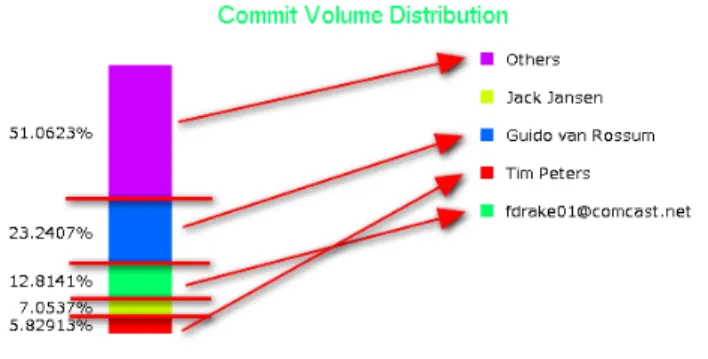
Many successful open source projects were started by a programmer who wanted to solve a particular problem. He started to develop a tool that he intended to use for his personal needs, but once the tool is released to the public it gains attention from other developers. The consequence of this schema is that one person (the creator of the project) commits a lot and often owns the majority of the code. He is the person who drives the project and decides which patches will be integrated or not. If this person stops to work on the project, the probability that the whole project dies can be quite high. To analyse this possibility, we want to identify the key persons involved in a software project. We developed three different view for this purpose; the commit activity distribution(Figure 9), thee-mail activity distribution, and theactivity scatterplot(Figure 10). The latter one shows how commit activity and e-mail activity are correlated. As we can see in the figure, some people tend to be more active in the mailing list, while others are more active in the version repository.
Figure 9. Commit distribution in the Python source reposi-tory
3.
Maispion architecture
Maispion was developed by the first author in the context of his master thesis [Stephany 2009] on top of the Moose platform [Ducasse et al. 2005].Maispionimports data from source code version repositories and mailing lists. This data is subsequently processed byMaispionusing dedicated visu-alisations implemented usingMondrian[Meyer 2006] and
Figure 10. Activity scatterplot for the Python project. The
x-axis represents the number of commits, the y-axis the number of e-mails
Eyesee [Junker and Hofstetter 2007].Maispion was devel-oped with Visualworks 7.6 and is available on the SCG Store repository3.
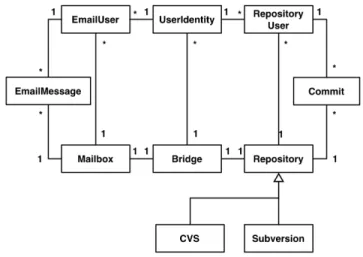
3.1 Importing versions and mailing lists
Figure 11 shows the essence ofMaispion’s architecture. A bridge pattern is used to capture the central notion of UserI-dentity. It aggregates the fact that any individual can con-tribute to the open source project in two different ways: by sending e-mails to the mailing list, or by committing versions to the source code repository. The same user can use many different email addresses (each represented by EmailUser) to communicate on the mailing list, and can have different identities (each represented by RepositoryUser) when committing to the version repository. The Bridge is used to link a Mailbox, a Repository and the user identities. A Mailbox keeps track of its e-mail senders and messages. A repository does the same for its users and commits.
In its current version,Maispion supports three different types of version repositories: SVN, CVS and Store. The cho-sen architecture abstracts away from these different reposi-tories by putting all common version control behaviour in the Repository class that is specialised for each supported type of version repository. All Maispion’s visualisations are defined at the abstract level, and new types of version
reposi-3Seescg.unibe.ch/wiki/howtos/howtoaccessscgstoreto find out
how to access this repository.
Figure 11. Core architecture of Maispion
tories (e.g., Git, Perforce) can be accomodated easily by cre-ating new subclasses of Repository.
For the three currently supported version repositories we proceeded as follows. CVS logs were imported with the help
of Chronia [Seeberger et al. 2006]. SVN logs, generated
by SVN in XML format4, were imported using existing
Smalltalk libraries for XML parsing. To import data from the Store repository, we used theStoreIt tool, available on the SCG Store repository.
Maispioncurrently imports e-mails encoded in thembox
format [Hall 2005].Maispion can automatically download mailing lists hosted byMailman, an open source mailing list management tool used by many open source projects (e.g., Pharo, Python, Imagemagick). Accommodating other types of mailing list formats is left for future work.
All the data imported inMaispion can be browsed with the Moose browser. This browser helps to navigate within an instance of a model.
3.2 Merging identities
One of the most important issues when dealing with multiple sources of data is the identification of individuals. We need to identify persons committing source code in the reposi-tory with the mailing list participants.Maispionsolves this problem by performing a semi-automatic identity recogni-tion. Figure 12 illustrates our method.
The similarity between two strings is computed using the Levenshtein distance [Navarro 2001]. It is a real distance metric in the mathematical sense of the word (i.e., it is sym-metric and satisfies the triangle inequality). This distance represents the minimal number of insertions, deletions and substitutions to make the two strings equal. Thus, if the two strings are identical, the Levenshtein distance between them is0. For example,Maispionwill detect that the mailing list participants
4The following command can be used to generate an SVN log in XML
(a) E-mail with e-mail
(b) E-mail with repository login Figure 12. User identity detection
[email protected] (Francois Stephany)and
[email protected] (francois) are probably the
same person: the nameFrancois Stephanyfrom the first e-mail will generate a list of possible nicknames that includes
fstephany.
Figure 13. Merge Browser
Of course this approach has its limitations: it is impossi-ble to identify accurately whether two e-mail addresses be-long to the same individual if the names used are completely different. For example, it is impossible to know that [email protected] from a mailing list is related to the logintulipe.moutardein a version repository without per-forming a social search. In the case of open source software, social websites such as Twitter, Sourceforge and Github are good starting points. We thus need to perform a manual
ver-Table 1. General information about Moose, Drupal and Python
Moose Drupal Python
Repository type Store CVS CVS/SVN
#e-mails 2422 32729 88660 #commits 65768 33594 42219 #committers 227 8 172 #mailinglist users 74 1126 2519 First e-mail 20/04/2007 14/01/2005 21/04/1999 Latest e-mail 17/05/2009 23/05/2009 27/05/2009 First commit 27/04/2001 18/05/2000 09/08/1990 Latest commit 19/05/2009 22/05/2009 27/05/2009
ification of all the identity associations generated by Mais-pion. This task is facilitated by theMerge browser that we implemented. Figure 13 illustrates how the user can easily edit, compare and create identities from e-mail addresses or version repository logins.
4.
Validation
To show that Maispion can be used in practice, we validated it by analysing and visualising three open source projects:
Moose5,Drupal6andPython7. Table 1 shows the main char-acteristics of each studied system.
•Drupal was started as an information sharing tool be-tween a small group of students. Its creator probably never expected that his pet project would become so suc-cessful. Drupal is implemented in a very popular lan-guage for web programming: PHP. The developers of the Drupal-core are of course not PHP beginners but mod-ules and themes can be easily developed by a regular programmer and are easy to deploy. We analysed the CVS repository of Drupal as well as theDrupal-core dev8
mailing list.
•Pythonis a very popular programming language. Design-ing a programmDesign-ing language is hard and requires many skills. A project like Python cannot be developed by a be-ginner who just learned to program. The people who are developing and discussing the future of Python are prob-ably highly skilled. We analysed thePython-dev9mailing
list, as well as the CVS and SVN version repositories. Ini-tially Python code was stored in CVS, but the developer community decided to migrate at a certain point in time to SVN. 5http://moose.unibe.ch/ 6http://drupal.org/ 7http://python.org/ 8http://lists.drupal.org/pipermail/development/ 9http://mail.python.org/pipermail/python-dev/
•Mooseis an academic project developed by researchers, master and bachelor students. The hobbyist programmer probably does not have any interest in contributing to Moose. This makes the project very different from the two others. We analysed theMoose-dev10 mailing list as well as the Store version repository.
The use of the different visualisations that Maispion pro-vided allows us to make several observations about these three projects. We discuss these in the following subsections. 4.1 General evolution
From Figure 4 we observe (by looking at the red vertical bars) that the overall activity in the Drupal mailing list de-creases over time. This behaviour was unexpected. We found that the first major decrease was due to a change in the bug tracking system (up till a certain point in time, every change in the bug tracking system was automatically notified in the mailing list as well) but we did not find any credible reason for the long term decrease of activity.
We did not observe this phenomenon for the Python mail-ing list activity. On the contrary, we observed that Python gained in popularity between releases 1.5 and 1.6. The mail-ing lists of both projects see awaveof activity before a re-lease. As Moose does not have discrete releases, it is impos-sible to draw this kind of conclusion for its mailing list.
When we compared the activity in the repositories, we observed that Python and Moose share a similarity; their development slowed down at a certain point in time. For Moose, this point is February 2007. We do not know what happened and interviewing the maintainers of the project did not shed the light on this activity drop. Python development activity was intense between version 1.6 and version 2.3. Af-ter this release, the activity decreased. Both Python and Dru-pal development see a peak of activity before each release. 4.2 Power law behaviour
An interesting type of behaviour we observed, and which seems to be confirmed by other researchers as well [Madey et al. 2002] is that open source software development has a power-law behaviour. We observed this, for example, in Figure 8, but the same kind of behaviour was observed as well for the other studied systems. Developers are commu-nicating frequently with a small set of other developers, and only occasionally with the majority of the other developers. A deeper statistical analysis and understanding of this phe-nomenon, as well as its impact to OSS development is a topic of future research.
4.3 Working hours
After analysing the visualisations of mailing list usage of the three studied systems, a recurrent pattern emerges. As can be expected, the developers are mostly communicating during the day and in the evening. In the base of Python and Moose,
10http://www.iam.unibe.ch/pipermail/moose-dev/
developers do not stop talking during weekends; they just slow down their activity. This is not the case with Drupal: its most active day is Sunday.
One difference between Moose and the two other projects is the fact that it is more quiet during holidays while it is the exact opposite for the two others. The academic nature of Moose may explain this phenomenon.
All the repositories show that open source developers continue to work outside office hours. Moose is the only project for which the activity decreases in the evening, Dru-pal and Python see the exact opposite: people are working in the evening.
4.4 Projects sustainability
The problem affecting both Drupal and Python is the fact that they are led by a single individual who oversees the de-velopment and guides the project. This is commonly known as the so-calledbus factor, i.e., the total number of key de-velopers that would, if incapacitated (e.g., by getting hit by a bus), lead to a major disruption of the project. For Python, it is easy to observe this bus factor behaviour, by looking at the Maispion visualisations shown in Figures 9 and 10. They show that there is one extremely active developer, both in terms of commits and e-mails sent. A similar behaviour can be found for Drupal, where its founder continues to be the most active person.11
Fortunately, both projects are well documented and are widely used throughout the world; they are thus sustain-able on the technical side. But leadership and vision are two important success factors of these projects. Moose is well known by a relatively large community of academics who have built tools on top of it, its bus factor is thus relatively high. However, all those satellite tools are much less sustain-able: they are typically developed by one or two students for a thesis or to support a paper.
5.
Conclusions and Future Work
This document introduced Maispion, a Smalltalk tool for analysing and visualising open source software developer communities. We showed how these visualisations can be applied in practice by analysing three mature open source projects. We have found some interesting communication patterns for these projects, but clearly more work is needed to explore these patterns in more detail, to explain why they appear, and to verify whether other open-source projects reveal similar patterns.
The visualisations provided by Maispion are subject to improvement. For example, the visualisations of commiter activity (Figure 6) or e-mail usage (Figure 7) do not take into account the frequency of activity over time. An improvement of this visualisation could reveal this information to better
11The visualisations that reveal this have not been included in this paper
explain the concurrent use of e-mail addresses of a same individual.
The information about working hours that we derived from the version repository data is based on the timestamp of commits in the version repository server. This may lead to a significant lack of accuracy when developers working on the open source software project reside in different time zones. For example, because Python has developers working in US, Canada and Europe, the aggregated results about working hours may not be very reliable. We could automatically de-tect the timezone of an individual based on his e-email us-age: e-mail headers often includes the timezone from which the e-mail was sent. Unfortunately, e-mail clients are incon-sistent with this field of the header. The mobility of devel-opers is another problem: they can commit code while they are travelling (if they go to a conference for example) or can move to another country.
In our current study of how software developer teams communicate and what we can learn from that, we have only used information obtained from mailing list and source code version repositories. A natural extension of our work would be to integrate bug tracking data and other relevant data sources as well. [Abreu and Premraj 2009] have tried to correlate developer communication (obtained from mailing lists) with software quality (expressed in terms of injected bugs in the software). In the future we intend to integrate this kind of data in our tool.
In a general sense, the various types of data extracted by our tool are amenable to statistical analysis, in order to identify certain correlations (for example, between devel-oper communication and coding activity) or to identify cer-tain evolution trends or cercer-tain kinds of patterns (such as the observed power law).
Collins-Sussman and Fitzpatrick expressed in their Google Tech Talk that some kinds of behaviour are unwelcome in open source projects [Collins-Sussman and Fitzpatrick 2007]. It would be interesting to automatically detect such undesirable behavioral withMaispion.
A final important open research question we are faced with is whether the communication patterns we typically find for open source development teams can also be observed in commercial software, and vice versa.
Acknowledgments
We acknowledge theSwiss Group for Object-Oriented
Sys-tems and Environments (CHOOSE) for offering a student
mobility grant, and Oscar Nierstrasz for his support during Franc¸ois’ research stay at theSoftware Composition Group
of Bern University.
The research reported here was carried out in the context of the Action de Recherche Concert´ee AUWB-08/12-UMH 19 funded by the Minist`ere de la Communaut´e franc¸aise - Direction g´en´erale de l’Enseignement non obligatoire et de la Recherche scientifique. We are grateful to the
Bel-gian F.R.S-F.N.R.S for partial funding through FRFC project 2.4515.09.
We also gratefully acknowledge the financial support of the Hasler Foundation for the project “Enabling the evolu-tion of J2EE applicaevolu-tions through reverse engineering and quality assurance” (Project no. 2234, Oct. 2007 – Sept. 2010)
References
R. Abreu and R. Premraj. How developer communication fre-quency relates to bug introducing changes. InProc. Joint Int’l Workshop on Software Evolution (IWPSE-EVOL), pages 153– 157. ACM SIGSOFT, 2009.
F.P. Brooks. JR.,“The Mythical Man-Month”. Essays on Software Engineering. Addison-Wesley Publishing Company, 1975. B. Collins-Sussman and B. W. Fitzpatrick. How To Protect your
Open Source Project From Poisonous People: Google TechTalk, January 2007.
T. DeMarco and T. Lister. Peopleware: productive projects and teams. Dorset House Publishing, 1987.
S. Ducasse, T. Gˆırba, and O. Nierstrasz. Moose: an agile reengi-neering environment. InProc. 10th European Software Engi-neering Conf., pages 99–102. ACM, 2005.
Tudor Gˆırba, Adrian Kuhn, Mauricio Seeberger, and St´ephane Ducasse. How developers drive software evolution. In Proceed-ings of International Workshop on Principles of Software Evo-lution (IWPSE 2005), pages 113–122. IEEE Computer Society Press, 2005. doi: 10.1109/IWPSE.2005.21.
E. Hall. The application/mbox Media Type. RFC 4155 (Informational), September 2005. URL
http://www.ietf.org/rfc/rfc4155.txt.
M. Junker and M. Hofstetter. Scripting diagrams with eyesee. Bachelor’s thesis, University of Bern, May 2007.
Mircea Lungu, Michele Lanza, Tudor Gˆırba, and Reinout Heeck. Reverse engineering super-repositories. In Proceedings of WCRE 2007 (14th Working Conference on Reverse Engi-neering), pages 120–129, Los Alamitos CA, 2007. IEEE Computer Society Press. ISBN 0-7695-3034-6. doi: 10.1109/WCRE.2007.46.
G. Madey, V. Freeh, and R. Tynan. The open source software development phenomenon: An analysis based on social network theory. In Eight Americas Conf. Information Systems, pages 1806–1813, 2002.
M. Meyer. Scripting interactive visualizations. Master’s thesis, University of Bern, November 2006.
A. Mockus, R. T. Fielding, and J. D. Herbsleb. Two case studies of open source software development: Apache and Mozilla. ACM Trans. Softw. Eng. Methodol., 11(3):309–346, 2002. ISSN 1049-331X.
K. Nakakoji, Y. Yamamoto, Y. Nishinaka, K. Kishida, and Y. Ye. Evolution patterns of open-source software systems and commu-nities. InProc. Int’l Workshop on Principles of Software Evolu-tion (IWPSE), pages 76–85. ACM, 2002.
G. Navarro. A Guided Tour to Approximate String Matching.ACM Computing Surveys, 33(1):31–88, 2001.
M. Seeberger, A. Kuhn, T. Girba, and S. Ducasse. Chronia: Visu-alizing how developers change software systems. InEuropean Conf. Software Maintenance and Reengineering, 2006. F. Stephany. On the analysis of communication patterns in open
source software development. Master’s thesis, Universit´e de Mons, 2009.