This is a repository copy of
Integrating slacks-based measure of efficiency and
super-efficiency in data envelopment analysis
.
White Rose Research Online URL for this paper:
http://eprints.whiterose.ac.uk/139053/
Version: Accepted Version
Article:
Tran, T.H., Mao, Y., Nathanail, P. et al. (2 more authors) (2018) Integrating slacks-based
measure of efficiency and super-efficiency in data envelopment analysis. Omega. ISSN
0305-0483
https://doi.org/10.1016/j.omega.2018.06.008
Article available under the terms of the CC-BY-NC-ND licence
(https://creativecommons.org/licenses/by-nc-nd/4.0/).
[email protected] Reuse
This article is distributed under the terms of the Creative Commons Attribution-NonCommercial-NoDerivs (CC BY-NC-ND) licence. This licence only allows you to download this work and share it with others as long as you credit the authors, but you can’t change the article in any way or use it commercially. More
information and the full terms of the licence here: https://creativecommons.org/licenses/
Takedown
If you consider content in White Rose Research Online to be in breach of UK law, please notify us by
Integrating Slacks-based Measure of Eciency and
Super-eciency in Data Envelopment Analysis
Trung Hieu Tran
1∗, Yong Mao
2, Paul Nathanail
3, Peer-Olaf Siebers
4, Darren Robinson
1,51Laboratory for Urban Complexity and Sustainability, University of Nottingham, Nottingham NG7 2RB, UK 2School of Physics & Astronomy, University of Nottingham, Nottingham NG7 2RD, UK
3School of Geography, University of Nottingham, Nottingham NG7 2RD, UK 4School of Computer Science, University of Nottingham, Nottingham NG8 1BB, UK
5School of Architecture, The University of Sheeld, Sheeld S10 2TN, UK
Abstract
In this paper, we develop an integrated model for slacks-based measure (SBM) simultaneously of both the eciency and the super-eciency for decision-making units (DMUs) in data envelopment analysis (DEA). Unlike the traditional solution approaches in which we need to identify the ecient DMUs by the SBM model of Tone [20] before applying the super SBM model of Tone [21] for the DMUs to achieve their super-eciency scores, our integration can obtain the eciency scores of the inecient DMUs and the super-eciency scores of the ecient DMUs by solving simultaneously these two models by an one-stage approach. Therefore, it may save computational time for large-scale practical applications. Due to the non-linearity in the objective function of this integrated model, we develop a linearisation technique to deal with the non-linear model. The numerical experiments, carried out on several examples in the literature and a case study, have demonstrated the accuracy and the computational time eectiveness of our proposed model as compared with the traditional solution approaches.
Keywords: data envelopment analysis (DEA); slacks-based measure; eciency; super-eciency; one-stage approach; linearisation.
1 Introduction
Data envelopment analysis (DEA) is a methodology in operations research and economics for performance evaluation and benchmarking, considering multiple performance measures. It is useful for empirically mea-suring the productive eciency of decision-making units (DMUs), for example, organisations, banks, etc. Since the rst publication of measuring the eciency of DMUs proposed by Charnes et al. [4], there has been a continuous and recently rapid growth in the eld of DEA in terms of both practical application and theory. As for the perspective of practical application for the rst 20 years of DEA development, the top ve application elds include banking, healthcare, agriculture and farming, transportation, and education
∗Correspondence author.
Email address: [email protected] (T.H. Tran).
[15]. In the recent years, while banking, agriculture and farming, and transportation have still been in the top ve application elds of DEA, supply chain and public policy have appeared as two emergent application elds of DEA. In addition, some novel DEA applications include the corporate management of securities [23], the automotives [19], tourism in the Coral Triangle region [13], the thermal power generation [18], etc. In addition to the appearance of many novel practical applications, the total number of journal articles in DEA reached 10,300 with 11,975 individuals. This demonstrates the increasingly important role of DEA applications in both public and private sectors. Emrouznejad and Yang [9] provide a comprehensive survey and analysis of the rst 40 years of DEA related studies.
In DEA, since the eciency of a DMU is dened as the ratio of multiple inputs and outputs, the objective of DMU is the utilisation of minimum inputs to produce maximum outputs. Obviously, a DMU is known to be more ecient than other DMU if it uses the same amount of inputs to produce more outputs, or a lesser amount of inputs to produce the same outputs. In the literature, there are two approaches to evaluate the performance of DMUs, i.e., the measure of eciency and the measure of super-eciency. Both approaches can distinguish the sets of inecient DMUs and ecient DMUs. However, the former approach only gauges the scores of inecient DMUs (i.e., values range from 0 to 1), while the latter approach only gauges the scores of ecient DMUs (i.e., values are greater than 1).
As for the perspective of theory in the measure of eciency, several DEA models have been constructed to overcome the shortcomings of the rst DEA model [4]. In the rst model, a DMU with the eciency score equal to one might be inecient since it could not account for all eciency components of a DMU [16] (known as radial eciency measure). Banker et al. [3] proposed an input-oriented model to evaluate the eciency of a DMU by solving a linear program with a new separate variable which is the dual variable associated with the constraint of returns to scale. It is possible to determine whether operations are conducted in regions of increasing, constant or decreasing returns to scale in the multiple input and multiple output situations. While the above-mentioned models require to distinguish between input-oriented and output-oriented objective functions, Charnes et al. [5] developed an additive model to measure the eciency of a DMU based on considering the total slacks of inputs and outputs simultaneously in arriving at a point on the ecient frontier that are constructed by a set of ecient DMUs. The additive model can account for all ineciency components of a DMU that the previous models could not. Therefore, if a DMU possesses zero slacks, it is ecient. However, this additive model does not provide directly an eciency measure in the objective function. Tone [20] augmented the additive model by introducing a slacks-based measure (SBM), in which the slack variables represent excesses in inputs and shortfalls in outputs, to identify directly the eciency score of a DMU in the objective function. In the SBM model, a DMU with eciency score equal to one is strongly ecient (known as a representative of non-radial eciency measures). For a survey of methodological development of the various models for measuring eciency, readers can refer to [10] and [7]. As for the perspective of theory in the measure of super-eciency, Andersen and Petersen [1] proposed a radial super-eciency model to measure the scores of the ecient DMUs while remaining unchanged the scores of the inecient DMUs. This model can dierentiate the ecient DMUs that the traditional DEA models above-mentioned can not. However, such the super-eciency model is mainly applicable for constant returns to scale (CRS) since it may be infeasible as variable returns to scale (VRS) is used [17, 6, 14]. Unlike the model of Andersen and Petersen [1] based on the radial super-eciency measure approach, Tone [21] developed a super SBM model with non-radial super-eciency measure (i.e., dealing with input/output slacks directly) to dierentiate the ecient DMUs. This model is useful if the number of DMUs is small as compared with the number of evaluation criteria. Fang et al. [11] constructed a two-stage solution approach
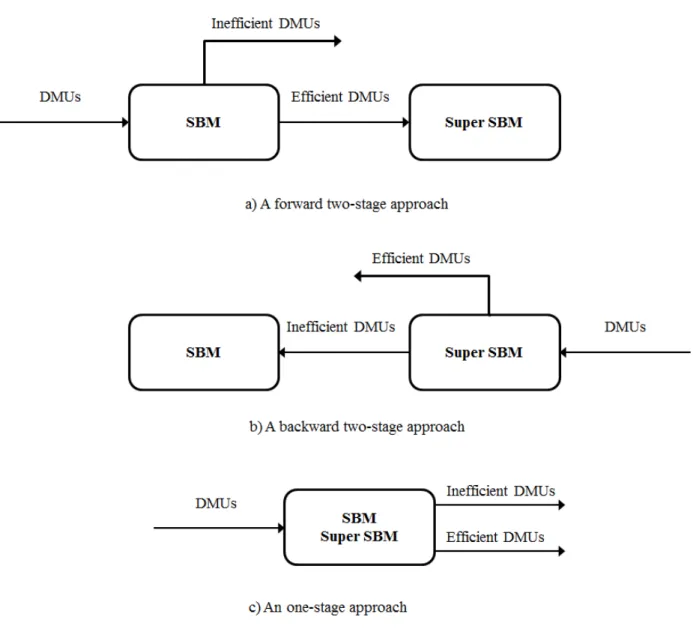
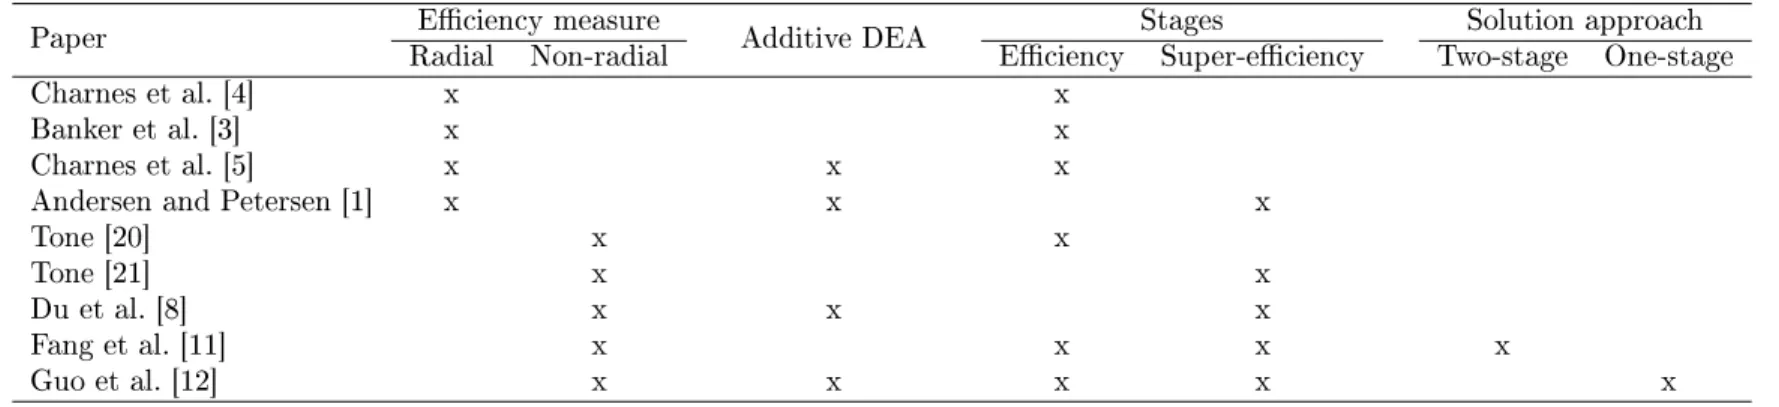
for determining the super-eciency scores of the ecient DMUs and the eciency scores of the inecient DMUs. In the approach, the super SBM model is solved rst and then the SBM model is applied. The authors show that the results obtained can bring a stronger Pareto ecient projection than the super SBM model, while the eciency scores of DMUs remain unchanged as compared with those of [20] and [21]. Du et al. [8] extended the super SBM model of Tone [21] to the additive (slacks-based) DEA model. Unlike the traditional radial super-eciency DEA models, this model is always feasible under VRS condition. As a result, a complete ranking of the ecient DMUs can be obtained. However, the authors use dierent slacks-based objective functions in their model. Thus, a post-computation process is required to obtain the eciency scores of DMUs. In addition, the model requires the set of ecient DMUs to be determined before applying the additive super-eciency model to measure the eciency scores of the DMUs, which may be overly time-consuming in the implementation of large-scale practical applications. Therefore, Guo et al. [12] have recently proposed an integration of the additive (slacks-based) DEA models for determining the eciency scores of the inecient DMUs and the super-eciency scores of the ecient DMUs by solving an one-stage model. The one-stage solution approach can save computational time for large-scale practical applications, for example, computing the SBM-based Malmquist productivity index used to evaluate the eciency change over time [22]. In addition, the projections identied by the model are strongly ecient. However, like the model of Du et al. [8], the integrated model requires potentially time-consuming post-computation to obtain the eciency scores of DMUs. Table 1 summaries the development of the above-mentioned DEA models with their properties. In the table, we can see that the one-stage solution approach based on the SBM and super SBM models with an objective function that can directly measure the eciency and super-eciency scores of DMUs has not been studied.
We have developed an integration of the SBM [20] and super SBM [21] models to be able to directly obtain the eciency scores of the inecient DMUs and the super-eciency scores of the ecient DMUs by solving one-stage model (see Figure 1). Like the integrated model of Guo et al. [12], our model may save computational time for large-scale practical applications. In addition, since our objective function can directly determine the eciency and super-eciency scores of DMUs, it does not need a post-computation process as the model of Guo et al. [12]. This may save much computational time in the applications with the large number of DMUs. Due to the non-linearity in the objective function of our integrated model, a linearisation technique is developed to deal with the non-linear model. The linearisation technique can be easily applied for similar models in other elds. To overcome the negative or zero cases of observed input and output values in the practical applications, we propose a strategy to scale all the original input and output values. The linearised model with the scaling strategy may obtain the robustness of the relative eciency measure for DMUs. Besides that numerical experiments are carried out on several examples in the literature, we evaluate and compare our model with other models in a case study with the large number of DMUs, inputs and outputs. The main contribution in this paper is (i) a novel one-stage solution approach based on the SBM and super SBM models, (ii) a direct objective function to obtain the eciency and super-eciency scores of DMUs without the post-computation process, (iii) a linearisation technique to deal with the non-linear integrated model, (iv) a scaling strategy to handle the negative or zero cases of inputs and outputs in the real-world applications, and (v) a large-size case study to demonstrate the performance of our model. The remaining of this paper is organised as follows. Section 2 reviews the SBM model [20] and the super SBM model [21]. Section 3 presents how to integrate these two models into an one-stage model for simultaneously measuring the eciency scores of both the inecient and ecient DMUs. In this section, we also introduce the linearisation technique to deal with the non-linear integrated model, and the scaling strategy. Section 4 is the results of
Table 1: A summary of eciency and super-eciency slacks-based measure development in DEA.
Paper Radial Non-radialEciency measure Additive DEA Eciency Super-eciencyStages Two-stage One-stageSolution approach
Charnes et al. [4] x x
Banker et al. [3] x x
Charnes et al. [5] x x x
Andersen and Petersen [1] x x x
Tone [20] x x Tone [21] x x Du et al. [8] x x x Fang et al. [11] x x x x Guo et al. [12] x x x x x 5
numerical experiments to illustrate the accuracy and the computational time eectiveness of our proposed model. Finally, conclusions and future work are provided in Section 5.
2 Slacks-based Measure of Eciency and Super-eciency
The SBM model and the super SBM model proposed by Tone [20] and Tone [21] are reviewed, respectively. These models are then integrated into our one-stage model in the next section.
2.1 Slacks-based measure of eciency
Assume that we deal with a set of n DMUs in which each has m inputs and s outputs. We denote the ithe input and the rth output of DMUj by xij (i = 1, .., m; j = 1, .., n) and yrj (r = 1, .., s; j = 1, .., n),
respectively. Then, based on the SBM model of Tone [20], the eciency score of the target DMUkis evaluated
by [SBM]: min ρk= 1− 1 m m X i=1 s−i xik 1 +1 s s X r=1 s+ r yrk , (1) s.t.:xik= n X j=1 xijλj+s−i , i= 1, .., m, (2) yrk= n X j=1 yrjλj−s+r, r= 1, .., s, (3) λj ≥0, j= 1, .., n, (4) s−i ≥0, i= 1, .., m, (5) s+r ≥0, r= 1, .., s, (6) where s−i (i= 1, .., m)ands+
r (r= 1, .., s)are slacks representing input excess and output shortfall,
respec-tively; and λis a non-negative vector.
In this model, all the data of inputs and outputs are assumed to be positive, i.e., xij > 0 and yrj > 0
(i= 1, .., m; r= 1, .., s; j= 1, .., n), due to the objective function. The objective value is less than or equal to 1. We obtain ρ∗k < 1 for the inecient DMUs and ρ∗k = 1 for the ecient DMUs as solving the SBM
model.
2.2 Slacks-based measure of super-eciency
After solving the SBM model to obtain the set of ecient DMUs (i.e.,ρ∗= 1), the super SBM model proposed
by Tone [21] is applied to evaluate the ecient DMUs. For an ecient DMUk, we solve the following problem
[SupSBM]: min δk= 1 m m X i=1 ˜ xi xik 1 s s X r=1 ˜ yr yrk , (7) s.t.:x˜i≥ n X j=1,j6=k xijλj, i= 1, .., m, (8) ˜ yr≤ n X j=1,j6=k yrjλj, r= 1, .., s, (9) ˜ xi≥xik, i= 1, .., m, (10) 0≤y˜r≤yrk, r= 1, .., s, (11) λj ≥0, j= 1, .., n, j 6=k, (12)
where x˜i (i= 1, .., m)and y˜r(r= 1, .., s) are decision variables with respect to inputs and outputs,
respec-tively; while other parameters are dened as in the last section. Note that the super SBM model is the same as Tone [21], but is expressed by dierent notations, which makes identical with our one-stage model in next section.
As solving the SupSBM model for the ecient DMUs pre-identied, we obtain their super-eciency scores
δ∗
k >1. Then, the eciency and super-eciency scores of all the DMUs are determined. All these scores can
also be found by solving the SupSBM model rst and then applying the SBM model for the inecient DMUs (i.e.,δ∗
k= 1), known as the reversed (or backward) two-stage solution approach proposed by Fang et al. [11].
3 An Integration of the SBM Model and the Super SBM Model
Since our model is integrated based on the above-mentioned SBM model and the super SBM model, it inherits the properties of both models. Our projection results are similar to those of these models. In this paper, we thus do not discuss the issues, but concentrate how to build an one-stage model from these models, and how to solve the model eciently for practical applications.
3.1 An integrated model
In the section, we develop one-stage model to measure the eciency and super-eciency scores of the ine-cient and eine-cient DMUs simultaneously. Our model is based on the integration of the SBM model [20] and the super SBM model [21]. After linearising the SBM and the super SBM models as shown in [20] and [21], respectively, we integrate them into one-stage model. For any DMUk, its eciency or super-eciency score
can be evaluated by
[OneSupSBM]: min θk =α 1 m m X i=1 ˜ xi xik + (1−α) t1− 1 m m X i=1 s−i xik ! , (13) s.t.: 1 m m X i=1 ˜ xi xik −1≤αM , (14) α∈ {0; 1}, (15) 1 =t1+ 1 s s X r=1 s+ r yrk , (16) t1xik= n X j=1 xijλ1j+s−i , i= 1, .., m, (17) t1yrk= n X j=1 yrjλ1j−s + r, r= 1, .., s, (18) λ1j ≥0 (j= 1, .., n), s−i ≥0 (i= 1, .., m), s + r ≥0 (r= 1, .., s), t1>0, (19) 1 = 1 s s X r=1 ˜ yr yrk , (20) ˜ xi≥ n X j=1,j6=k λ2jxij, i= 1, .., m, (21) ˜ yr≤ n X j=1,j6=k λ2jyrj, r= 1, .., s, (22) ˜ xi≥t2xik, i= 1, .., m, (23) 0≤y˜r≤t2yrk, r= 1, .., s, (24) λ2j ≥0 (j= 1, .., n), t2>0, (25)
where M is a big positive number; λ1j and λ2j (j = 1, .., n)represent the non-negative vectors of the SBM
model and the super SBM model, respectively; and t1 andt2 are two auxiliary variables for linearisation. The objective function (13) is to measure the super-eciency score of an ecient DMU (i.e., 1
m Pm i=1 ˜ xi xik) or the eciency score of an inecient DMU (i.e.,t1−m1 P
m i=1
s− i
xik ). In the objective function, we use a binary variableα∈ {0,1} to switch the measure of eciency based on the SBM model or the super SBM model. If
α= 1, then the super SBM model is chosen to compute the super-eciency score of DMUk. Ifα= 0, then
the SBM model is chosen to compute the eciency score of DMUk. Constraints (14)-(15) are used to control
switching between the SBM model and the super SBM model. Constraints (16)-(19) are the constraints of the linearised SBM model, while constraints (20)-(25) are the constraints of the linearised super SBM model. Next, we explain why the one-stage model is able to switch automatically the SBM model and the super SBM model based on the choice of value α. Let θ1k = m1 Pmi=1
˜ xi xik and θ2k = t1− 1 m Pm i=1 s− i xik, note that θ1k ≥1andθ2k ≤1.
• Case 1: if DMUk is ecient, our integrated model has to switch into the super SBM model (i.e.,
α= 1). We can prove this as follows. Due to DMUk is ecient, it has θ∗1k >1 and θ2∗k = 1. Since
θ∗ 1k >1, it leads to 1 m Pm i=1 ˜ xi
the constraint. The objective function becomesmin θk =m1 P m i=1
˜
xi
xik. In other words, the super SBM model is selected and only constraints (20)-(25) are active to the objective function. Therefore, we can obtain as the same super-eciency score as the model of Tone [21].
• Case 2: if DMUk is inecient, our integrated model has to switch into the SBM model (i.e., α= 0).
We can prove this as follows. Due to DMUk is inecient, it has θ∗1k= 1andθ2∗k <1. Sinceθ∗1k= 1, it
leads to 1 m Pm i=1 ˜ xi
xik−1 = 0. Constraint (14) becomes0≤αM. The valueαmay be 0 or 1. Since the objective function is minimisation, the model choosesα= 0to obtain the smaller part of the objective value (θ∗
1k = 1vs. θ2∗k <1). Then , the objective function becomesmin θk=t1−m1 P
m i=1
s− i
xik. In other words, the SBM model is selected and only constraints (16)-(19) are active to the objective function. Therefore, we can obtain as the same eciency score as the model of Tone [20].
3.2 A linearised model
The objective function is a non-linear function. To be able to solve this problem, we need to develop a linearisation technique to linearise the non-linear terms (i.e., αs−i , αx˜i and αt1) of the objective function. Let ui = αs−i where0≤s
−
i ≤t1xik
,
vi = αx˜i (wherex˜i≥xik) and w = αt1 (where0< t1≤1), then replace the non-linear terms of the objective function by the new variables. We can linearise the objective function (13) by min θk = 1 m m X i=1 ui xik + 1 m m X i=1 vi xik −w+t1− 1 m m X i=1 s−i xik , (26) s.t.:ui≤αt1xik, i= 1, .., m, (27) ui≤s−i , i= 1, .., m, (28) ui≥s−i −(1−α)t1xik, i= 1, .., m, (29) ui≥0, i= 1, .., m, (30) xikα≤vi ≤M α, i= 1, .., m, (31) ˜ xi−(1−α)M ≤vi≤x˜i−(1−α)xik, i= 1, .., m, (32) M α≤w≤α, (33) t1−(1−α)≤w≤t1−(1−α)M , (34)
where M andM are the small and big positive numbers, respectively.
Constraints (27)-(30) are used to linearise the non-linear termαs−i , constraints(31)-(32)are used to linearise
the non-linear termαx˜i, and constraints (33)-(34)are used to linearise the non-linear termαt1.
Next, we explain why constraints (27)-(30) can linearise αs−i . Similar explanations can be applied for the
other non-linear terms.
• Case 1: ifα= 0, thenαs−i = 0. We need to prove that constraints (27)-(30) can lead the same result, i.e.,ui= 0. We can see that if α= 0, then constraint (27): ui ≤0. From constraint (30): ui≥0, we
obtainui= 0. Constraints (28)-(29) satisfy withui = 0since0≤s−i ≤t1xik.
• Case 2: ifα= 1, thenαs−i =s−i . We need to prove that constraints (27)-(30) can lead the same result,
i.e.,ui=s−i . We can see that ifα= 1, then constraint (28): ui≤s−i and constraint (29): ui≥s−i lead
toui=s−i . Constraints (27): ui≤t1xik and constraint (30): ui ≥0 are satised since0≤s−i ≤t1xik.
Note that by replacingw=αt1in constraints (27) and (29), we obtain the full mixed-integer linear
program-ming (MILP) formulation of our one-stage model for measuring the eciency scores of the ecient DMUs and the super-eciency scores of the inecient DMUs as follows.
[OneSupSBM-LP]: min θk = 1 m m X i=1 ui xik + 1 m m X i=1 vi xik −w+t1− 1 m m X i=1 s−i xik , (35) s.t.: 1 m m X i=1 ˜ xi xik −1≤αM , (36) α∈ {0; 1}, (37) 1 =t1+ 1 s s X r=1 s+ r yrk , (38) t1xik= n X j=1 xijλ1j+s−i , i= 1, .., m, (39) t1yrk= n X j=1 yrjλ1j−s+r, r= 1, .., s, (40) λ1j ≥0 (j= 1, .., n), s−i ≥0 (i= 1, .., m), s + r ≥0 (r= 1, .., s), t1>0, (41) 1 = 1 s s X r=1 ˜ yr yrk , (42) ˜ xi≥ n X j=1,j6=k λ2jxij, i= 1, .., m, (43) ˜ yr≤ n X j=1,j6=k λ2jyrj, r= 1, .., s, (44) ˜ xi≥t2xik, i= 1, .., m, (45) 0≤y˜r≤t2yrk, r= 1, .., s, (46) λ2j ≥0 (j= 1, .., n), t2>0, (47) ui≤wxik, i= 1, .., m, (48) ui≤s−i , i= 1, .., m, (49) ui≥s−i −(t1−w)xik, i= 1, .., m, (50) ui≥0, i= 1, .., m, (51) xikα≤vi ≤M α, i= 1, .., m, (52) ˜ xi−(1−α)M ≤vi≤x˜i−(1−α)xik, i= 1, .., m, (53) M α≤w≤α, (54) t1−(1−α)≤w≤t1−(1−α)M . (55)
Then, it is solvable by any commercial MILP solver.
AP) using the super-eciency model for ranking ecient observations is not very useful, but is more useful in outlier detection. In the case of existing of outliers for super-eciency measurement, we can thus apply the AP procedure to detect and remove the outliers before using our one-stage approach.
3.3 A scaling strategy
Due to the assumption of positive data in the SBM model (i.e., xij >0 and yrj >0), Tone [20] proposed
an approach to deal with zero and negative data. In particular, if there are zero elements in input data, the corresponding slack variabless−i can be neglected. For zero elements in output data, the author classies into
two cases: (i) if the target DMU does not have a function to produce the output, the corresponding variables
s+
r can be removed from the objective function, (ii) if the target DMU has a potential function to produce
the output but does not utilise it, the zero output value can be replaced by a small positive number or one tenth of the minimum positive output value. The approach for zeros in output data can also be applied to deal with the negative output data.
Although the approach can deal with zero and negative data in the SBM models, its applicability to real world problems is not really ecient. For example, we consider two DMUs with the signicant dierence of negative output values (e.g., -1,000 and -10). When the approach is applied, these two DMUs obtain the same scaled output value. It means that they have the same contribution of relative eciency score with respect to the output. This is not true in practice. Therefore, the dierence of scaled output values may aect to the accuracy of relative eciency measure of DMUs. In addition, inputs and outputs with large values may have more impact on the measure of relative eciency than those with small values.
To overcome the disadvantages, we propose a new scaling strategy in which the obtained values of inputs and outputs are scalar in a range of 1-101. Let Ximin and Ximax be the minimum and maximum values of ith input, respectively. We denote the current input value and the scaled input value byXicurrent andXiscale,
respectively. We can compute the scaled input value by
Xiscale= Xicurrent−Ximin 100 Ximax−Ximin + 1. (56)
Similarly, we can apply it for computing the scaled output values. We then obtain the scaled data set of inputs and outputs that include the impact of magnitude. Hence, the strategy is ecient to solve real world problems.
4 Numerical Experiments
In the section, we investigate the computational ecacy of measuring the eciency scores of DMUs by our one-stage model. We evaluate the performance of the proposed model on several datasets in the literature and a case study. The obtained results are compared with those from other models, such as Tone [20, 21], Guo et al. [12]. All these models, including ones used to make a comparison, were implemented in Visual C++ and run on the same Microsoft Windows 7 Enterprise PC with an Intel Core i3-6100 Processor 2.30 GHz and 8 GB of RAM. The models were built and solved using the MILP solver of the IBM ILOG CPLEX version 12.4 callable library.
Table 2: A dataset of 5 DMUs (2 inputs, 2 outputs) in Tone [20]. DMU x1 x2 y1 y2 A 4 3 2 3 B 6 3 2 3 C 8 1 6 2 D 8 1 6 1 E 2 4 1 4
Table 3: A dataset of 7 DMUs (2 inputs, 1 output) in Tone [21]. DMU x1 x2 y1 A 4 3 1 B 7 3 1 C 8 1 1 D 4 2 1 E 2 4 1 F 10 1 1 G 12 1 1
In the numerical experiments, the parameter values of our model were chosen as follows: M = 0.0001 and
M = 10,000; whileǫ= 0.0001was used for the model of Guo et al. [12].
4.1 Benchmark datasets
Tables 2-4 present the datasets in the literature that are used to evaluate and compare our model with other models. In particular, they include the dataset of 5 DMUs (2 inputs, 2 outputs) in [20], the dataset of 7 DMUs (2 inputs, 1 output) in [21], and the dataset of 6 DMUs (4 inputs, 2 outputs) in [21].
We solved the datasets by the SBM model of Tone [20], the super SBM model of Tone [21], the one-stage model of Guo et al. [12] and our proposed model. Since our model is integrated based on the SBM and super SBM models, we rst make a comparison with these two models to verify the accuracy of our model and linearisation technique. The obtained results are then compared with those of Guo et al. [12] to demonstrate the eectiveness of our proposed model. The comparison is based on both the solution quality and the computational time.
Tables 5 and 6 present the computational results for the dataset of 5 DMUs with 2 inputs and 2 outputs (see Table 2) solved by the models in 20, 21 and our model, respectively. The results show that our model can simultaneously obtain the eciency scores of the inecient DMUs and the super-eciency scores of the ecient DMUs. As described in Section 3, if the SBM model is chosen to evaluate the target DMU Table 4: A dataset of 6 DMUs (4 inputs, 2 outputs) in Tone [21].
DMU x1 x2 x3 x4 y1 y2 D1 80 600 54 8 90 5 D2 65 200 97 1 58 1 D3 83 400 72 4 60 7 D4 40 1,000 75 7 80 10 D5 52 600 20 3 72 8 D6 94 700 36 5 96 6
Table 5: Results of the SBM model and the SupSBM model for the dataset of Table 2. DMU SBM SupSBM s−∗1k s −∗ 2k s +∗ 1k s +∗ 2k ρ∗k x˜∗1 x˜2∗ y˜∗1 y˜∗2 δk∗ A 0 0.303 0.6061 0 0.798 4 3 2 3 1 B 0 0.4091 1.455 0 0.5682 6 3 2 3 1 C 0 0 0 0 1 10.67 1.333 8 1.333 1.333 D 0 0 0 0.6667 0.6667 8 1 6 1 1 E 0 0 0 0 1 2.909 5.818 1.455 2.182 1.455
Table 6: Results of our one-stage model for the dataset of Table 2.
DMU s−∗ OneSupSBM 1k s −∗ 2k s +∗ 1k s +∗ 2k x˜∗1 x˜∗2 y˜1∗ y˜2∗ θ∗k A 0 0.303 0.6061 0 - - - - 0.798 B 0 0.4091 1.455 0 - - - - 0.5682 C - - - - 10.67 1.333 8 1.333 1.333 D 0 0 0 0.6667 - - - - 0.6667 E - - - - 2.909 5.818 1.455 2.182 1.455
(assuming that it is an inecient DMU), the variable values corresponding in the SupSBM model are arbitrary. Otherwise, if the SupSBM model is chosen to evaluate the target DMU (assuming that it is an ecient DMU), the variables values corresponding in the SBM model are arbitrary. Hence, we do not present the arbitrary values of these variables in the result tables. In the tables, the scores and slacks are the same as those obtained by solving sequentially the SBM and super SBM models. It demonstrates the accuracy of our integrated model and linearisation technique.
We continue to solve the datasets of Tables 3 and 4 by these models, and present the computational results in Tables 7-8 and 9-10, respectively. Once again, we can see that the proposed model can obtain the same results as the models of Tone [20] and Tone [21]. In this paper, we do not discuss the projection results of the datasets since they are the same as in [20] and [21].
Next, we make a comparison among our proposed model, the two-stage approach (i.e., solving the SBM rst and then the SupSBM, namely SBM-SupSBM) and the one-stage model of Guo et al. [12] in additive DEA on the benchmark datasets (see in Tables 11). The comparison is based on both the solution quality and the computational time in seconds. The comparison results show that our model can obtain the same eciency scores of DMUs as the two-stage approach (thus the eciency scores of SBM-SupSBM are not reported in the tables), but less computational time. As compared with the one-stage model of Guo et al. [12], our model Table 7: Results of the SBM model and the SupSBM model for the dataset of Table 3.
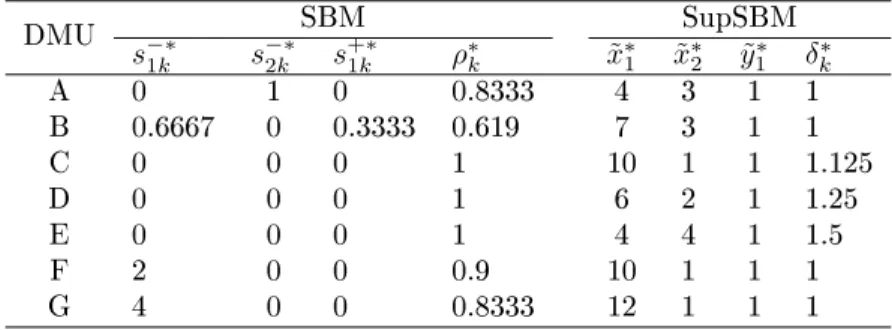
DMU SBM SupSBM s−∗1k s −∗ 2k s +∗ 1k ρ∗k x˜∗1 x˜∗2 y˜1∗ δk∗ A 0 1 0 0.8333 4 3 1 1 B 0.6667 0 0.3333 0.619 7 3 1 1 C 0 0 0 1 10 1 1 1.125 D 0 0 0 1 6 2 1 1.25 E 0 0 0 1 4 4 1 1.5 F 2 0 0 0.9 10 1 1 1 G 4 0 0 0.8333 12 1 1 1 13
Table 8: Results of our one-stage model for the dataset of Table 3. DMU OneSupSBM s−∗1k s −∗ 2k s +∗ 1k x˜∗1 x˜∗2 y˜∗1 θ∗k A 0 1 0 - - - 0.8333 B 0.6667 0 0.3333 - - - 0.6190 C - - - 10 1 1 1.125 D - - - 6 2 1 1.25 E - - - 4 4 1 1.5 F 2 0 0 - - - 0.9 G 4 0 0 - - - 0.8333
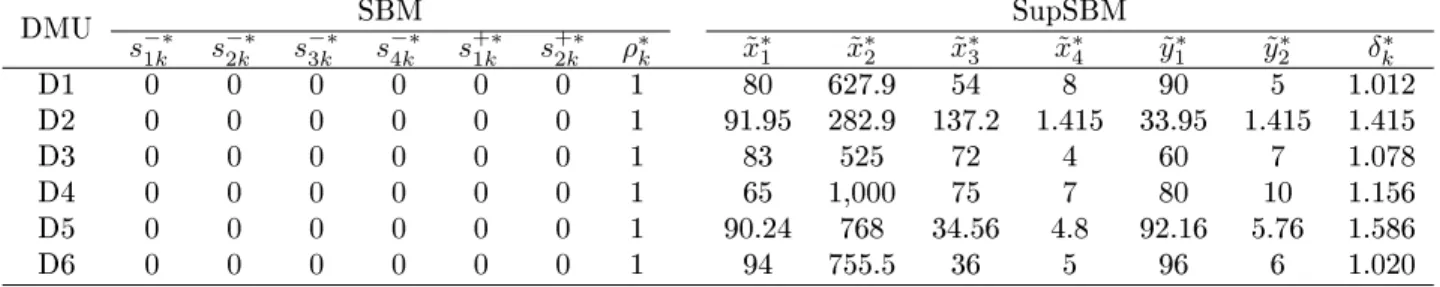
Table 9: Results of the SBM model and the SupSBM model for the dataset of Table 4.
DMU s−∗ SBM SupSBM 1k s −∗ 2k s −∗ 3k s −∗ 4k s +∗ 1k s +∗ 2k ρ∗k x˜∗1 x˜∗2 x˜3∗ x˜∗4 y˜∗1 y˜∗2 δk∗ D1 0 0 0 0 0 0 1 80 627.9 54 8 90 5 1.012 D2 0 0 0 0 0 0 1 91.95 282.9 137.2 1.415 33.95 1.415 1.415 D3 0 0 0 0 0 0 1 83 525 72 4 60 7 1.078 D4 0 0 0 0 0 0 1 65 1,000 75 7 80 10 1.156 D5 0 0 0 0 0 0 1 90.24 768 34.56 4.8 92.16 5.76 1.586 D6 0 0 0 0 0 0 1 94 755.5 36 5 96 6 1.020
Table 10: Results of our one-stage model for the dataset of Table 4.
DMU OneSupSBM s−∗1k s −∗ 2k s −∗ 3k s −∗ 4k s +∗ 1k s +∗ 2k x˜∗1 x˜∗2 x˜∗3 x˜∗4 y˜1∗ y˜2∗ θk∗ D1 - - - 80 627.9 54 8 90 5 1.012 D2 - - - 91.95 282.9 137.2 1.415 33.95 1.415 1.415 D3 - - - 83 525 72 4 60 7 1.078 D4 - - - 65 1,000 75 7 80 10 1.156 D5 - - - 90.24 768 34.56 4.8 92.16 5.76 1.586 D6 - - - 94 755.5 36 5 96 6 1.020
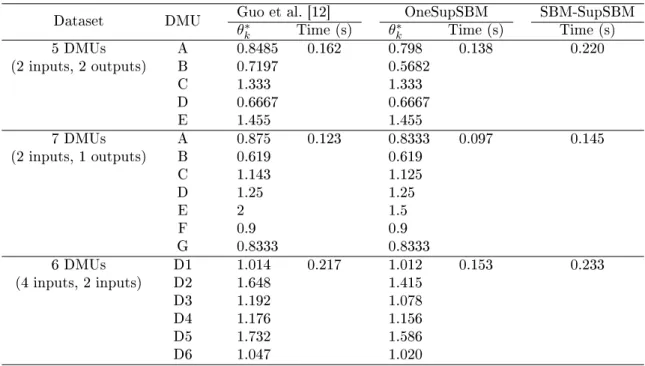
Table 11: Comparison results of the SBM-SupSBM model, our model and that of Guo et al. [12] for the small-size datasets.
Dataset DMU Guo et al. [12] OneSupSBM SBM-SupSBM
θ∗k Time (s) θ∗k Time (s) Time (s)
5 DMUs A 0.8485 0.162 0.798 0.138 0.220 (2 inputs, 2 outputs) B 0.7197 0.5682 C 1.333 1.333 D 0.6667 0.6667 E 1.455 1.455 7 DMUs A 0.875 0.123 0.8333 0.097 0.145 (2 inputs, 1 outputs) B 0.619 0.619 C 1.143 1.125 D 1.25 1.25 E 2 1.5 F 0.9 0.9 G 0.8333 0.8333 6 DMUs D1 1.014 0.217 1.012 0.153 0.233 (4 inputs, 2 inputs) D2 1.648 1.415 D3 1.192 1.078 D4 1.176 1.156 D5 1.732 1.586 D6 1.047 1.020
achieves the eciency scores of DMUs less than or equal to those of the one-stage model, which veries the fact that SBM models produce the more precisely eciency scores than the additive (slacks-based) DEA models. In addition, our computation time is less than that of Guo et al. [12]. All these show the eectiveness of our model as compared with other models for solving the benchmark datasets.
4.2 A case study
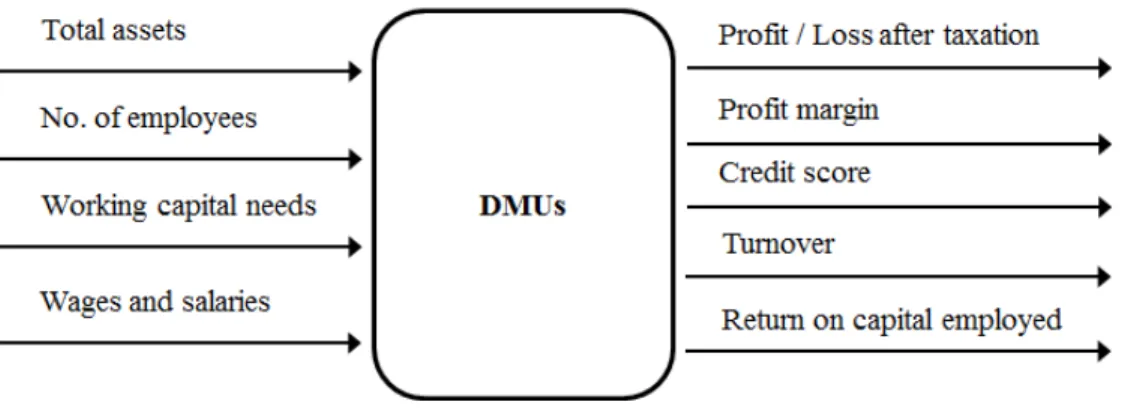
We describe a case study used to test the performance of our model and other models in practical applications. In the case study, DMUs are construction companies in Nottingham City, the United Kingdom. For DMUs, we consider the following inputs and outputs for eciency evaluation in terms of nancial performance indicator (see Figure 2):
• Inputs: total assetsx1(thousand GBP), the number of employeesx2(persons), working capital needs
x3 (thousand GBP), wages and salariesx4 (thousand GBP).
• Outputs: prot/loss after taxationy1 (thousand GBP), prot marginy2(%), credit scorey3 (0-100), turnovery4 (thousand GBP), return on capital employedy5(%).
The evaluation of DMUs gives us a general overview of relative nancial performance indicator of construction companies in Nottingham City in the United Kingdom. We can determine the set of inecient construction companies and the relevant elements that cause their ineciency. From that, these companies may focus on dealing with the reasons for the improvement of their eciency. Appendix A shows the scaled inputs and outputs of DMUs in the case study.
Figure 2: Inputs and outputs of DMUs in the case study.
We continue to solve the case study by our model, the SBM-SupSBM model and that of Guo et al. [12]. Figure 3 shows that our model can achieve the eciency scores of DMUs less than or equal to those of the model proposed by Guo et al. [12] (since the SBM-SupSBM model has the same eciency scores of DMUs as our model, we do not report them in the gure). Once again, this veries the fact that the eciency scores obtained by SBM models are more precisely than those of the additive (slacks-based) DEA models. The computation time of our model (0.753 seconds) is faster than that of the SBM-SupSBM model (1.148 seconds) and that of Guo et al. [12] (1.404 seconds), which demonstrates the applicability of our model for solving large-size instances.
As considering the practical aspect for the case study, it can be seen that 22 out of 51 construction companies (approximately 43.14%) in Nottingham City are evaluated to be ecient, in terms of the nancial performance indicator, while 29 remaining companies (approximately 56.86%) are inecient. The average score of the nancial performance indicator for all the companies is 0.73 and the standard deviation is 0.49. In general, the gures show that many construction companies in Nottingham City might be operating less eectively, and there exists a signicant dierence between the groups of ecient and inecient companies. Investigating top three companies with the lowest nancial performance indicator (i.e., C10, C42 and C47), it can be seen that (i) C10 may signicantly improve its score if it may increase the outputs (e.g., prot/loss after taxation and return on capital employed), (ii) C42 should cut working capital needs, and increase credit score to improve its score, and (iii) C47 must cut the number of employees, working capital needs, wages and salaries, and increase prot margin to improve its score.
5 Conclusions and Future Work
The traditional solution approaches in DEA require identication of the ecient DMUs before applying the super-eciency DEA models for the DMUs to achieve their super-eciency scores, and vice versa. Therefore, the approaches entail a relatively high computational cost to obtain the scores of all DMUs, especially in large-scale practical applications. Guo et al. [12] proposed the one-stage solution approach in which two eciency and supper-eciency measure models are integrated into a single model. However, this is an integrated additive (slacks-based) DEA model that requires a post-computation process to obtain the eciency scores of DMUs. We have developed an integrated model of the SBM model of Tone [20] and the super SBM model of Tone [21]. Our objective function can directly obtain the eciency and super-eciency scores of DMUs without the post-computation process. We also construct a linearisation technique to deal with the resulted non-linear integrated model. In addition, a scaling strategy that includes impact of magnitude in inputs and outputs is developed to address the negative and zero cases of inputs and outputs in the practical applications. A case study, along with several examples in the literature, are constructed to evaluate the proposed model. The experimental results demonstrate the accuracy and the computation time eectiveness of our model as compared with other models. The idea of switching the SBM model and the super SBM model, along with the proposed linearisation technique, can be easily applied in other elds.
In the case study, our focus is exclusively on rms' nancial functioning. However, we can include in-puts/outputs relevant to environmental and social aspects (e.g., CO2 emission, waste management, etc.) for a more realistic application. In addition, since using uniform weights for inputs and outputs may be unrealis-tic, we should engage with stakeholders (e.g., city council) to obtain the appropriate weights by multi-criteria decision analysis. We may also enrich the methodology to represent rm's responses to policy measures.
Acknowledgment
The authors would like to thank the Editor and the two anonymous reviewers for their valuable and construc-tive comments on the paper. The authors would also like to be thankful toDr Gavin Long for providing the data of the case study and other colleagues in Laboratory for Urban Complexity and Sustainability, Univer-sity of Nottingham, for the useful discussion. This work has been funded under the research programme grant Sustaining Urban Habitats An Interdisciplinary Approach by the Leverhulme Trust RP-2013-SL-015.
References
[1] P. Andersen and N.C. Petersen. A procedure for ranking ecient units in data envelopment analysis. Management Science, 39(10):12611264, 1993.
[2] R.D. Banker and H. Chang. The super-eciency procedure for outlier identication, not for ranking ecient units. European Journal of Operational Research, 175(2):1311 1320, 2006.
[3] R.D. Banker, A. Charnes, and W.W. Cooper. Some models for estimating technical and scale inecien-cies in data envelopment analysis. Management Science, 30(9):10781092, 1984.
[4] A. Charnes, W.W. Cooper, and E. Rhodes. Measuring the eciency of decision making units. European Journal of Operational Research, 2(6):429 444, 1978.
[5] A. Charnes, W.W. Cooper, B. Golany, L. Seiford, and J. Stutz. Foundations of data envelopment analysis for Pareto-Koopmans ecient empirical production functions. Journal of Econometrics, 30(1):91 107, 1985.
[6] Y. Chen. Measuring super-eciency in DEA in the presence of infeasibility. European Journal of Operational Research, 161(2):545 551, 2005.
[7] W.D. Cook and L.M. Seiford. Data envelopment analysis (DEA) - Thirty years on. European Journal of Operational Research, 192(1):1 17, 2009.
[8] J. Du, L. Liang, and J. Zhu. A slacks-based measure of super-eciency in data envelopment analysis: A comment. European Journal of Operational Research, 204(3):694 697, 2010.
[9] A. Emrouznejad and G.L. Yang. A survey and analysis of the rst 40 years of scholarly literature in DEA: 1978-2016. Socio-Economic Planning Sciences, 2017.
[10] A. Emrouznejad, B.R. Parker, and G. Tavares. Evaluation of research in eciency and productivity: A survey and analysis of the rst 30 years of scholarly literature in DEA. Socio-Economic Planning Sciences, 42(3):151 157, 2008.
[11] H.H. Fang, H.S. Lee, S.N. Hwang, and C.C. Chung. A slacks-based measure of super-eciency in data envelopment analysis: An alternative approach. Omega, 41(4):731 734, 2013.
[12] I.L. Guo, H.S. Lee, and D. Lee. An integrated model for slack-based measure of super-eciency in additive DEA. Omega, 67:160 167, 2017.
[13] Y. Huang and V.R. Coelho. Sustainability performance assessment focusing on coral reef protection by the tourism industry in the Coral Triangle region. Tourism Management, 59:510 527, 2017.
[14] H.S. Lee, C.W. Chu, and J. Zhu. Super-eciency DEA in the presence of infeasibility. European Journal of Operational Research, 212(1):141 147, 2011.
[15] J.S. Liu, L.Y.Y. Lu, W.M. Lu, and B.J.Y. Lin. A survey of DEA applications. Omega, 41(5):893 902, 2013.
[16] H. Morita, K. Hirokawa, and J. Zhu. A slack-based measure of eciency in context-dependent data envelopment analysis. Omega, 33(4):357 362, 2005.
[17] L.M. Seiford and J. Zhu. Infeasibility of super-eciency data envelopment analysis models. INFOR: Information Systems and Operational Research, 37(2):174187, 1999.
[18] W. Song, G.B. Bi, J. Wu, and F. Yang. What are the eects of dierent tax policies on China's coal-red power generation industry? An empirical research from a network slacks-based measure perspective. Journal of Cleaner Production, 142:2816 2827, 2017.
[19] Y. Tan, Y. Zhang, and R. Khodaverdi. Service performance evaluation using data envelopment analysis and balance scorecard approach: An application to automotive industry. Annals of Operations Research, 248(1):449470, 2017.
[20] K. Tone. A slacks-based measure of eciency in data envelopment analysis. European Journal of Operational Research, 130(3):498 509, 2001.
[21] K. Tone. A slacks-based measure of super-eciency in data envelopment analysis. European Journal of Operational Research, 143(1):32 41, 2002.
[22] K. Tone. Malmquist Productivity Index, pages 203227. Springer US, Boston, MA, 2004. ISBN 978-1-4020-7798-2.
[23] N. Zhu, Y. Liu, A. Emrouznejad, and Q. Huang. An allocation Malmquist index with an application in the China securities industry. Operational Research, 17(2):669691, Jul 2017.
![Table 3: A dataset of 7 DMUs (2 inputs, 1 output) in Tone [21].](https://thumb-us.123doks.com/thumbv2/123dok_us/507839.2559925/13.918.322.594.954.1083/table-dataset-dmus-inputs-output-tone.webp)