Analysis and Simulation of Link Performance for
Underwater Wireless Optical Communications
Longjie Zhou
1,*, Yongqun Zhu
2and Wenbin Zeng
11Research Institute Electronic Science and Technology, University of Electronic Science and Technology of China, Chengdu
611731, China
2 School of Astronautics and Aeronautics, University of Electronic Science and Technology of China, Chengdu 611731,
China
Abstract
This paper investigates how to increase communication distance of underwater wireless optical communication system. In order to analyze the communication distance of UWOC, the performance of optical transmitter and receiver, underwater channel characterization and modulation schemes were discussed. The communication link model was established based the on Beer-Lambert Law. The suitable transmitter power and the maximum communication were achieved in order to achieve communication rate to 1Mbits/s and bit error rate to 10-6 .This paper not only provides comprehensive understanding of UWOC, but also aims to provide a theoretical foundation for designing the underwater wireless optical communication system and optimizing the system parameters.
Keywords: underwater wireless optical communication, underwater channel characterization, modulation schemes, bit error rate
Received on 6 November 2017, accepted on 11 December 2017, published on 12 December 2017
Copyright © 2017 Longjie Zhou et al., licensed to EAI. This is an open access article distributed under the terms of the Creative Commons Attribution licence (http://creativecommons.org/licenses/by/3.0/), which permits unlimited use, distribution and reproduction in any medium so long as the original work is properly cited.
doi: 10.4108/eai.12-12-2017.153467
1. Introduction
Underwater wireless communication (UWC) refers to transmitting data in an unguided water environment through the use of wireless carrier, i.e. radio-frequency (RF) waves, acoustic waves and optical waves [1]. Considering the limited bandwidth of RF and acoustic, the interest towards to optical wireless communication has increased. Due to the severe attention of sea and the limited knowledge of ocean optics, the early research of underwater wireless optical communication (UWOC) was not appreciated. However, the finding of the blue-green light transmission window in water and the high bandwidth advantage made breakthroughs for UWOC. The relevant researches have proved that the attenuation of light by water results from two independent processes, absorption and scattering [2-5]. The relatively low attenuation occurs at the wavelength of blue-green light (450~570nm) [6].
*Corresponding author. Email:[email protected]
Optical communication through water has been considered as the most viable approach to provide high data rate.
Several studies have shown the demonstrations of underwater wireless communications in laboratory or experimental field. In 1992, the researchers in Naval Undersea Warfare Center proposed an optical communication system using Ar+ laser and Photomultiplier tube (PMT) which can achieve 50Mbits/s data transmission over 10m [7]. In 2000, an array of 22 LEDs and a silicon-based photodetector (PIN device) were adopted to transmit data over 5m [8].In 2008, Arnon reported an UWOC system using the green laser with the wavelength of 520nm [9].It can transmit data at 100bits/s over 120m and at 100Mbits/s over 50m .In 2015, a high-speed underwater optical communications link that operates at a data rate of 4.8Gbits/s over a distance of 5.4m has been demonstrated by scientists in Saudi Arabia and Taiwan [10]. Baghdady et al presented the direct modulation of blue laser diodes for underwater optical communication utilizing wavelength, polarization and space division multiplexing [11]. It showed an eight
channels system with a collective data rate of 10Gbits/s over 2.96m with an average BER below the FEC threshold. Although UWOC made a series of progress in bandwidth, communication distance remains as a non-ignorable constraint. The existing terrestrial free space optical channel models are not suitable for underwater environment. Therefore, a reliable channel model and relevant technologies must be proposed and studied. In order to derive channel models for UWOC system, we should understand the basic principle of optical propagation and the key technologies. UWOC system contains five key technologies, which are listed below.
High power optical signal transmitting techniques. High sensitivity weak optical signal receiving
techniques.
Modulation techniques
PAT (pointing, acquisition, tracking) techniques.
In order to extend the communication distance, the performance of optical transmitter and receiver, underwater channel characterization and modulation schemes were discussed.
The rest of the paper is organized as follows. UWOC channel model based on Beer-Lambert Law is analysed in section 2. The performance of optical transmitter and receiver are presented in section 3. The suitable modulation schemes applied in UWOC are given in section 4. Finally, several system parameters of UWOC are considered and summarized in section 5.
2. UWOC Channel Model
The optical properties of sea water are mainly influenced by the soluble or particulate matters in seawater. Statistically, there are almost 80 different matters with different concentrations. The attenuation of light by water results from two independent processes, absorption and scattering. Thus, the attenuation coefficient c
can be expressed as
c a b . (1)
Where a
is the absorption coefficient, b
is the scattering coefficient. is the wavelength.2.1. Absorption effect
Absorption is an energy transfer process in which photons lose their energy and convert into other form, such as chemical (photosynthesis) and heat. The absorption can be expressed as the summation of absorption coefficient of various constituents
w
CDOM
phy
n
a a a a a . (2)
Where aw
is the absorption of pure seawater,
CDOMa is the absorption of coloured dissolved organic
materials,aphy
is the absorption of phytoplankton, and
n
a is the absorption of non-pigment suspended particles.
Many researchers have measured the absorption of pure seawater, which is tabled in [12].
The author of [13] state that the phytoplankton absorption is mainly caused by photosynthesizing of chlorophyll. The phytoplankton absorption coefficient can be expressed as
0 1 ln 440
phy phy phy
a a a a a . (3)
Where aphy
440
is the phytoplankton absorptioncoefficient at a reference wavelength of 440nm, a0
and a1
are the empirical coefficient with differentwavelengths.
CDOM consists of various dissolved organic matters. It presents highly absorptive and less scattering to the blue-green wavelengths. In the blue-blue-green light transmission window, the absorption coefficient of CDOM can be expressed as
440 exp
440
CDOM CDOM
a a S . (4)
Where aCDOM
440 is the CDOM absorption coefficient at a reference wavelength of 440nm, S is a scale coefficient for wavelengths which is always set to 0.014.Non-pigment suspended particles have similar absorption property to CDOM. The absorption coefficient of non-pigment suspended particles can be expressed as
440 exp
440
n n
a a S . (5)
Where an
440 is the non-pigment suspended particles absorption coefficient at a reference wavelength of 440nm,S is a scale coefficient for wavelengths which is always set to 0.011.
Figure 1. Absorption spectra of seawater
2.2. Scattering effect
Scattering is caused by variations in the refractive index that changes the propagation direction of photons. The scattering can also be expressed as the summation of absorption coefficient of various constituents
w
phy
n
b b b b . (6)
Where bw
is the scattering of pure seawater,
phy
b is
the scattering of phytoplankton, and
n
b is the scattering
of non-pigment suspended particles. Compared with absorption, scattering is deeply influenced by its concentrations.
As the absorption of pure seawater, the scattering of pure seawater can be found in [12].
The scattering of phytoplankton can be expressed as
0.62550
phy c Chl
b B C . (7)
Where Bc is a scale coefficient, and CChl is phytoplankton
concentration. Measured data of chlorophyll concentration in seawater collected by NASA is between 0.019mg/m3 and 32.79mg/m3.
The scattering behaviour of non-pigment suspended particles can be approximated by Mie scattering. According to the size of non-pigment suspended particles, it can be classified into the large particles and small particles. The scattering of non-pigment suspended particles can be expressed as
0
0
n small small large large
b b C b C . (8)
Where
1.70 1.151302 400
small
b . (9)
0.30
0.341074 400
large
b . (10)
small
C is the concentration of small particles in mg/m3,
large
C is the concentration of large particles in mg/m3. The
concentration of small particles is between 0.01 mg/m3 and 3 mg/m3.And the concentration of large particles is between 0.01 mg/m3 and 10 mg/m3.
Fig.2 shows whole absorption curve and the absorption curves due to various matters discussed below.
Figure 2. Scattering spectra of seawater
2.3. Propagation model
According to Beer-Lambert Law, the optical propagation through water can be described by the exponential attenuation model.
0
c z r
P P e . (11)
Where P0 is the power of transmitted light in watts, z is
the transmission distance in meter,Pr is the power of light
after transmitting distance z, c
is the attenuation coefficient discussed below.Account for the geometric attenuation, transmitter efficiency, and the receiver efficiency, the propagation model can be modified as
2 0
c z r t r r t
P P D D z e . (12)
Where t is the transmitter efficiency, ris the receiver
efficiency, Dr is the receiver aperture size in mm, Dt is the transmitter aperture size in mm,
is the divergence angle of light source in degree.3. Performance of Optical Transmitter
and Receiver
modulated on the optical carrier, which converts the electrical signal into light signal.
Then the beam is collimated and transmitted by the optical transmitting antenna. After propagating through water, a fraction of optical beam is collected by optical collecting antenna and passing photoelectric detector which converts the weak light signal into electrical signal. The electrical signal is demodulated by a signal processing unit and the original signal is recovered.
Source Modulation
Light Source
Optical Antenna
Sea Water Transmitter
Photodetector Optical Antenna
Sink Demodulation
Receiver
Channel
Figure 3. System design for UWOC
3.1. Transmitter
Based on the underwater channel analyzation, the choice of LED or laser vary in blue-green spectrum. Generally, LED-based systems have less influence on the complex underwater environment compared to laser-based systems due to the lager divergence. In order to increase the transmission distance, laser is a better choice owing to its high optical power.
Generally, the output of laser in blue-green spectrum ranges from 10mW to 10W. Several typical characteristics of laser in blue-green spectrum is shown in Tab. 1.
Table1. Characteristics of laser in blue-green spectrum [14]
Model Wavelength (nm)
Output power (mW)
Divergence angle (°)
MSL-W-457 457 500~2000 0.07
MSL-FN-473 473 1~100 0.07
MSL-R-532 532 1000~5000 0.09
MSL-FN-556 556 1~200 0.07
3.2. Receiver
The receiver in UOWC should provide wide FOV, high gain and high SNR. Although photomultiplier tube (PMT) provides high sensitivity and high frequency response, its lager size and high power become limited factors. Semiconductor consists of PIN photodiode and avalanche photodiode (APD). PIN possess unity gain, low cost, fast response time, yet APD shows a large internal gain and high quantum efficiency.
Thus, APD is a suitable choice for UOWC to increase transmission. Several typical characteristics of APD in blue-green spectrum is shown in Tab. 2.
Table 2. Typical characteristics of APD in blue-green spectrum [15]
Model
Effective photosensitive
area(mm)
Quantum efficiency
S2384 Φ 3.0 42~77 %
S2385 Φ 5.0 42~77 %
S12023-05 Φ 0.5 42~77 %
S12023-10 Φ 1.0 42~77 %
Note: The quantum efficiency rises with the increase of wavelength, e.g.42%@450nm and 77%@556nm.
4. Modulation Schemes
The selection of modulation is a key step for UWOC system. Generally, modulation schemes are divided into two categories: Intensity modulation and coherence modulation. Due to complexity and cost, Intensity modulation and direct detection (IM/DD) techniques are implemented.
The most common modulation schemes considered for UOWC consist of on-off-keying (OOK), Pulse Position Modulation (PPM) and Differential phase shift keying (DPSK). The bit error rate performance for different modulation schemes is given in Tab. 3.
Table 3. Bit error rate performance for different modulation schemes [16]
Modulation
schemes Bit error rate
OOK 1
2 2 2
S erfc
DPSK 1 1
2 2 2
S S
erfc erfc
L-PPM 1 12 1 21
2 2 2 2
k L k
erfc LS erfc LS
L
Where S is the SNR, equal to the average number of photons-per bit (PPB) received and k is set to 0.5 in this study.
To establish the relationship between the modulation schemes and received optical power, the photons-per-bit (PPB) is deduced as [17]
r
PPBP hvR. (13)
Where Pr is received optical power in watts, h is Planck's constant, v is frequency of the light, R he data rate in bits per second. In this way, the bridge between bit error rate and received is built.
5. Numerical Result
To calculate the UWOC link power several parameters taken into account as geometric loss, link margin, received power and bit error rate. This part illustrates the effects of channel attenuation and geometric loss on the performance of UWOC system.
Channel attenuation depends on attenuation resulted from of ocean and the wavelength of transmitted light assuming that Assuming power of transmitted light is 1W,divergence angle is 0.09°, transmitter aperture size is 1.5mm, receiver aperture size is 3mm, and transmitter efficiency is 90%.The detected power can be illustrated in Fig.4.
Figure 1.Detected power versus wavelength
No matter how far the transmission distance is, the attenuation at the wavelength of 500nm to 560nm has little effect on the optical power, and the wavelength at 540nm is the optimum choice. Compared with the laser products discussed above, MSL-R-532 and MSL-FN-556 can be the candidates of transmitter.
According to Eq. (12), the geometric loss can be expressed as
2G Dr Dt z
. (14)
That means geometric loss is influenced by the transmitted distance, transmitted aperture, divergence angle and receiver aperture. For MSL-R-532 and MSL-FN-556, there are two differences in divergence angle and the transmitted power. Fig.5 illustrates the geometric loss versus the divergence angle.
Figure 2. Geometric loss versus divergence angle
Geometric loss is proportional to divergence angle, which suggest that when the divergence angle increases, geometric loss enhances. That means geometric loss effect can be minimized by using smaller divergence.
Figure 3. Detected power versus distance for MSL-R-532
and MSL-FN-556
Fig.6 demonstrates Detected power versus distance for MSL-R-532 and MSL-FN-556. This figure shows that the transmitted power can be the more critical factor. MSL-R-532 is suggested to maximize the distance for UWOC.
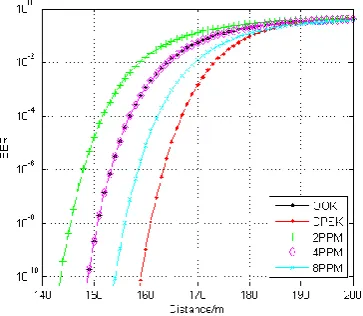
Using equations for BER, we can plot the performance using various modulation versus the distance at 1Mbits/s, which is shown in Fig.7.
Figure 4. BER versus distance
It is shown that DPSK and 8-PPM provide better BER performance. But it consumes large power and more complex to implement in embedded device. OOK and 2-PPM are implemented for its simplicity.
The numerical results indicated a point-to-point line-of sight link could achieve 1Mbits/s at 150m with 1W of transmitted power.
6. Conclusion
This paper investigates how to increase communication distance of underwater wireless optical communication system. The main factors that affect the communication distance for UWOC are channel characterization, spread characteristics of the beam, and modulation. Considering the channel and system parameter, the communication distance is about 150m at the data rate of 1Mbits/s. Enhancing transmission power, using optical antenna, employing high sensitivity photoelectric detector and forward error correction can be considered sequentially to increase transmission distance.
References
[1] Zeng Z, Fu S, Zhang H, et al. A Survey of Underwater Optical Wireless Communications [J]. IEEE Communications Surveys & Tutorials, 2017, 19.
[2] Sogandares F M, Fry E S. Absorption spectrum (340-640 nm) of pure water. I. Photo thermal measurements. [J]. Applied Optics, 1997, 36(33):8699-709.
[3] Boass A, Wilson T H. Variations of light absorption by suspended particles with chlorophyll a concentration in oceanic (case 1) waters: Analysis and implications for bio [J]. Journal of Geophysical Research Oceans, 1998, 103(C13):31033–31044.
[4] Kishino M, Tanaka A, Oishi T, et al. Temporal and spatial variability of chlorophyll a, suspended solids, and yellow substance in the Yellow Sea and East China Sea using ocean color sensor[C] International Asia-Pacific Symposium on Remote Sensing of, the Atmosphere, Environment, and Space. International Society for Optics and Photonics, 2001:179-187.
[5] Lin H. The Study on Mie Scattering and Brillouin Scattering of Oceanic Suspended Particles [D]. Huazhong University of Science and Technology, 2007. (In Chinese)
[6] Duntley S Q. Light in the Sea [J]. Journal of the Optical Society of America, 1963.
[7] B. Snow; J. P. Flatley; D. E. Freeman; M. A. Landry; C. E. Lindstrom; J. R. Longacre; J. A. Schwartz. Underwater propagation of high-data-rate laser communications pulses [M]. 1992.
[8] Tivey M, Fucile P, Sichel E. A Low Power, Low Cost, Underwater Optical Communication System[C]. 2004 [9] Arnon S, Kedar D. UV solar-blind FSO sub-sea video
communications: link budget study [J]. Proc Spie, 2008, 7112:6393-6398(6).
[10] Oubei H M, Duran J R, Janjua B, et al. 4.8 Gbits/s 16-QAM-OFDM transmission based on compact 450-nm laser for underwater wireless optical communication[J]. Optics Express, 2015, 23(18):23302-9.
[11] Baghdady J, Miller K, Kelly J, et al. Underwater Optical Communication Link Using Wavelength Division Multiplexing, Polarization Division Multiplexing and Orbital Angular Momentum Multiplexing[C]. Frontiers in Optics. 2016:FTh4E.4.
[12] Morel A. Optical Properties of Pure Water and Pure Sea Water [J]. Optical Aspects of Oceanography, 1974:1-24. [13] Bricaud A, Morel A, Babin M, et al. Variations of light
absorption by suspended particles with chlorophyll a, concentration in oceanic (case 1) waters: Analysis and implications for bio-optical models [J]. Journal of Geophysical Research Oceans, 1998, 103(C13):31033– 31044.
[14] CNILaser, http://www.cnilaser.com/. [15] SiAPD, http://www.hamamatsu.com.cn/.
[16] Sui M, Yu X, Zhang F. The Evaluation of Modulation Techniques for Underwater Wireless Optical Communications[C] International Conference on Communication Software and Networks. IEEE Xplore, 2009:138-142. (In Chinese)

![Table 3. Bit error rate performance for different modulation schemes [16]](https://thumb-us.123doks.com/thumbv2/123dok_us/8432580.1698324/4.595.317.549.277.361/table-bit-error-rate-performance-different-modulation-schemes.webp)